How to Read Marine Weather Charts ?
- Henri
- janvier 27, 2026
How to Read Marine Weather Charts (Surface Analysis Charts)
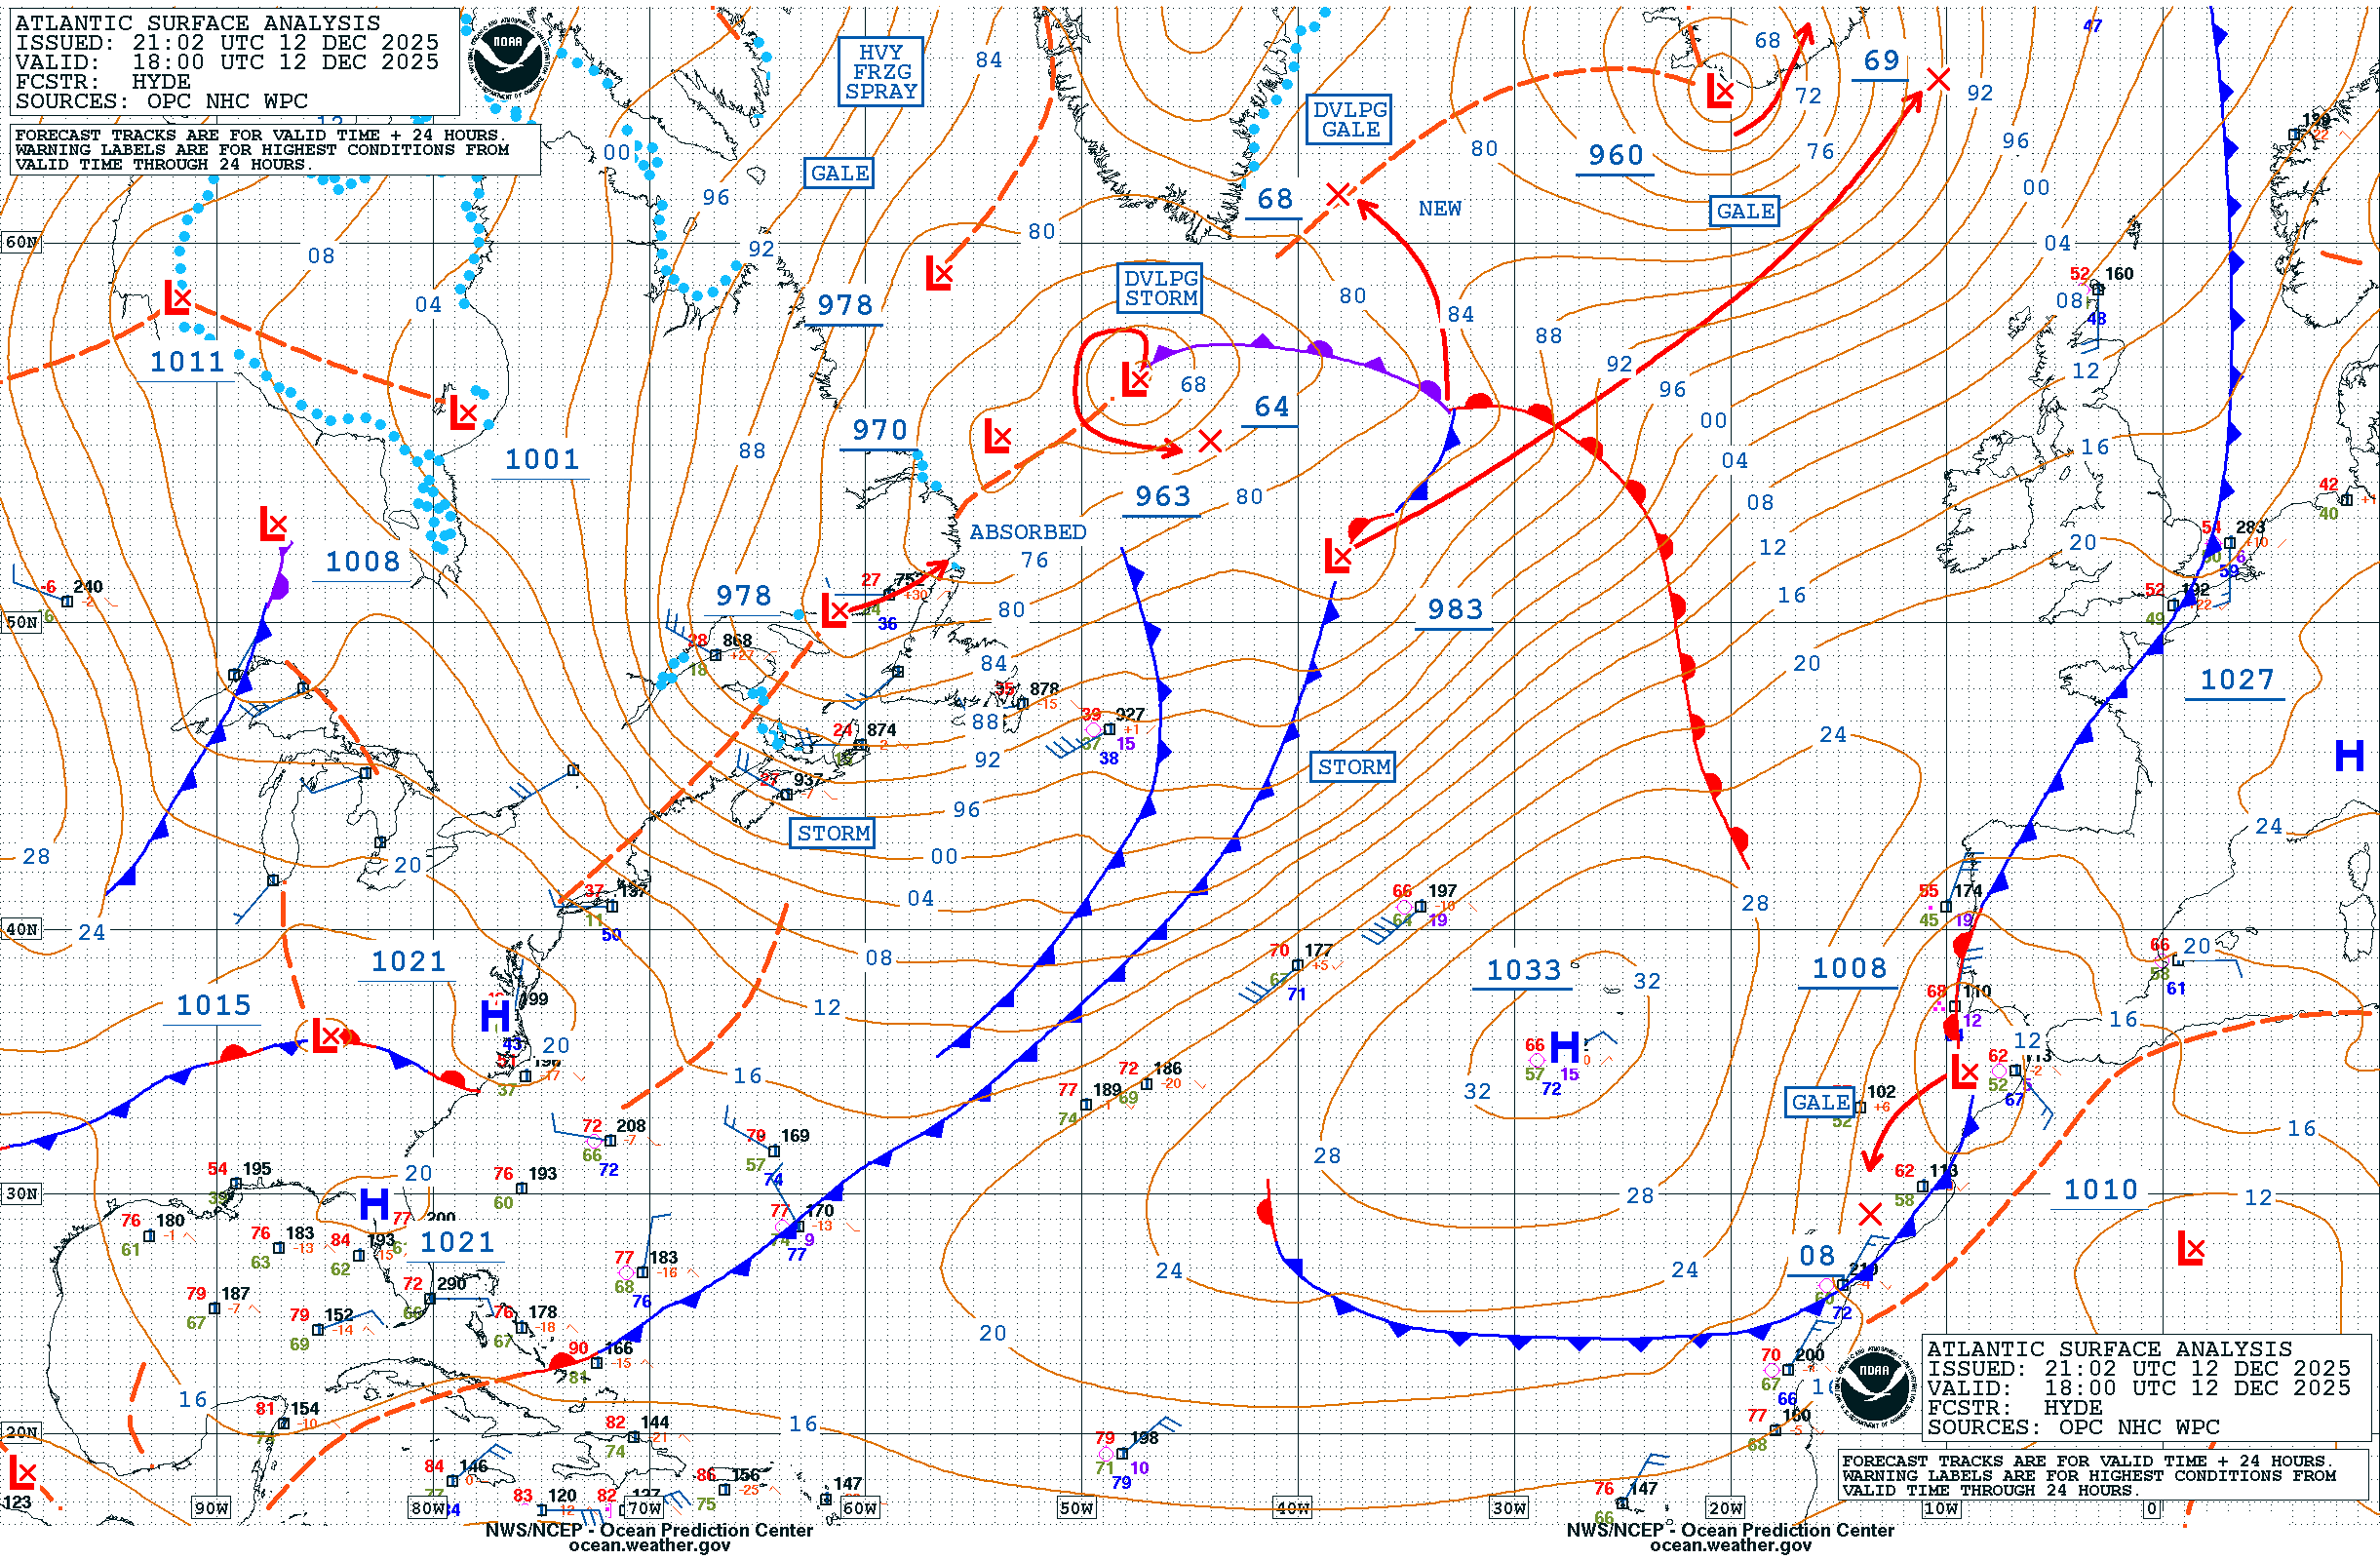
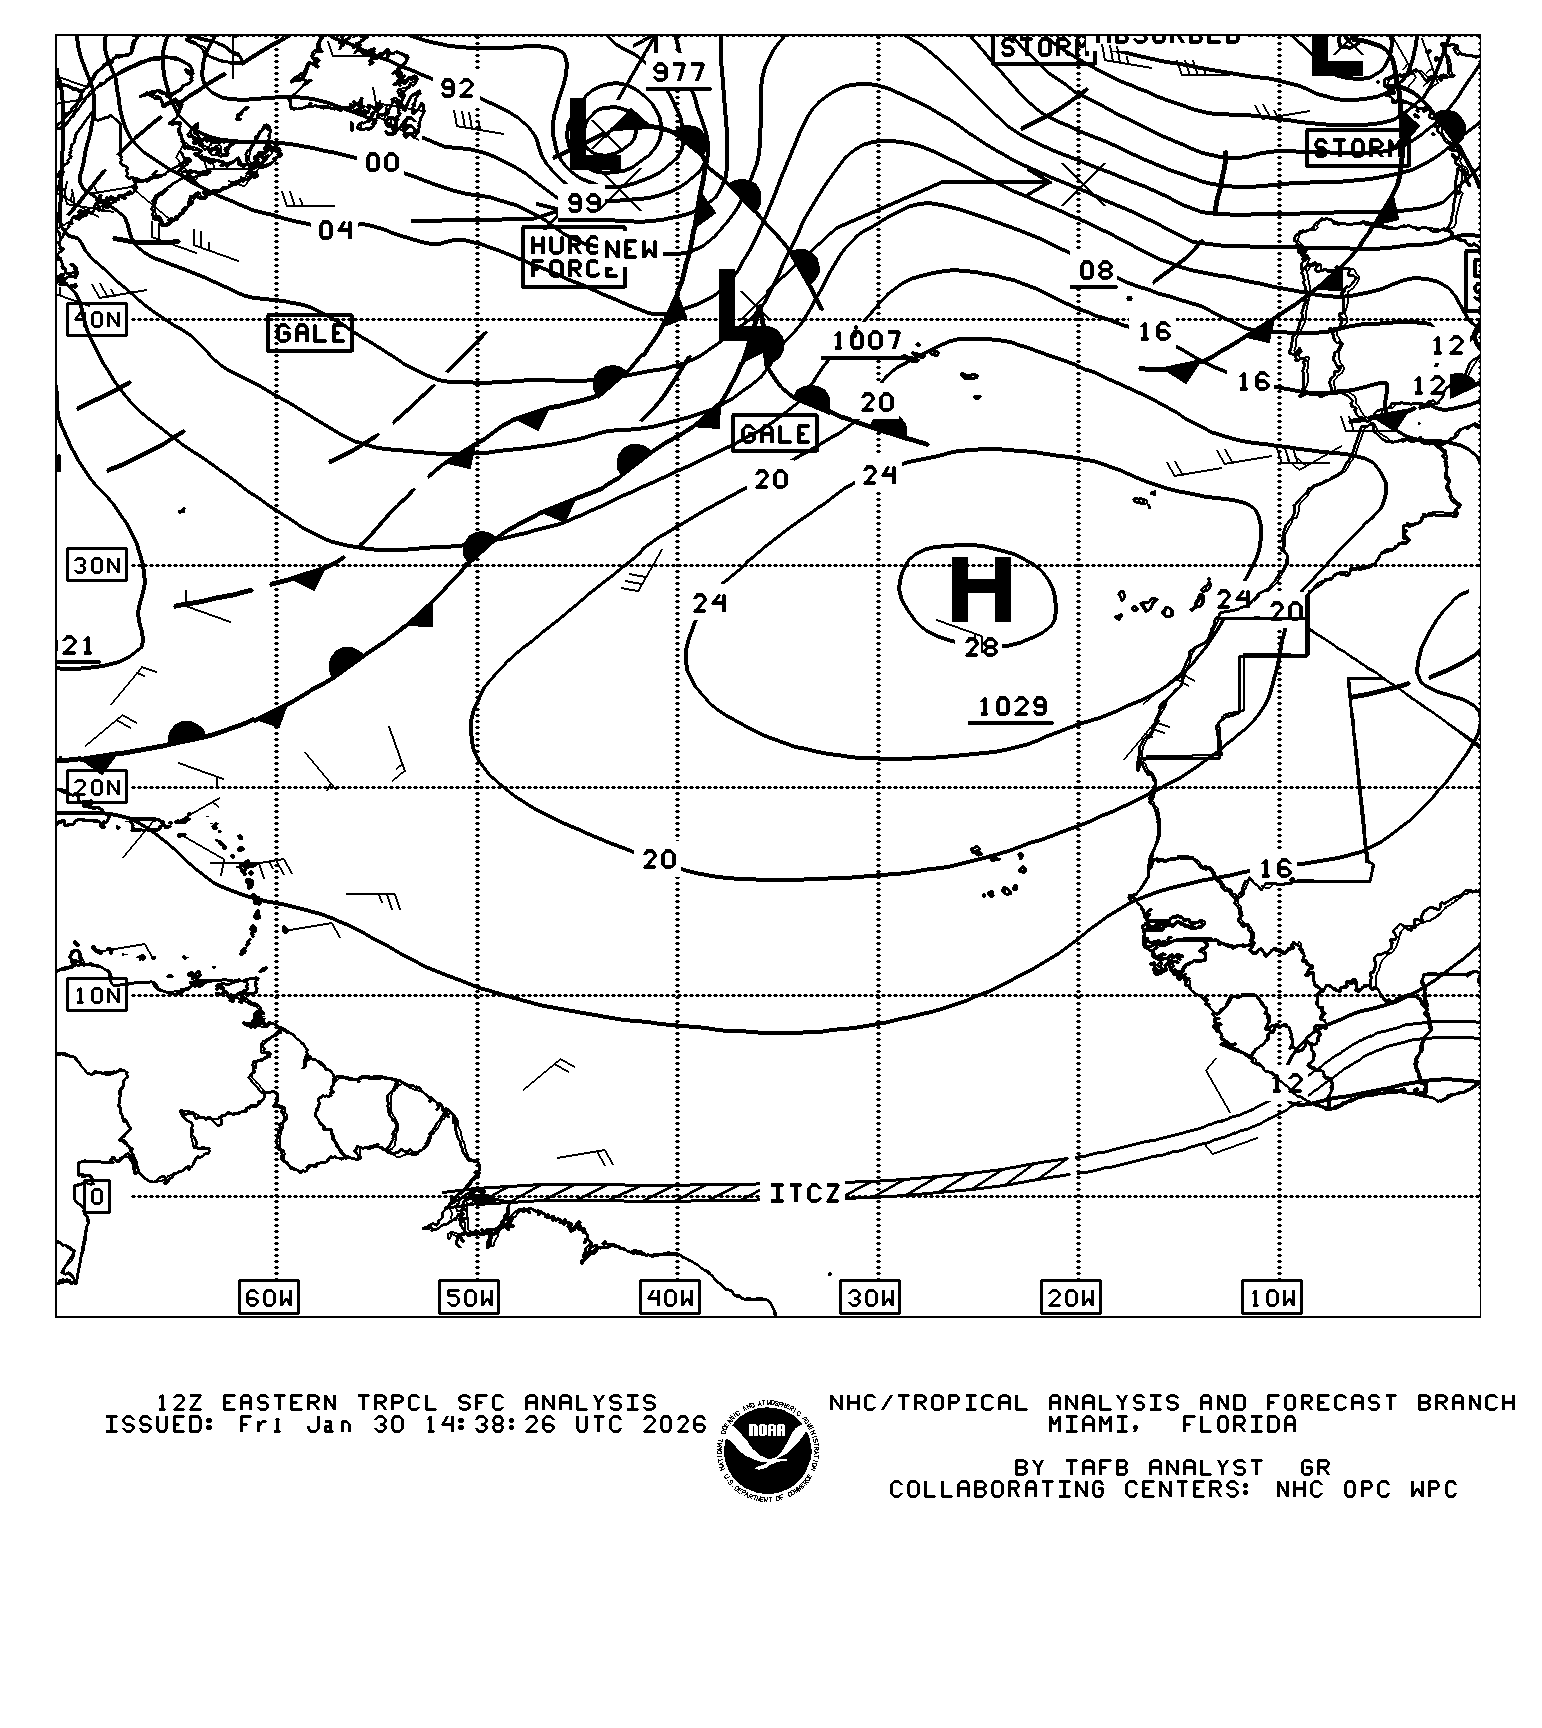
Surface analysis charts are essential tools for any sailor. They provide a synoptic view of current weather conditions and help anticipate weather changes. This guide explains how to interpret the symbols and information on these charts.
What is a Surface Analysis Chart?
A Surface Analysis Chart is a representation of weather conditions at the Earth’s surface at a given time. These charts are produced by national weather services such as NOAA (USA), the Met Office (UK), or Météo-France.
They use a combination of lines, symbols, and color codes to represent:
- Pressure systems (highs and lows)
- Weather fronts
- Isobars (lines of equal pressure)
- Weather station observations
- Precipitation areas
Pressure Systems: Highs (H) and Lows (L)
Pressure systems are the main drivers of weather. They are indicated by the letters H (High pressure) and L (Low pressure).
High Pressure (H) – Anticyclone
H
Symbol: H (blue) with central pressure in millibars (e.g., 1035)
Characteristics: Air descends and spreads out, creating divergent winds. Clockwise rotation (Northern Hemisphere).
Associated weather: Generally stable conditions, clear skies, light to moderate winds, good visibility.
Low Pressure (L) – Depression
L
Symbol: L (red) with central pressure in millibars (e.g., 995)
Characteristics: Air converges toward the center and rises, creating clouds. Counter-clockwise rotation (Northern Hemisphere).
Associated weather: Unsettled weather, clouds, precipitation, strong winds. The lower the pressure, the more intense the storm.
💡 Navigation tip: A low with pressure below 980 mb is considered deep. NOAA charts sometimes indicate “GALE” (34-47 knots), “STORM” (48-63 knots), or “HURRICANE FORCE” (≥64 knots) near intense lows.
Isobars: Lines of Equal Pressure
Isobars are the thin lines connecting points of equal atmospheric pressure. They are typically spaced 4 millibars apart (1008, 1012, 1016, 1020 mb, etc.).
Key rule: Isobar spacing indicates wind strength:
| Closely spaced isobars | → | Strong gradient = Strong winds |
| Widely spaced isobars | → | Weak gradient = Light winds |
💡 Buys-Ballot’s Law: In the Northern Hemisphere, if you stand with your back to the wind, low pressure is always on your left. Wind blows parallel to isobars (with a slight angle toward low pressure due to friction).
Weather Fronts
Fronts are boundaries between different air masses. Their passage typically brings significant changes in temperature, wind direction, and weather conditions.
Cold Front

Symbol: Blue line with triangles pointing in the direction of movement
Description: Cold air mass pushing into warm air. Cold fronts move faster (25-30 knots) because the denser cold air undercuts the warm air.
Weather at passage: Thunderstorms or intense but brief showers, rapid wind shift (SW → NW), sharp temperature drop, quick clearing after passage.
Warm Front
Symbol: Red line with half-circles pointing in the direction of movement
Description: Warm air mass sliding over cold air. Slower (10-15 knots) because warm air must ride up over cold air.
Weather at passage: Prolonged steady precipitation, stratiform clouds (cirrus → altostratus → nimbostratus), reduced visibility, possible fog, gradual temperature rise.
Stationary Front
Symbol: Alternating blue triangles and red half-circles on opposite sides of the line
Description: Two air masses that aren’t moving relative to each other. Can persist for several days.
Associated weather: Prolonged overcast conditions, persistent precipitation over the area, stagnant conditions.
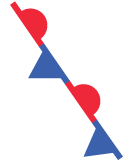
Occluded Front

Symbol: Purple line with alternating triangles and half-circles on the same side
Description: The faster cold front catches up to the warm front. Warm air is lifted aloft.
Associated weather: Mixed conditions, varied precipitation. Significance: The low is reaching maturity and beginning to weaken.
Other Boundaries
Trough
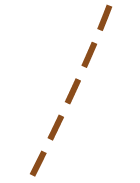
Symbol: Brown/orange dashed line in a U or V shape, often marked “TROF”
Description: Elongated area of relatively low pressure, without being a true front.
Associated weather: Atmospheric instability, wind convergence, risk of thunderstorms or unsettled weather.
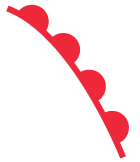
Squall Line

Symbol: Line with two red dots, often marked “SQLN”
Description: Organized line of thunderstorms, often located ahead of a cold front.
⚠️ DANGER: Violent winds, possible hail, destructive gusts. Potentially dangerous conditions for navigation!
Dry Line

Symbol: Orange/brown line with half-circles pointing toward moist air
Description: Boundary between dry continental air and moist maritime air (common in the US between Gulf of Mexico air and Southwest desert air).
Associated weather: Violent thunderstorm development along the line, especially in spring/summer.
Tropical wave
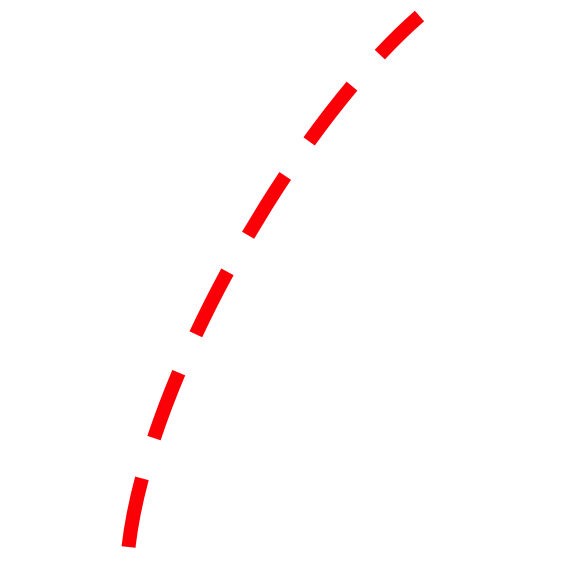
Symbol: Wide dotted red line.
Description: Rainy and stormy front moving from east to west in the intertropical zone. Frequent during the hurricane season between Africa and the Caribbean.
Associated weather: Squalls, sometimes intense, which can develop into tropical storms and then hurricanes as they progress.
📥 Complete reference: Official WPC/NOAA Front Legend
Weather Station Observations (Station Plots)
Detailed charts display weather station observations as station plots. These compact symbols summarize a lot of information at a glance.
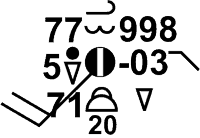
Station Plot Elements
| Position | Information |
|---|---|
| Center | Cloud cover (● overcast, ◐ partly cloudy, ○ clear) |
| Upper left | Temperature (°F or °C) |
| Lower left | Dew point |
| Right | Pressure (last 3 digits: 218 = 1021.8 mb) |
| Extending line | Wind direction (where it’s coming from) |
| Barbs | Wind speed (see below) |
Reading Wind Barbs
Wind barbs indicate wind speed. Add the symbols together to get the total speed:
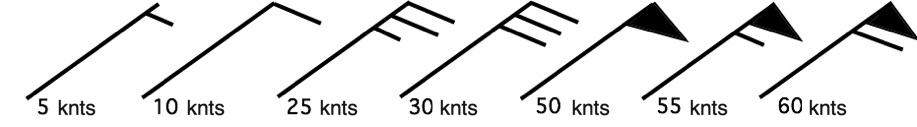
💡 Example: 1 pennant + 2 full barbs + 1 half barb = 50 + 20 + 5 = 75 knots
Precipitation Symbols
| Symbol | Description |
|---|---|
 | Rain (more dots = heavier) |
 | Snow |
 | Drizzle |
 | Showers |
 | Thunderstorm |
 | Fog |
📥 Download: Complete Weather Symbol Guide (PDF) – NOAA
Understanding “Ahead” and “Behind” a Front
These terms refer to front movement, not geographic direction:
| Term | Meaning | Example (Cold Front) |
|---|---|---|
| Ahead of the front | In front of the frontal movement | In the warm air mass |
| Behind the front | After the front has passed | In the cold air mass |
💡 Practical application: If a forecast says “showers behind the cold front,” expect precipitation AFTER the front passes through your location.
Common Units
| Measurement | Unit | Conversion |
|---|---|---|
| Pressure | millibars (mb) or hectopascals (hPa) | 1 mb = 1 hPa = 0.0295 inHg |
| Wind speed | knots (kt) | 1 kt = 1.15 mph = 1.85 km/h |
| Temperature | °F (US) or °C (international) | °C = (°F – 32) × 5/9 |
Chart Sources and Frequency
| Source | Coverage | Update Frequency |
|---|---|---|
| NOAA OPC | Atlantic, Pacific, Arctic | Every 6 hours (00, 06, 12, 18 UTC) |
| NOAA WPC | North America | Every 3 hours |
| Met Office | North Atlantic, Europe | Every 6 hours |
| BOM | Southern Hemisphere | Every 6 hours |
Technical References
Official documentation:
- NOAA Unified Surface Analysis Manual (PDF) – Complete 33-page technical reference
- NOAA JetStream – Surface Weather Maps – Official NOAA online tutorial
- WPC Front Codes – Official front symbol reference
Additional learning resources:
- How to read Surface Weather Maps (NOAA JetStream) – Official NOAA guide with illustrations
- Surface Weather Plots (NOAA JetStream) – Station plot details