How to display weather maps and satellite images?
- Francis
- février 14, 2026
Numerous weather surface analysis maps, also known as isobaric or fronts maps, are available in the application to supplement GRIB files and facilitate the interpretation of weather situations and forecasts.
These charts come from various meteorological agencies and are produced by forecasters: NOAA (USA), MetOffice (UK), BOM (Australia), etc. A special chart for observing Sargassum off the coast of the Caribbean is also provided by USF (University of South Florida). All are stored on our own servers and to download from it.

Open the Hamburger menu and select the “Maps” tab.
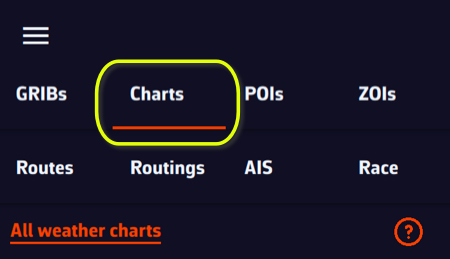
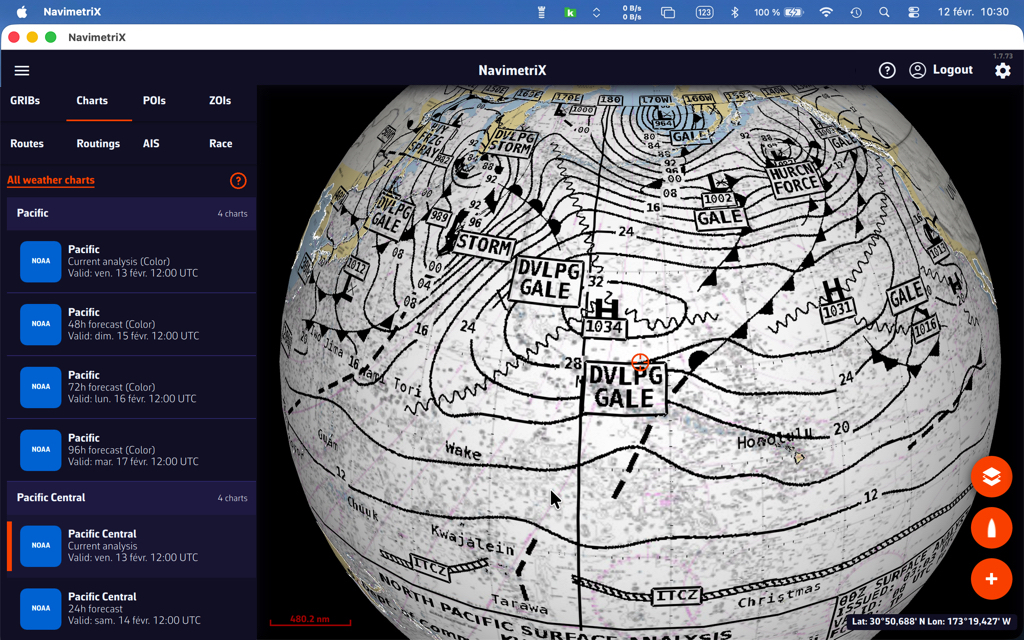
The Maps menu is dynamic, offering maps available according to the target’s location on the world map.
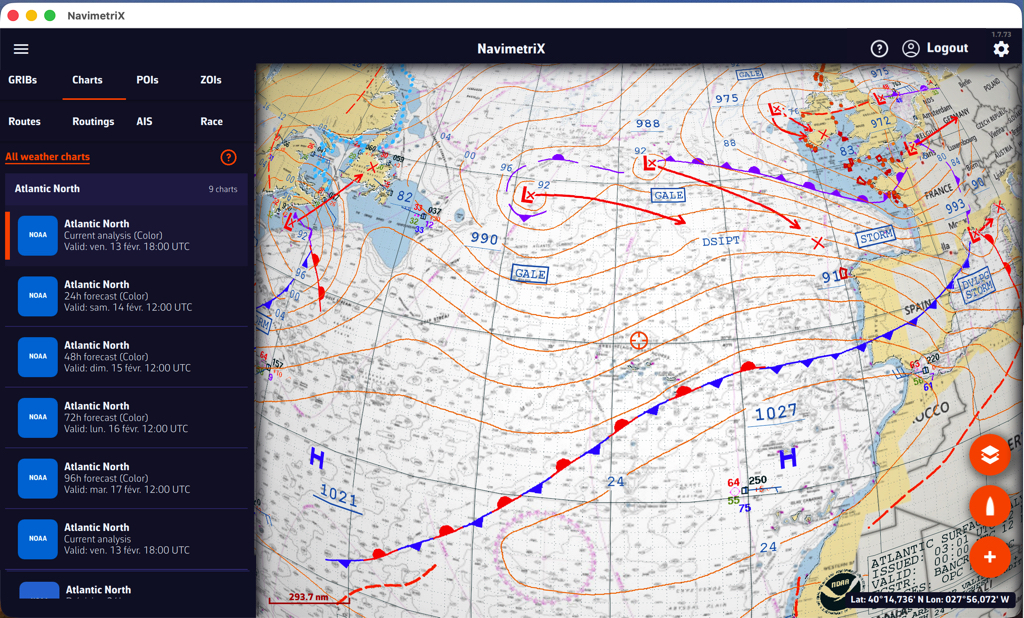
Displaying NOAA weather maps
NOAA maps range from current analysis up to 4-day forecasts, updated every six hours.
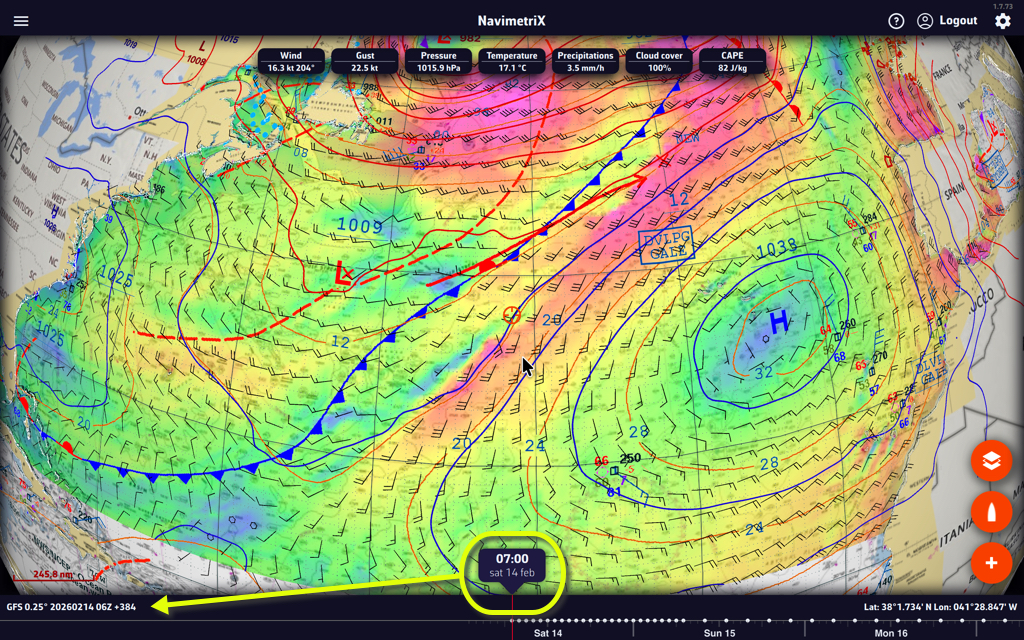
Overlaying NOAA weather maps with GRIBs
Overlaying the NOAA map with the GFS file provides additional insight with the drawing of fronts and specific annotations.
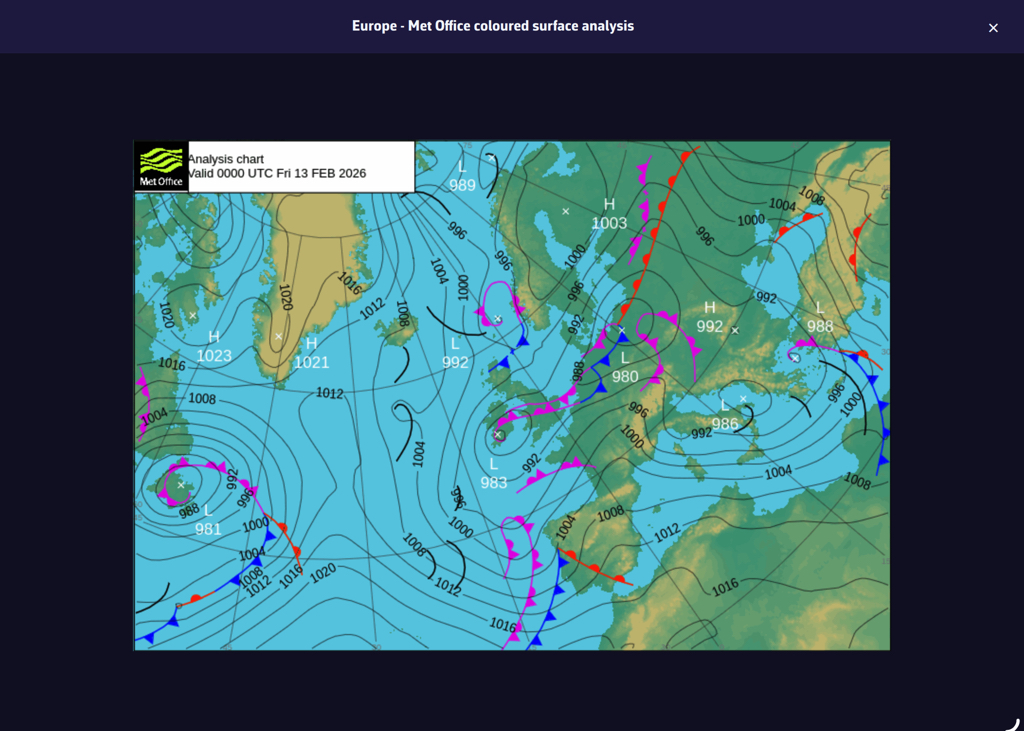
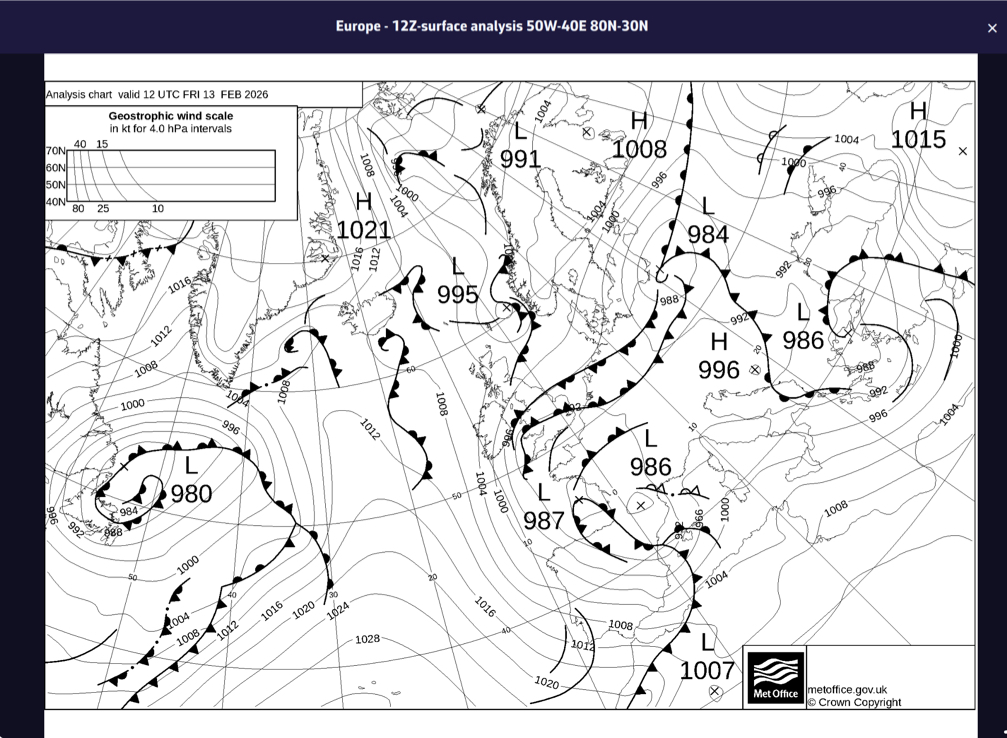
Displaying MetOffice weather maps
MetOffice maps are not in a format that allows them to be overlayed on the nautical chart in 3D. They are therefore displayed in their original format, in color or black and white. They only cover the Northeast Atlantic and Europe. They range from current analysis up to 5-day forecasts.
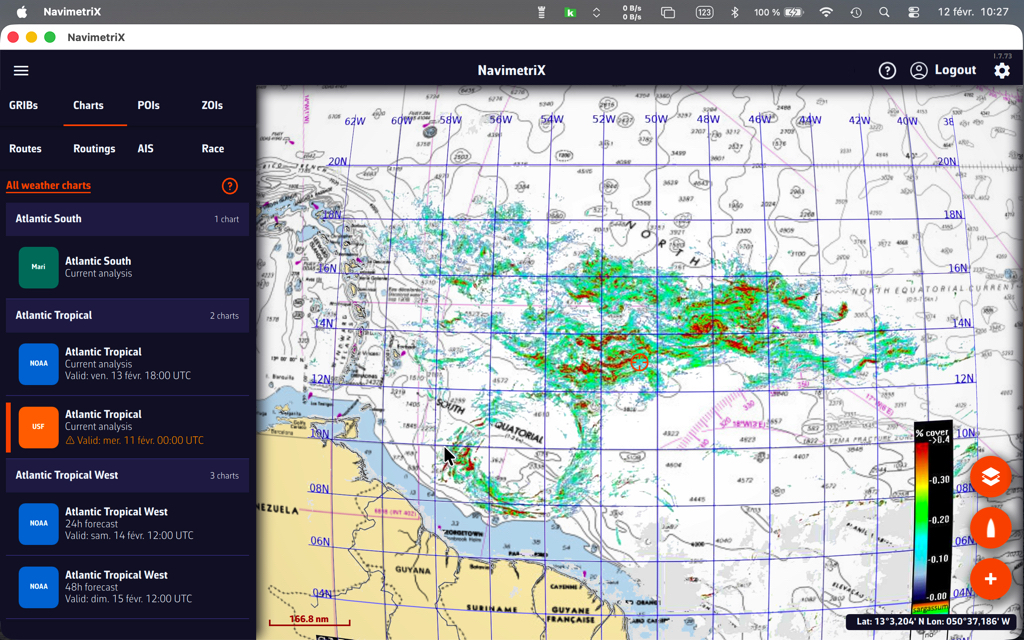
Sargassum map
Published by the USF, the sargassum density map covers the eastern Caribbean from W38 to W62 and from N20 to the Equator. It is updated daily. It is mainly of interest for crossings to the West Indies.
Satellite images
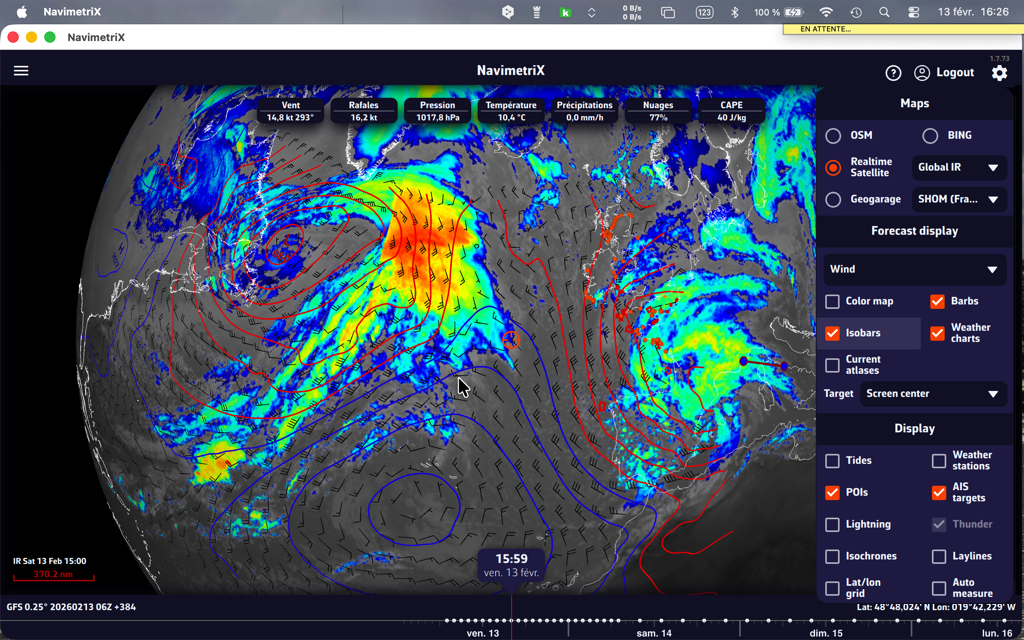
Three types of satellite images are available, covering the entire world. They are taken from different weather satellites and provide a near real-time view of cloud cover and precipitation.

Tap/Click on the layers button and select the “Realtime satellite” option in the Maps section.
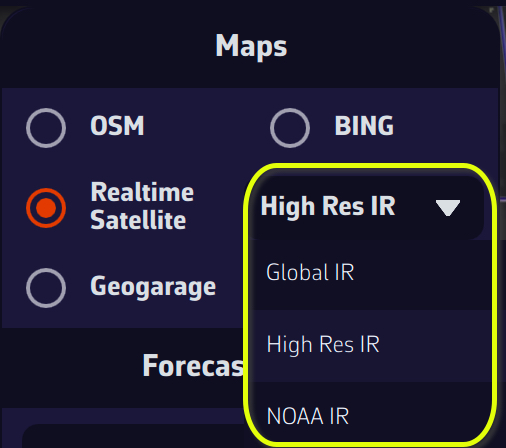
High Res IR, Global IR, and NOAA IR are combinations of infrared images that display cloud cover, and precipitation totals for the first two. By combining a satellite image and an isobaric map, you can obtain an instant view of weather conditions.
You can also add thunder and lightning displays!
The color coding of precipitation totals on radar images follows the scale below (source: Météo-France) :

For information on interpreting frontology (isobaric) maps, see this FAQ: How to read marine weather maps.