How to display tides on the chart?
- Francis
- octobre 23, 2025
By default, a tide gauge is displayed on the cartography for each referenced station.
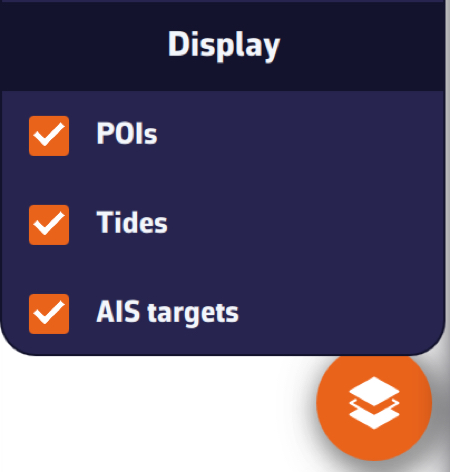
The display can be disabled by opening the layers menu and unchecking the Tide box. The gauges currently display dynamically:
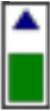

- Flow in green
- Ebb in red
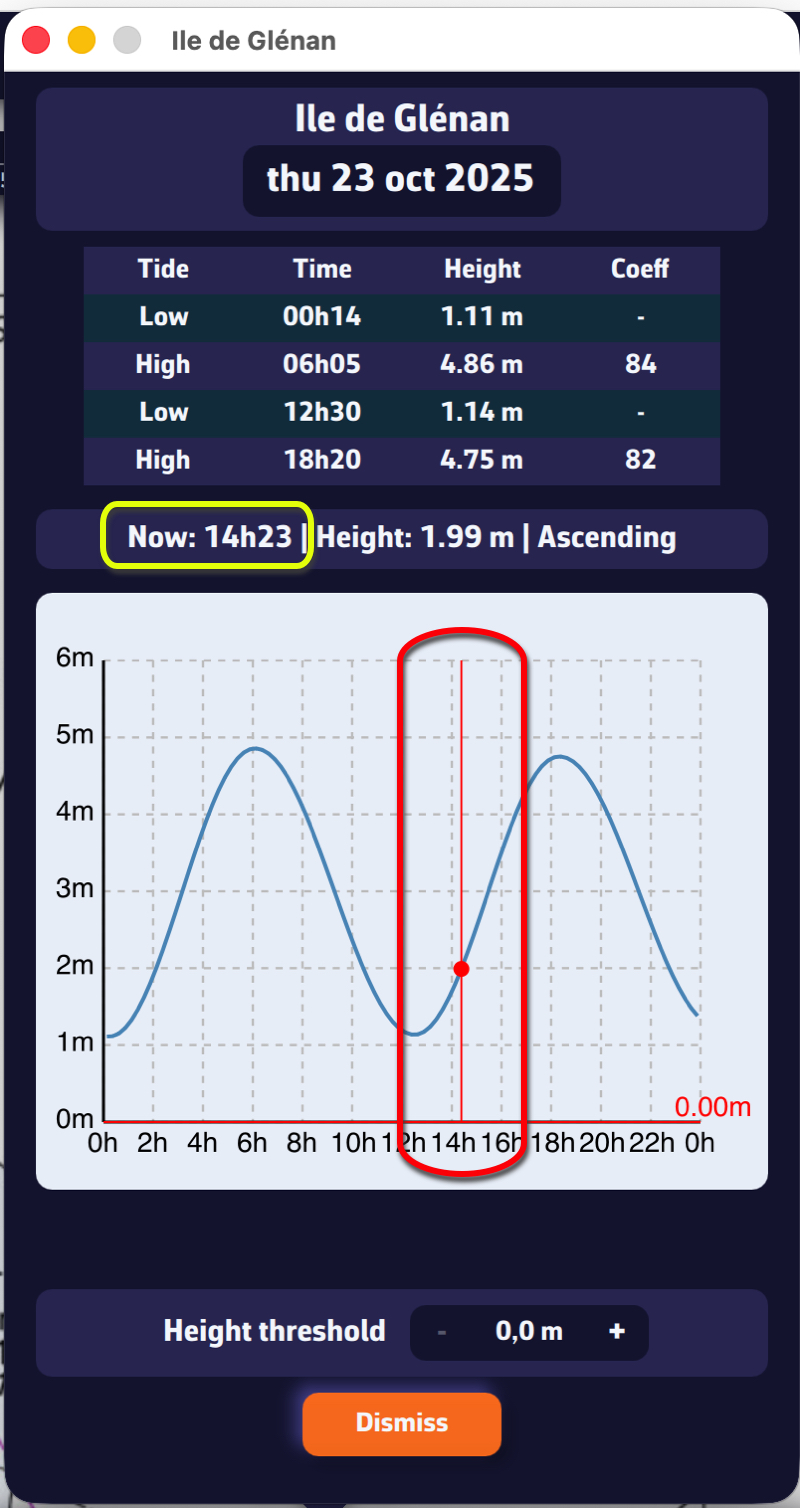
Tapping on each gauge opens a tide graph showing the tide curve and the current water level, represented by the vertical timeline.
The graph is topped by a table showing the times, water heights and tidal coefficients for the day.
Tapping/clicking on the date above the table opens the calendar, allowing you to select another day/month.
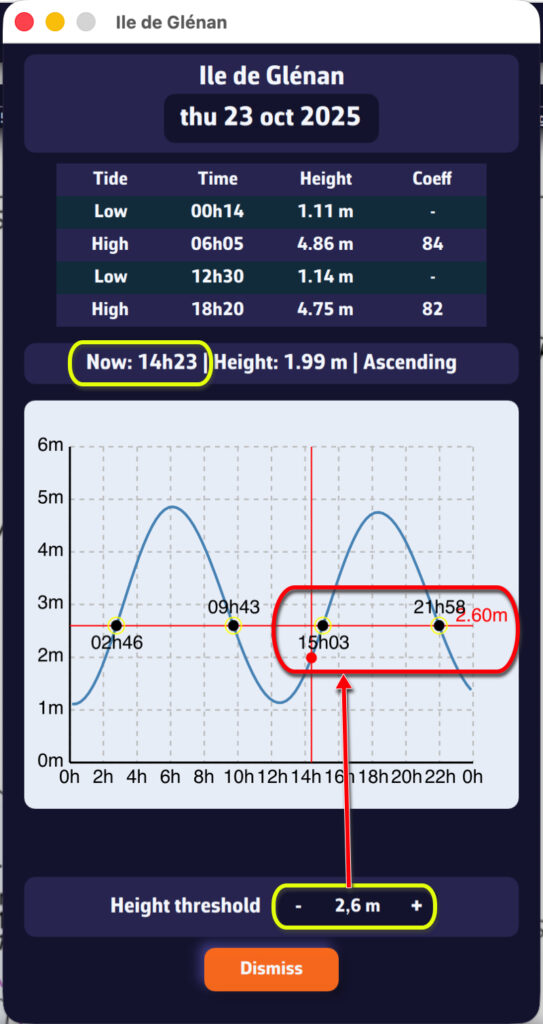
The height threshold can be used to determine:
- What the water level will be at a given time
- What time a given threshold will be reached