How do I change the weather data display?
- Francis
- février 23, 2026

Change the weather data display in Navimetrix:
- Open the Settings menu: tap the gear icon in the top right corner.
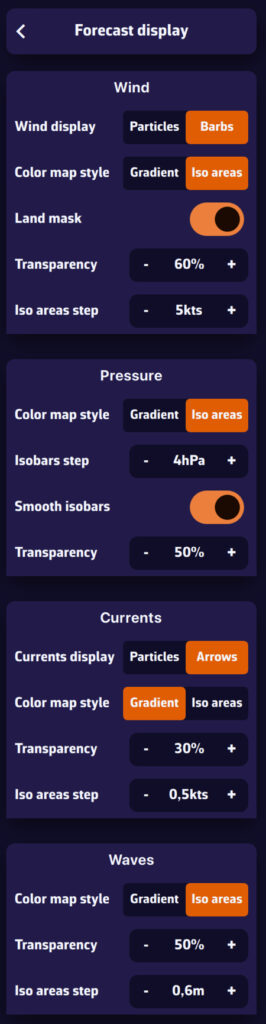
- Go to the “Forecast display” section: you will see four blocks, each corresponding to a type of weather data:
- Wind
- Pressure
- Currents
- Waves
- Customize the Wind display:
- Barbs: classic display with arrows and small barbs indicating strength.
- Particles: small animated particles representing the flow. Very effective for visualizing the wind, but be careful of battery consumption.
- Color map style: Gradient, continuous color variation, or Iso areas, according to wind intensity.
- Land mask: allows you to easily distinguish land areas.
- Transparency: adjust the visibility of the colored background.
- Step between iso zones: adjust the fineness of the wind ranges displayed.
- Iso areas step: display by ranges (e.g., 5-10 knots, 10-15 knots).
- Customize the pressure display:
- Color map style: Gradient, continuous pressure visualization, or Iso areas (isobars): pressure lines spaced at an interval that you can adjust.
- Isobar step: spacing of isobars in hectoPascals.
- Customize Currents display:
- Classic arrows: direction and strength of currents.
- Animated particles: small animated particles representing the flow. Very effective for visualizing large-scale currents, but be careful of battery drain.
- Color map style: Gradient, continuous current values visualization, or Iso areas (isobars): current values spaced at an interval that you can adjust in knots.
- Customize Waves display:
- Waves are always represented by arrows indicating the direction.
- Color gradient: continuous visualization of wave height.
- Iso areas: wave height spaced at intervals that you can adjust.
Tip: use Particles display mode or Iso areas for better reading of large-scale conditions. For sea navigation, use Barbs and Isobars, which are more accurate and less resource-intensive.