How do I adjust and display the wind?
- Henri
- octobre 16, 2025
Wind Settings
Open the Settings panel by tapping the cogwheel at the top right of the upper ribbon, then select GRIB Display.
- Wind Display
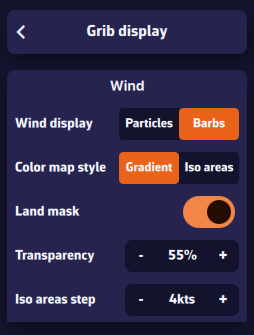
In the “Wind” section, select Particles or Barbs. Animated particles show the wind flow but consume more system resources and therefore battery — best avoided while sailing. Vectors and barbs are the classic meteorological representation of wind direction and strength. They are positioned on each grid point of the GRIB file and are more resource-efficient.
The Gradient style represents wind strength using a rainbow color scale — from blue (light or calm winds) to magenta (strong winds), through shades of green, yellow, orange, and red. Especially suitable for wind data.
The Isoplane style displays the data with the same colors but as equal-value zones. This style is better suited for data such as wave height, for example in 50-cm increments.
The Land Mask displays data over land as well. This is particularly useful when sailing among islands, to keep a continuous sea/land display.
Transparency allows you to adjust the color overlay depending on the background (satellite map or nautical chart).
The Iso-zone step adjusts the spacing between isoplane zones depending on the type of data (waves, precipitation, temperature, etc.).
Wind Display
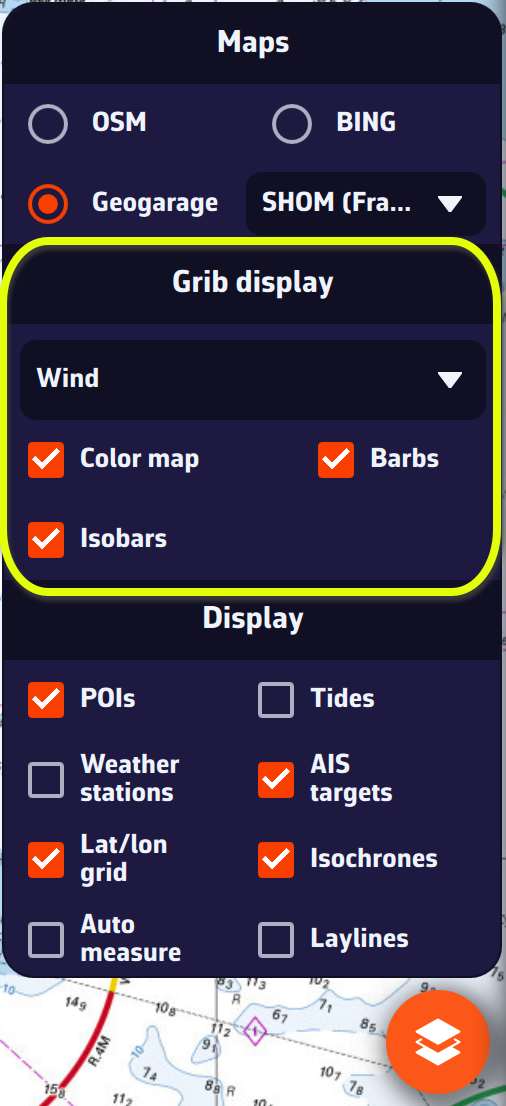
On the map, the Layer button at the bottom right of the screen lets you choose what to display.
In the GRIB Display section, the drop-down menu allows you to select which data to display. If a weather GRIB (for example an IFS model) is displayed, Wind will be selected by default. You can enable or disable the color background, particles or barbs (according to your previous setting above), and isobars (lines of equal atmospheric pressure).
If you have displayed a wave GRIB file, you can enable or disable the color background and the wave direction arrows.
This section automatically adapts to the type of GRIB file displayed on the screen: weather, waves, or currents.