L'application de navigation universelle
Tous vos outils de navigation rassemblés en une seule application accessible sur tous vos appareils.
Télécharger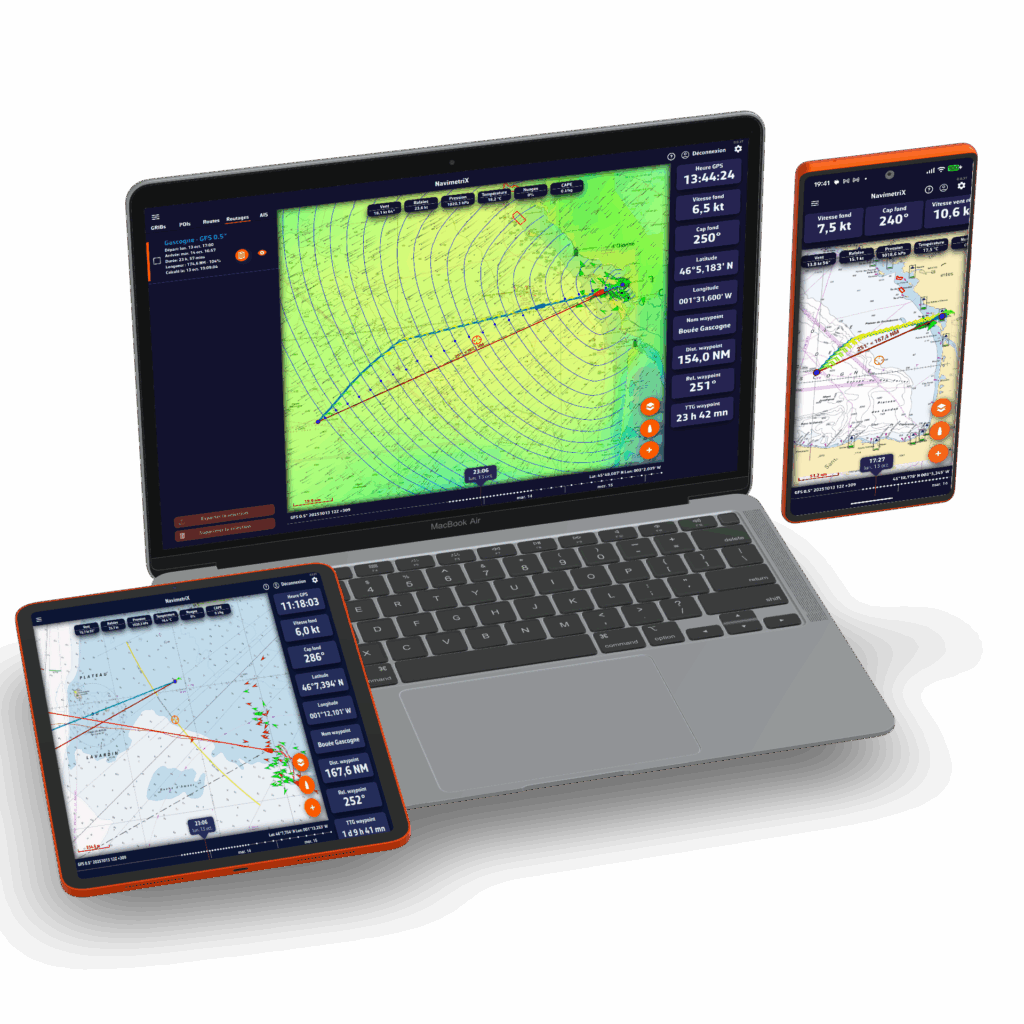
Les avantages de NavimetriX
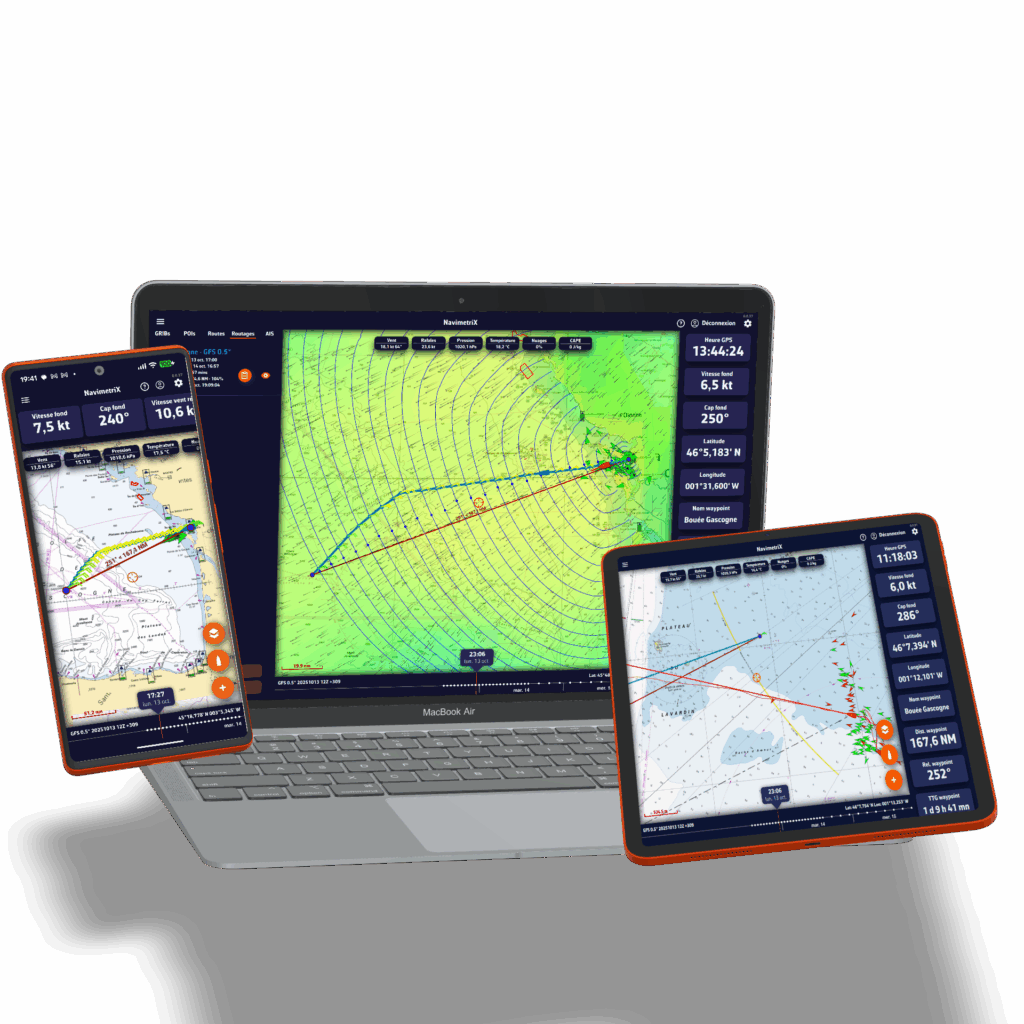
Disponible pour tous vos appareils
Où que vous vous trouviez, sur votre bateau, à la maison, en déplacement, au bureau, préparez votre navigation. Une fois à bord, lancez l'appli et naviguez!
Tester gratuitementProfitez de l'application quel que soit l'appareil utilisé : vos réglages sont enregistrés dans le Cloud, ce qui vous permet de retrouver et mettre à jour vos projets et navigations où que vous soyez. NavimetriX fonctionne sur Android, Windows, iOS et MacOs.
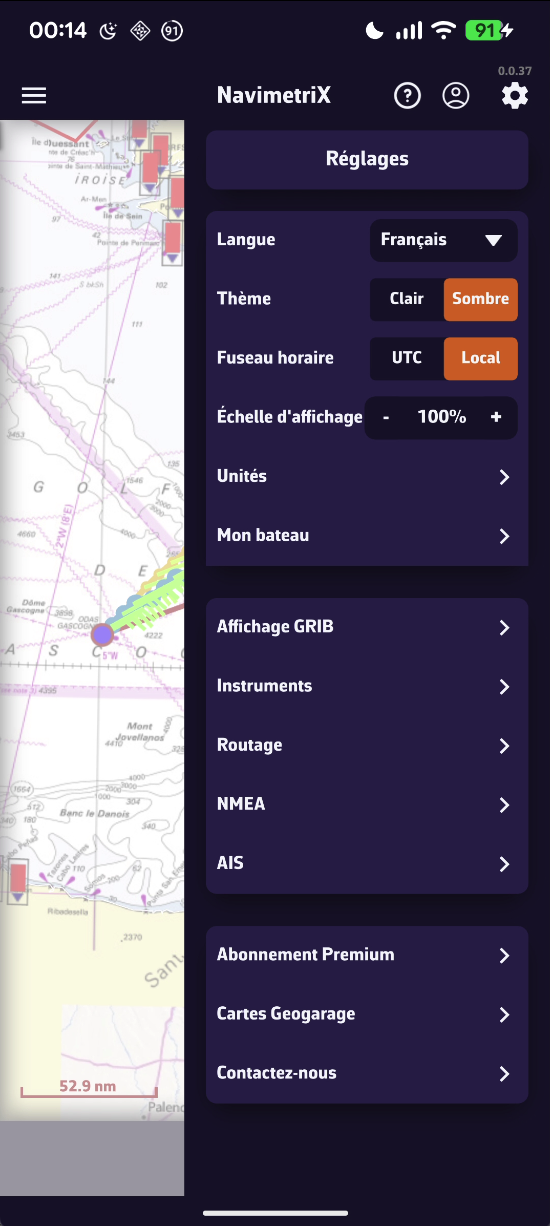
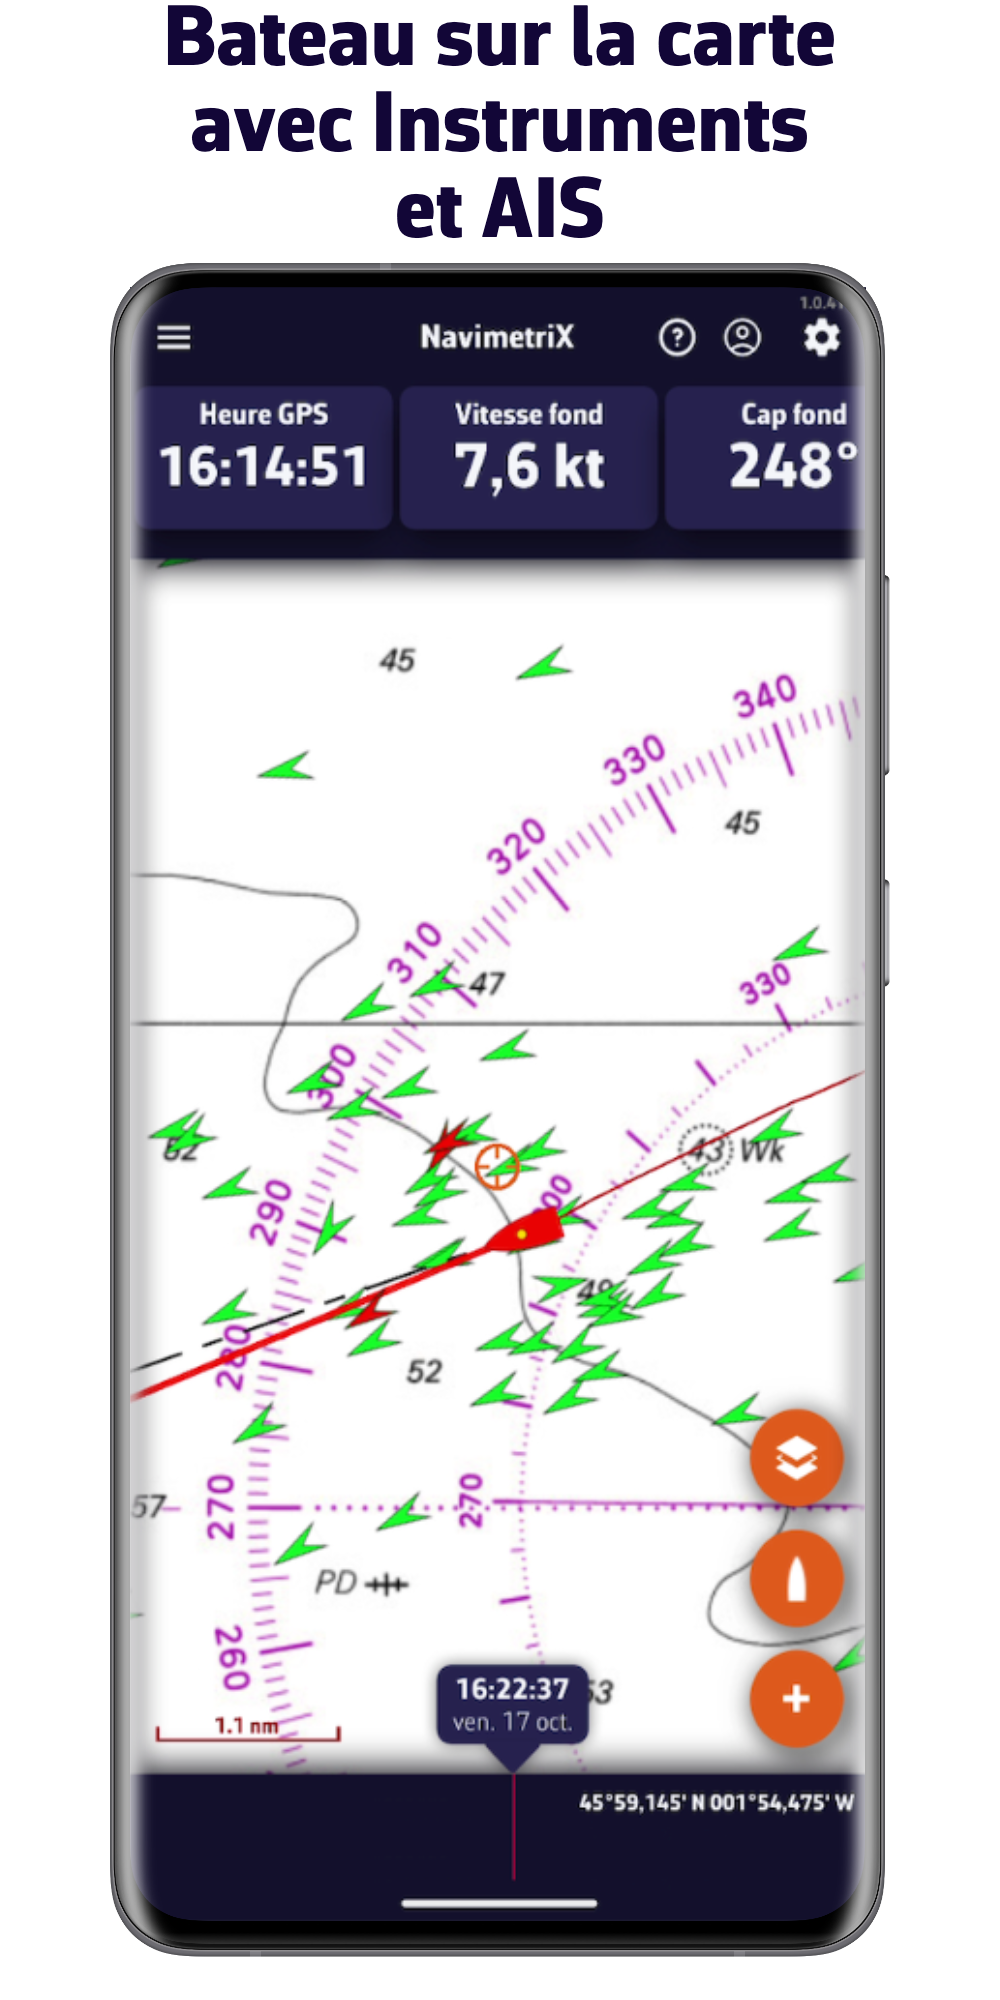
Grâce à son graphisme élaboré et à son interface utilisateur simple, NavimetriX permet de préparer sa navigation puis de la suivre de manière rapide et efficace.
Difficile de trouver plus complet pour les sources de météo, un module de routage à la pointe, des outils de navigation simples d'utilisation et hyper efficaces
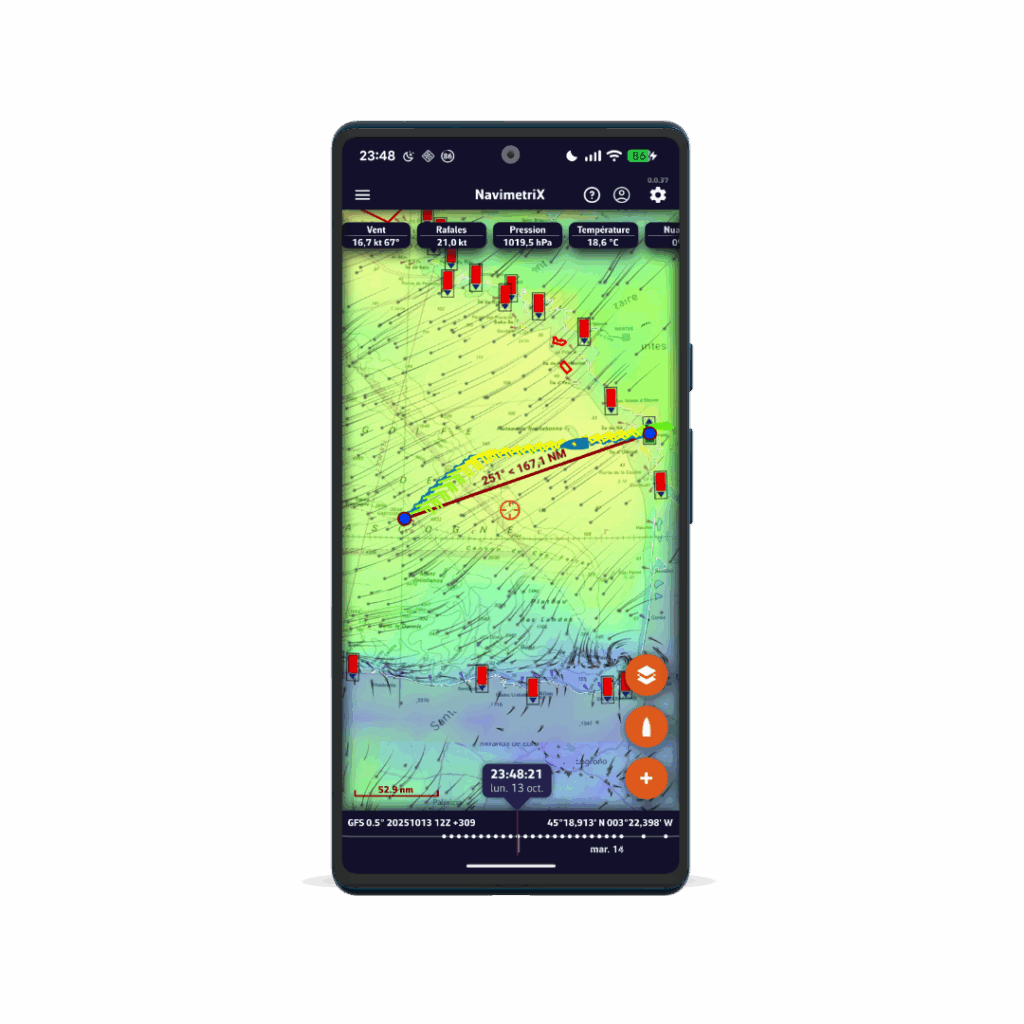
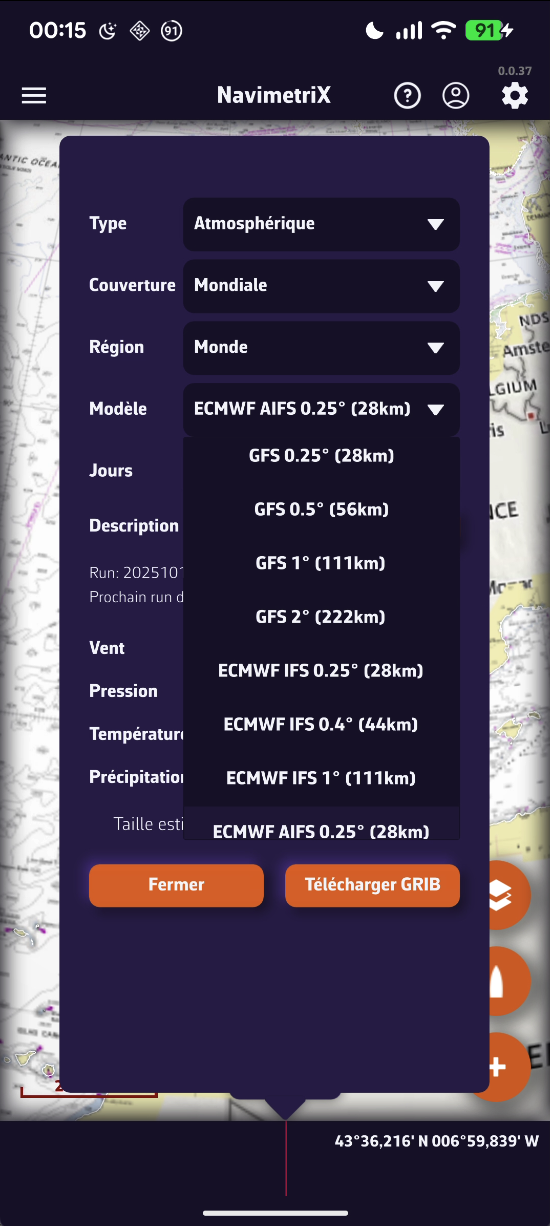
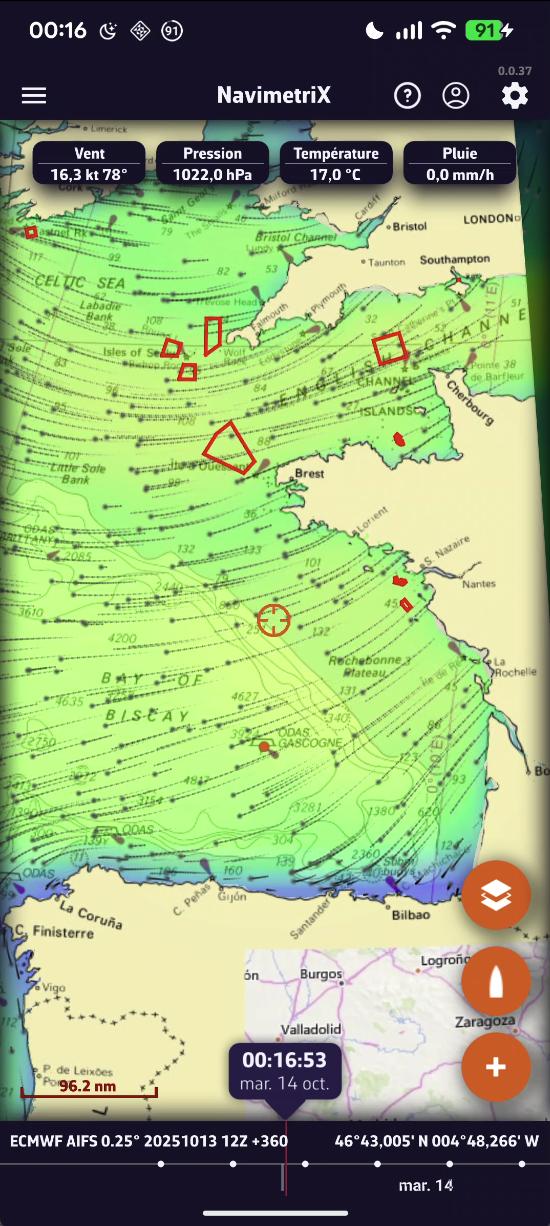
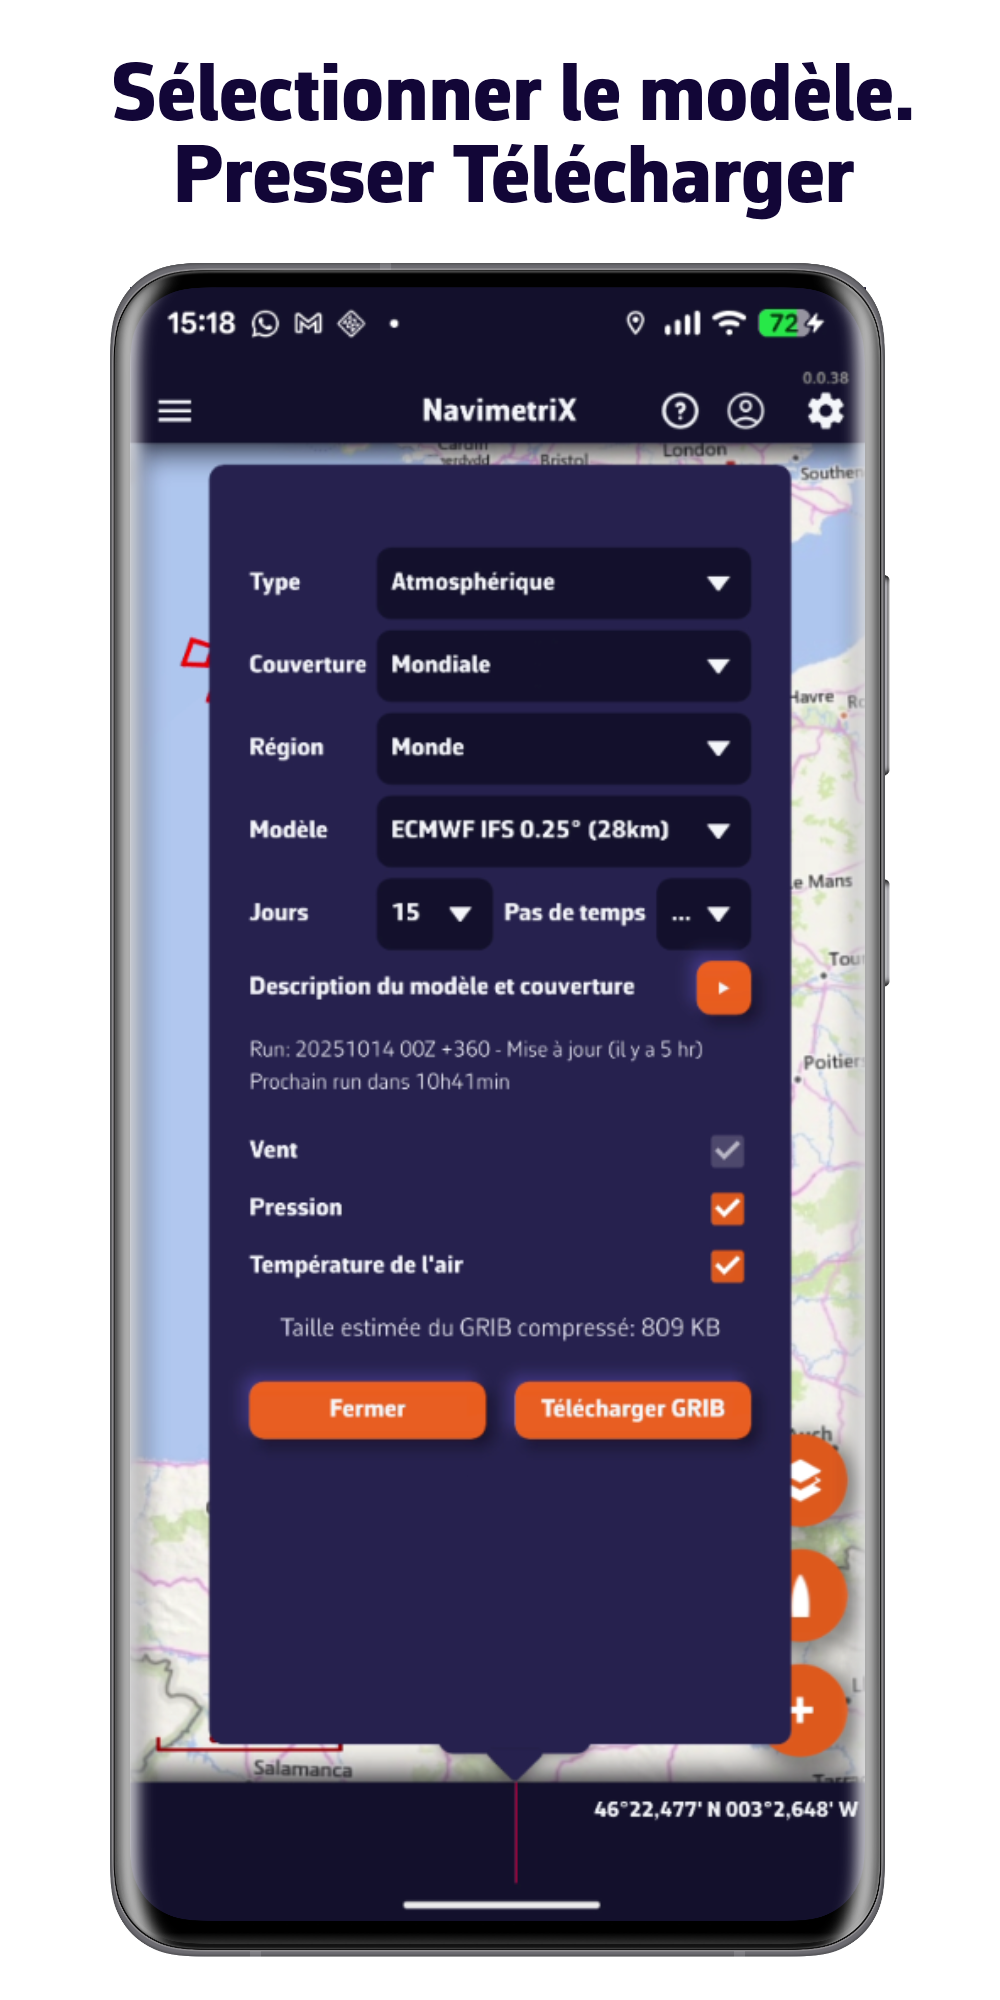
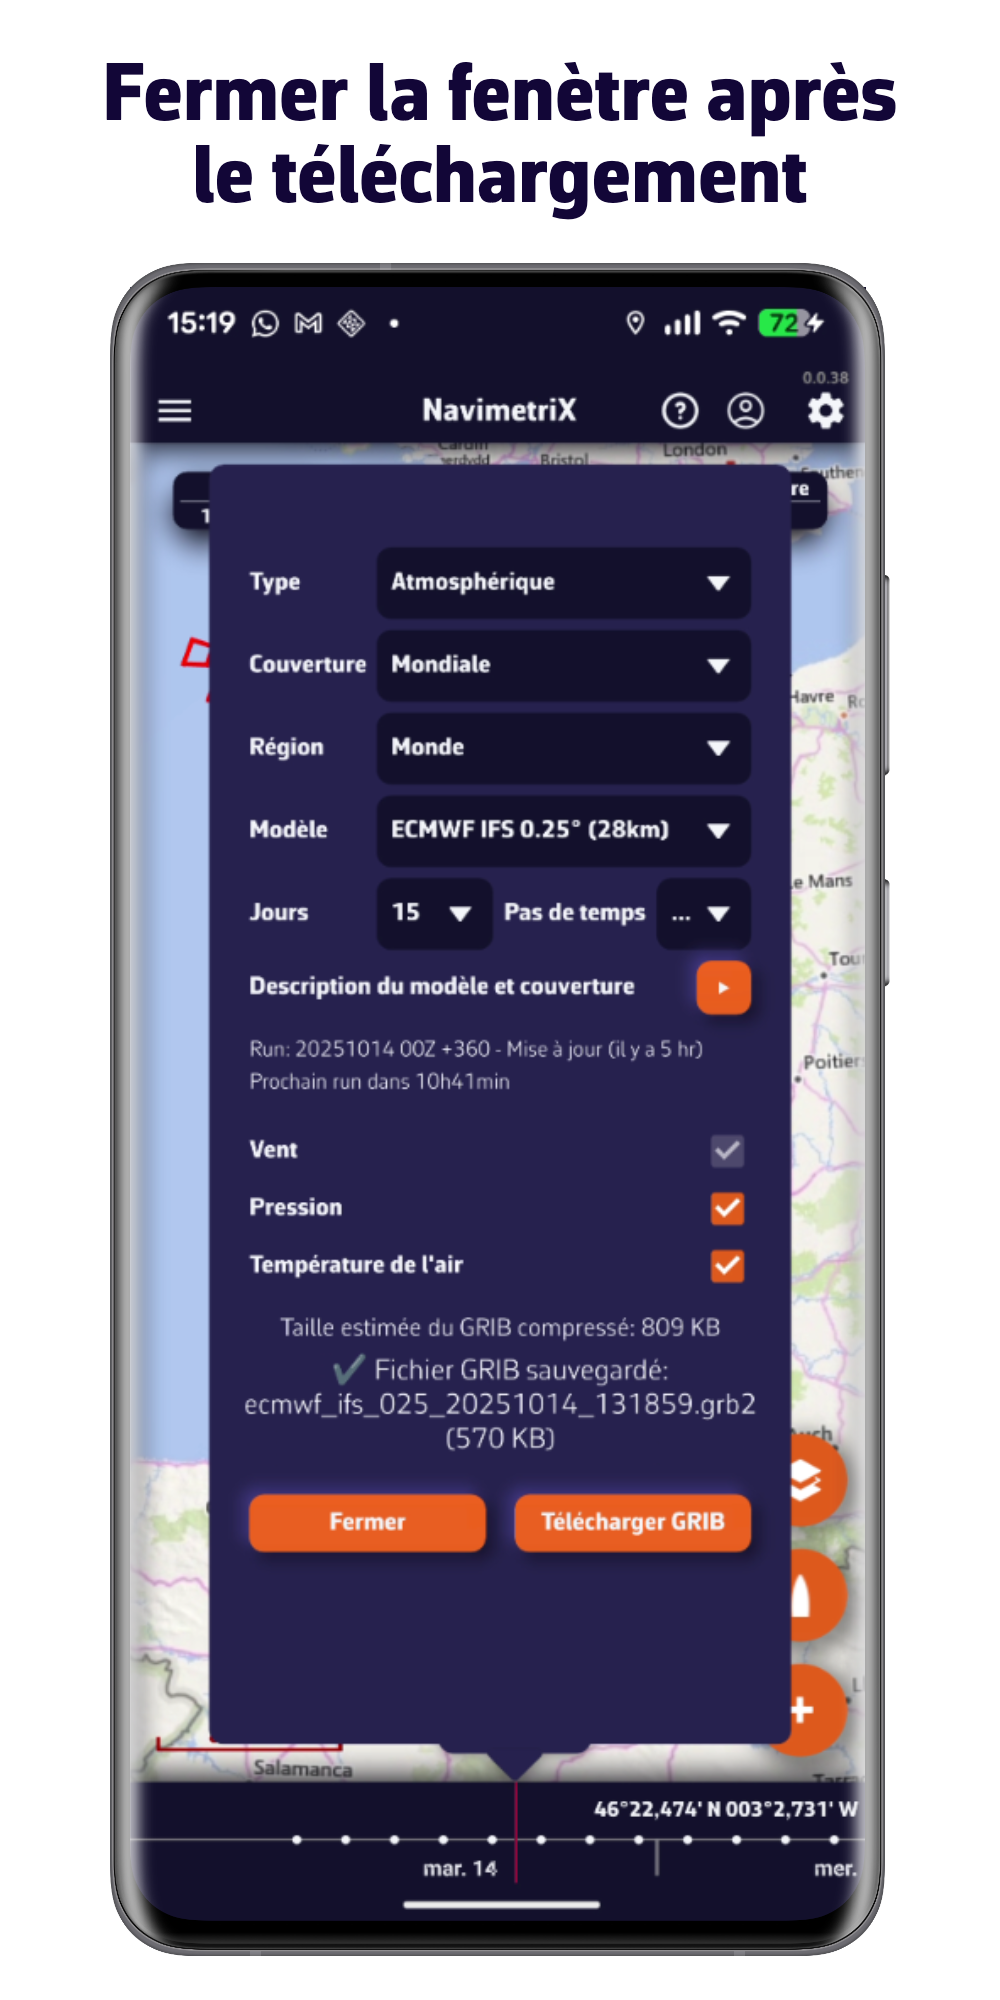
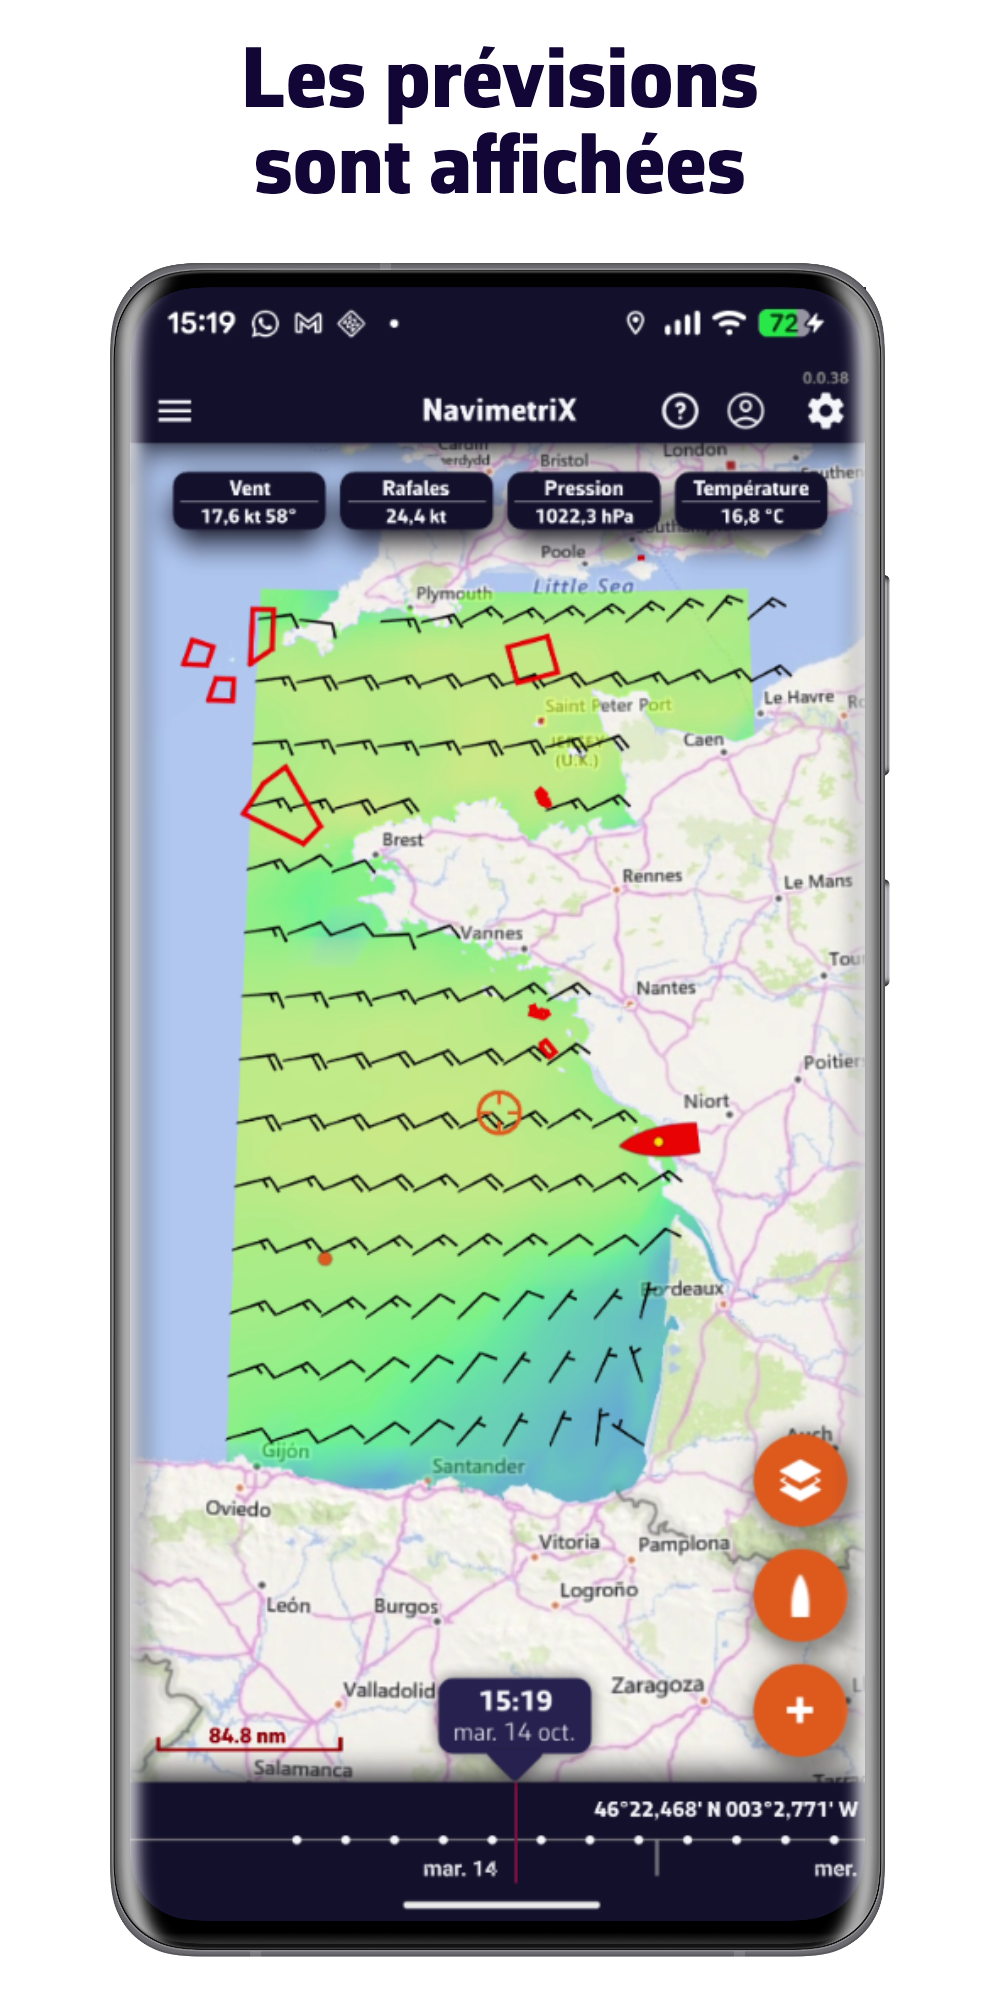
Des prévisions météo précises sur toutes les mers
Grace à sa bibliothèque de modèles hyper complète, vous aurez toujours accès aux meilleures prévisions, où que vous soyez.
- Modèles atmosphériques : vent, rafales, pression, ...
- Etat de la mer : hauteur, direction, période des vagues
- Courants : océaniques et de marée
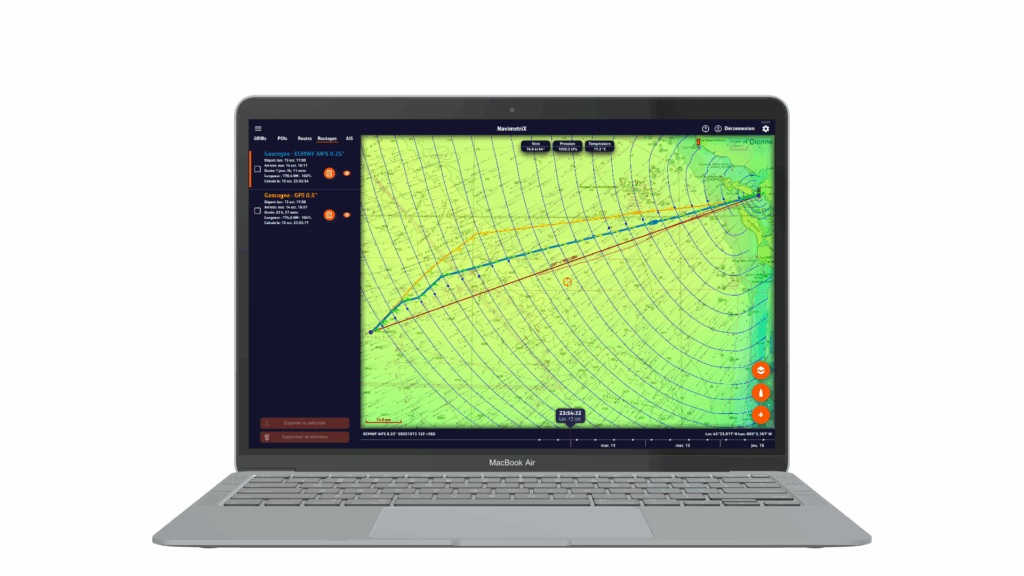
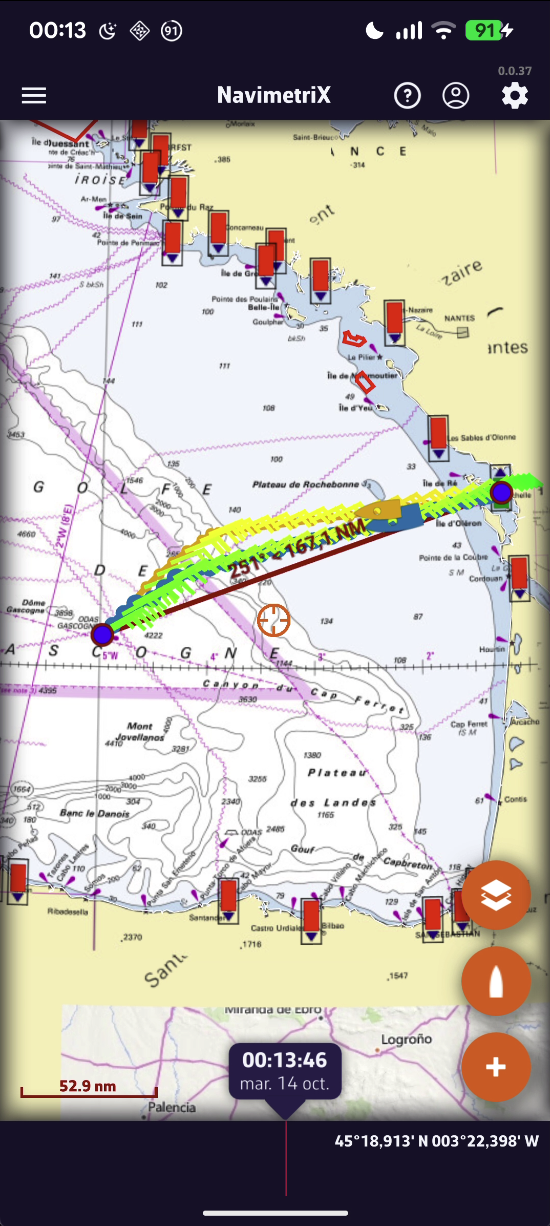
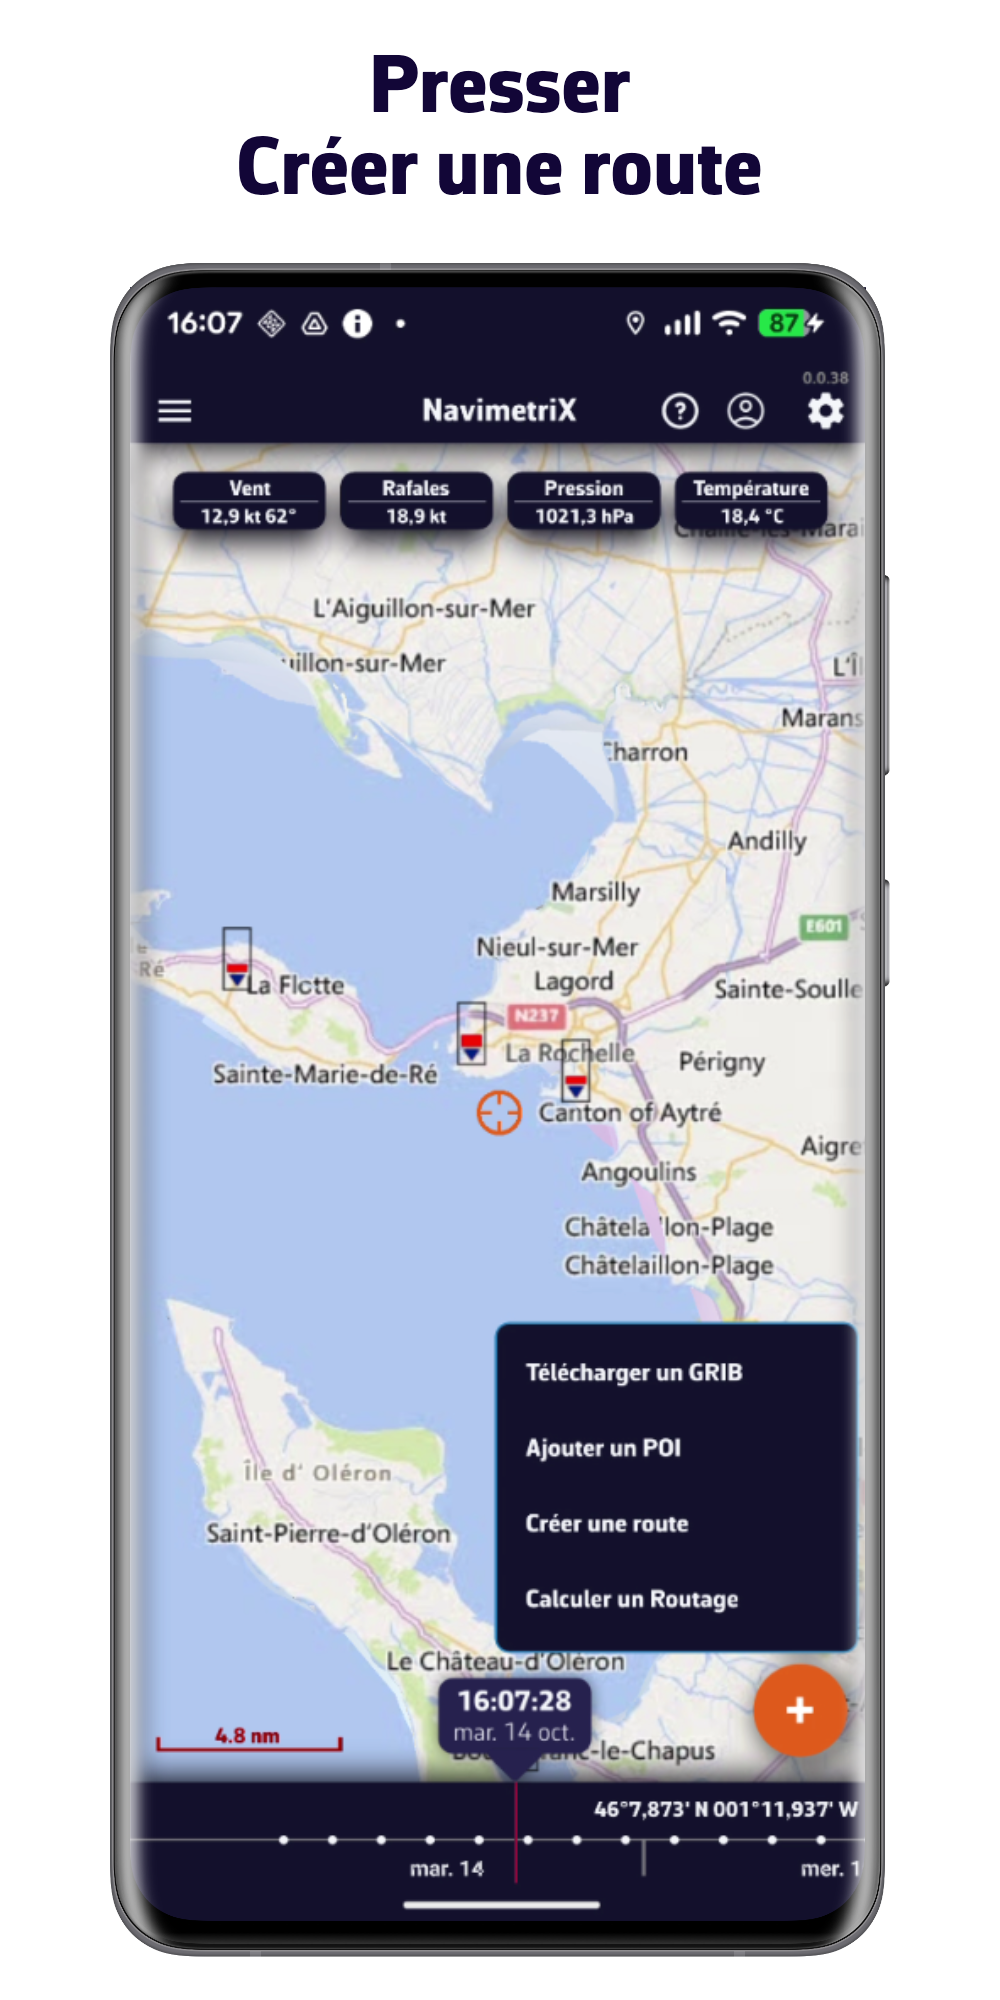
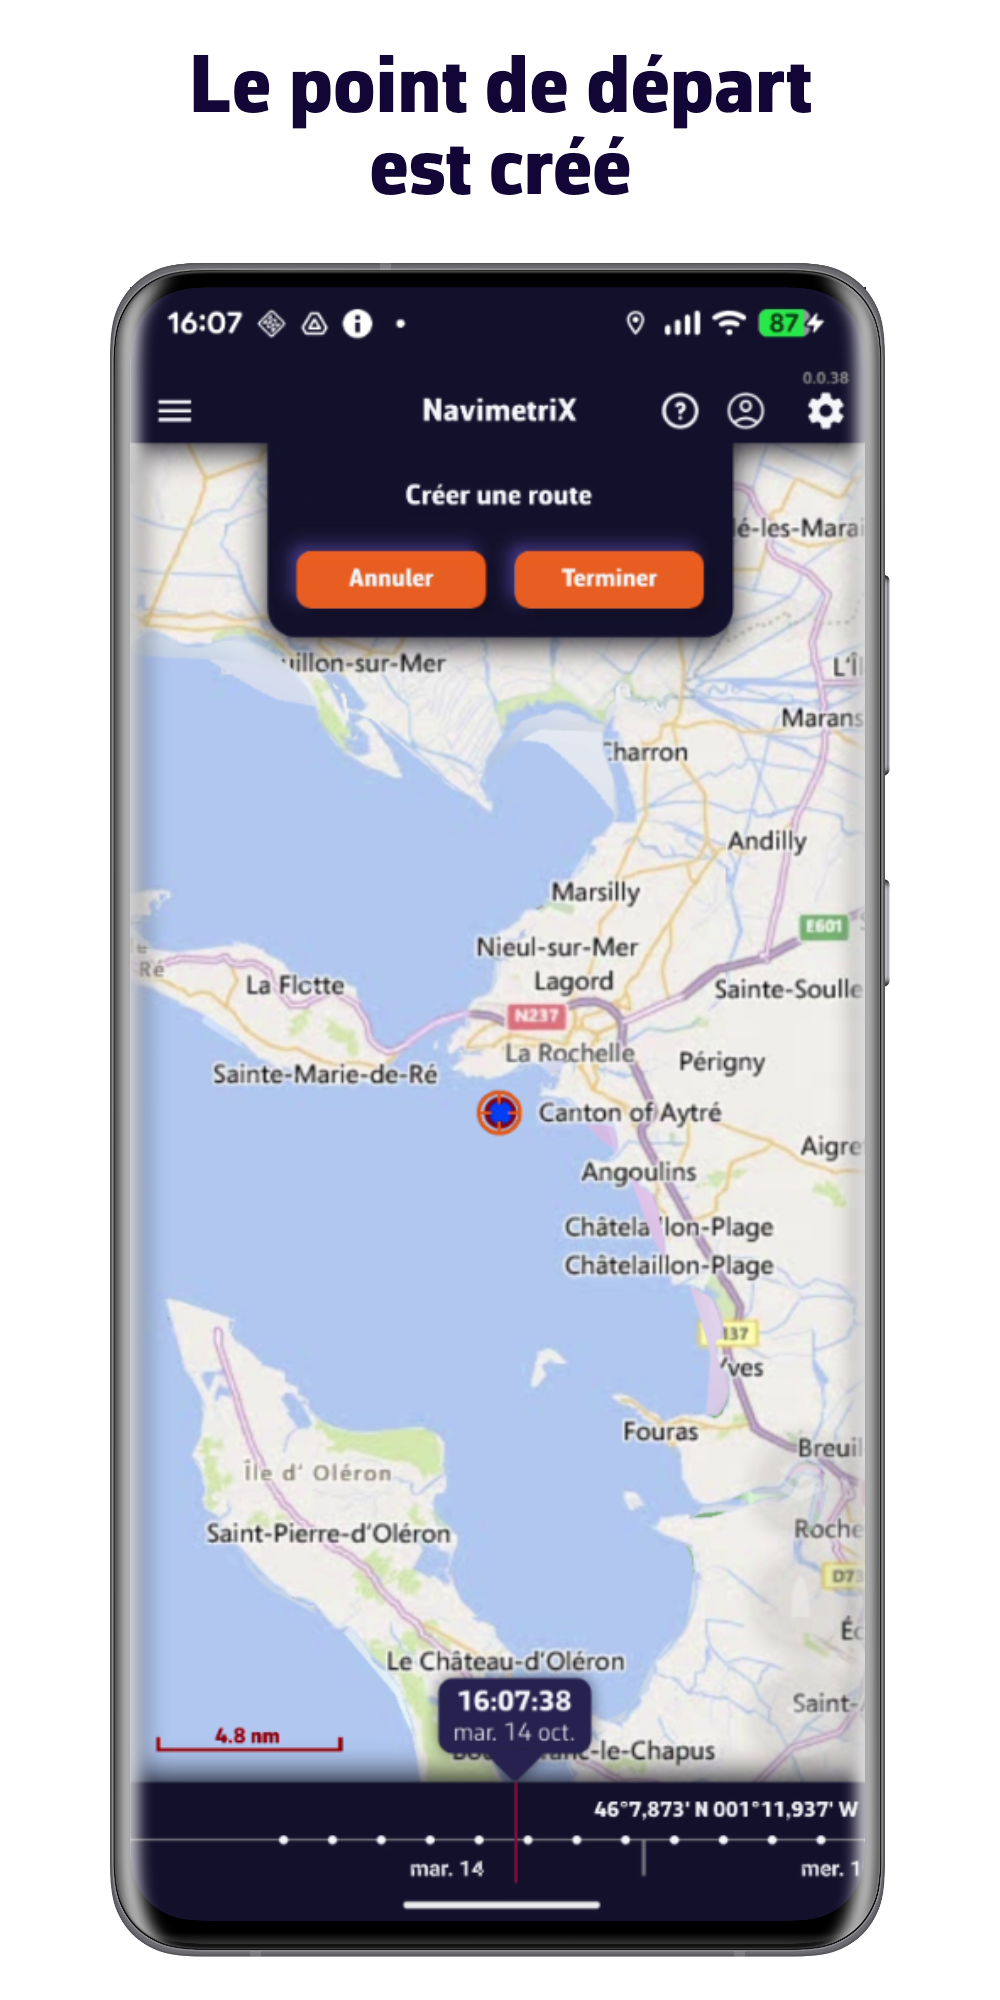
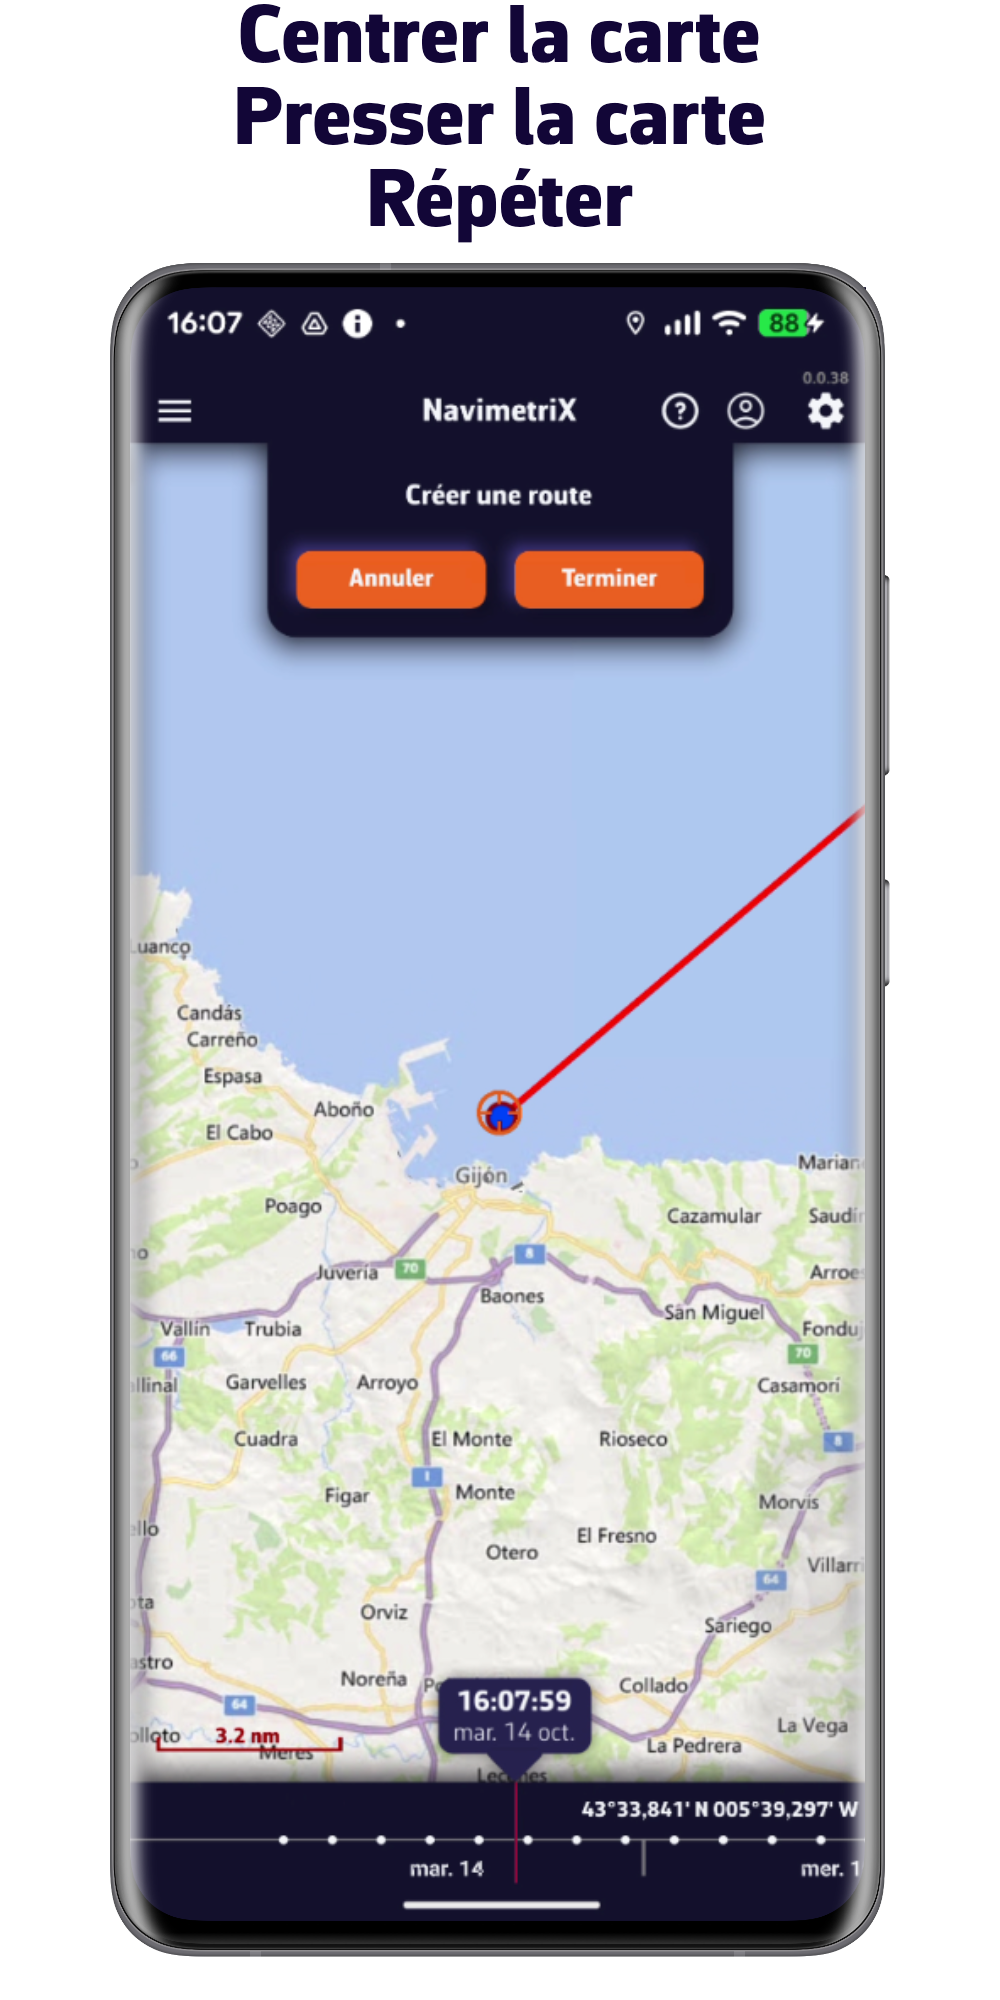
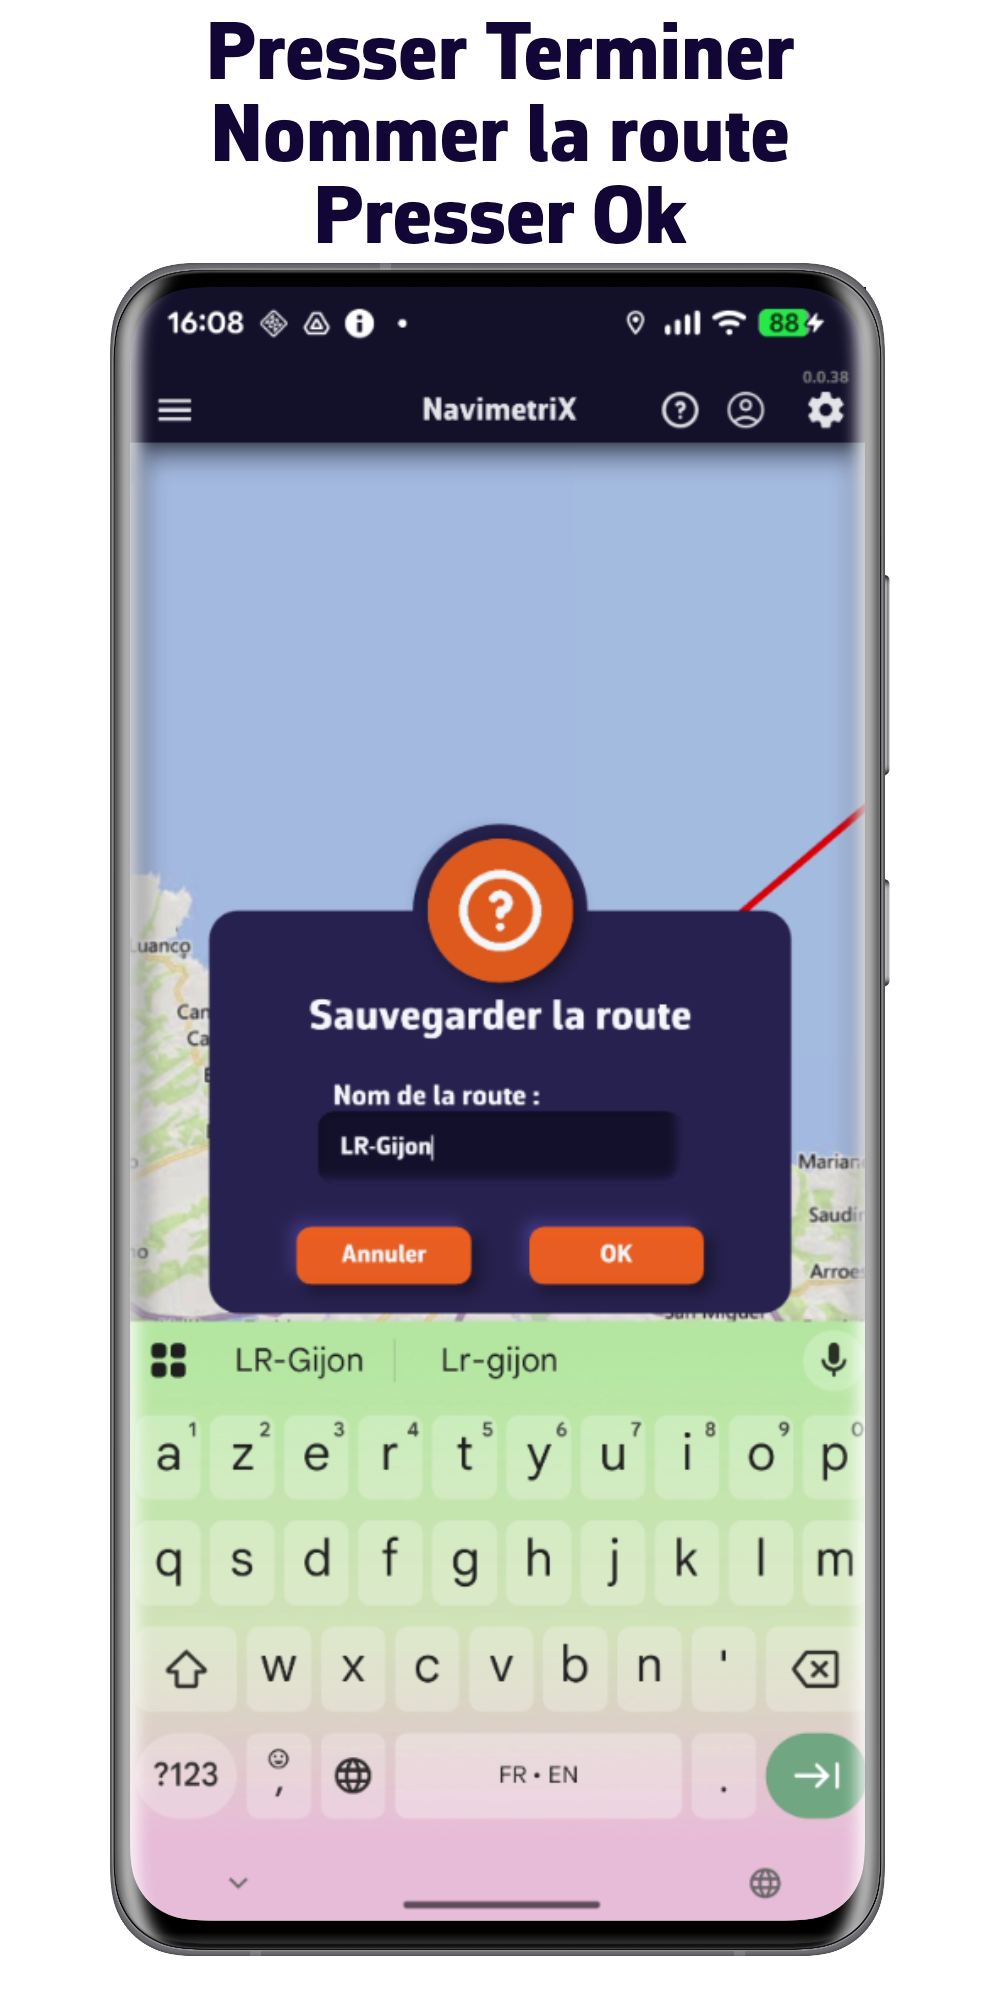
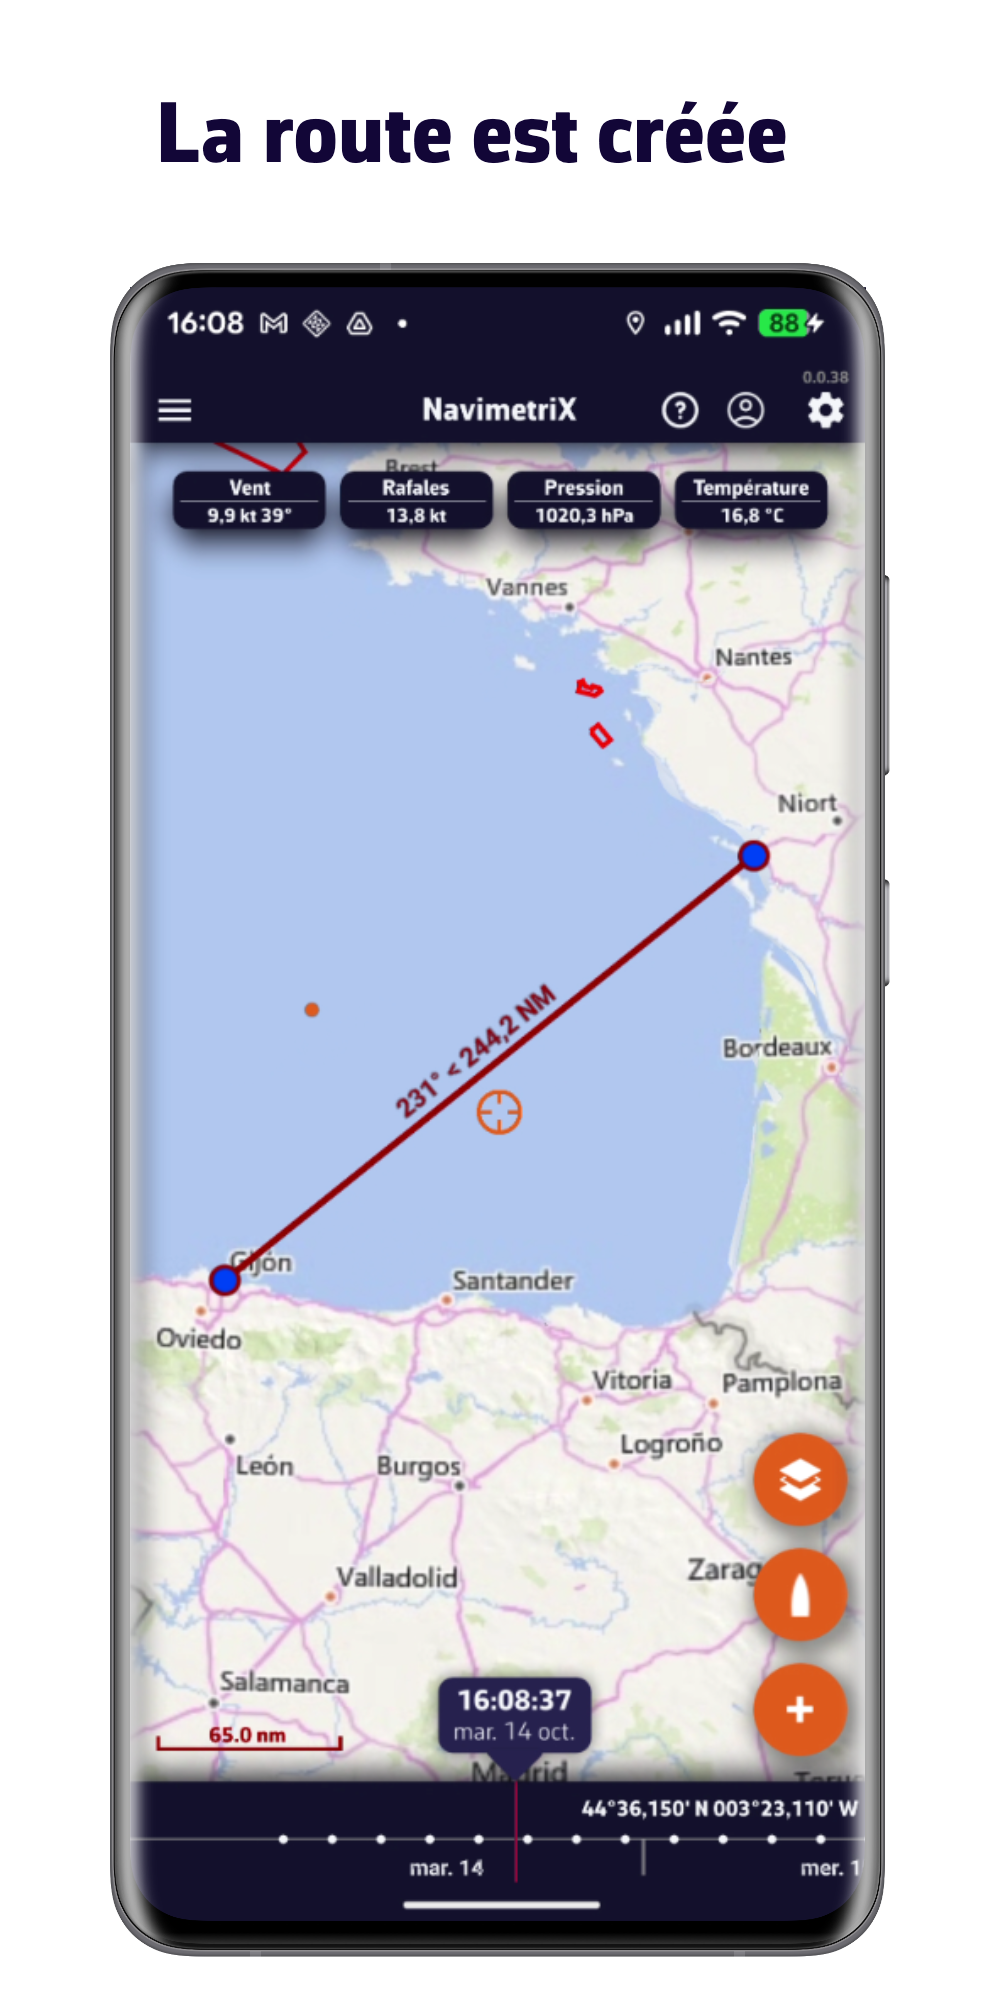
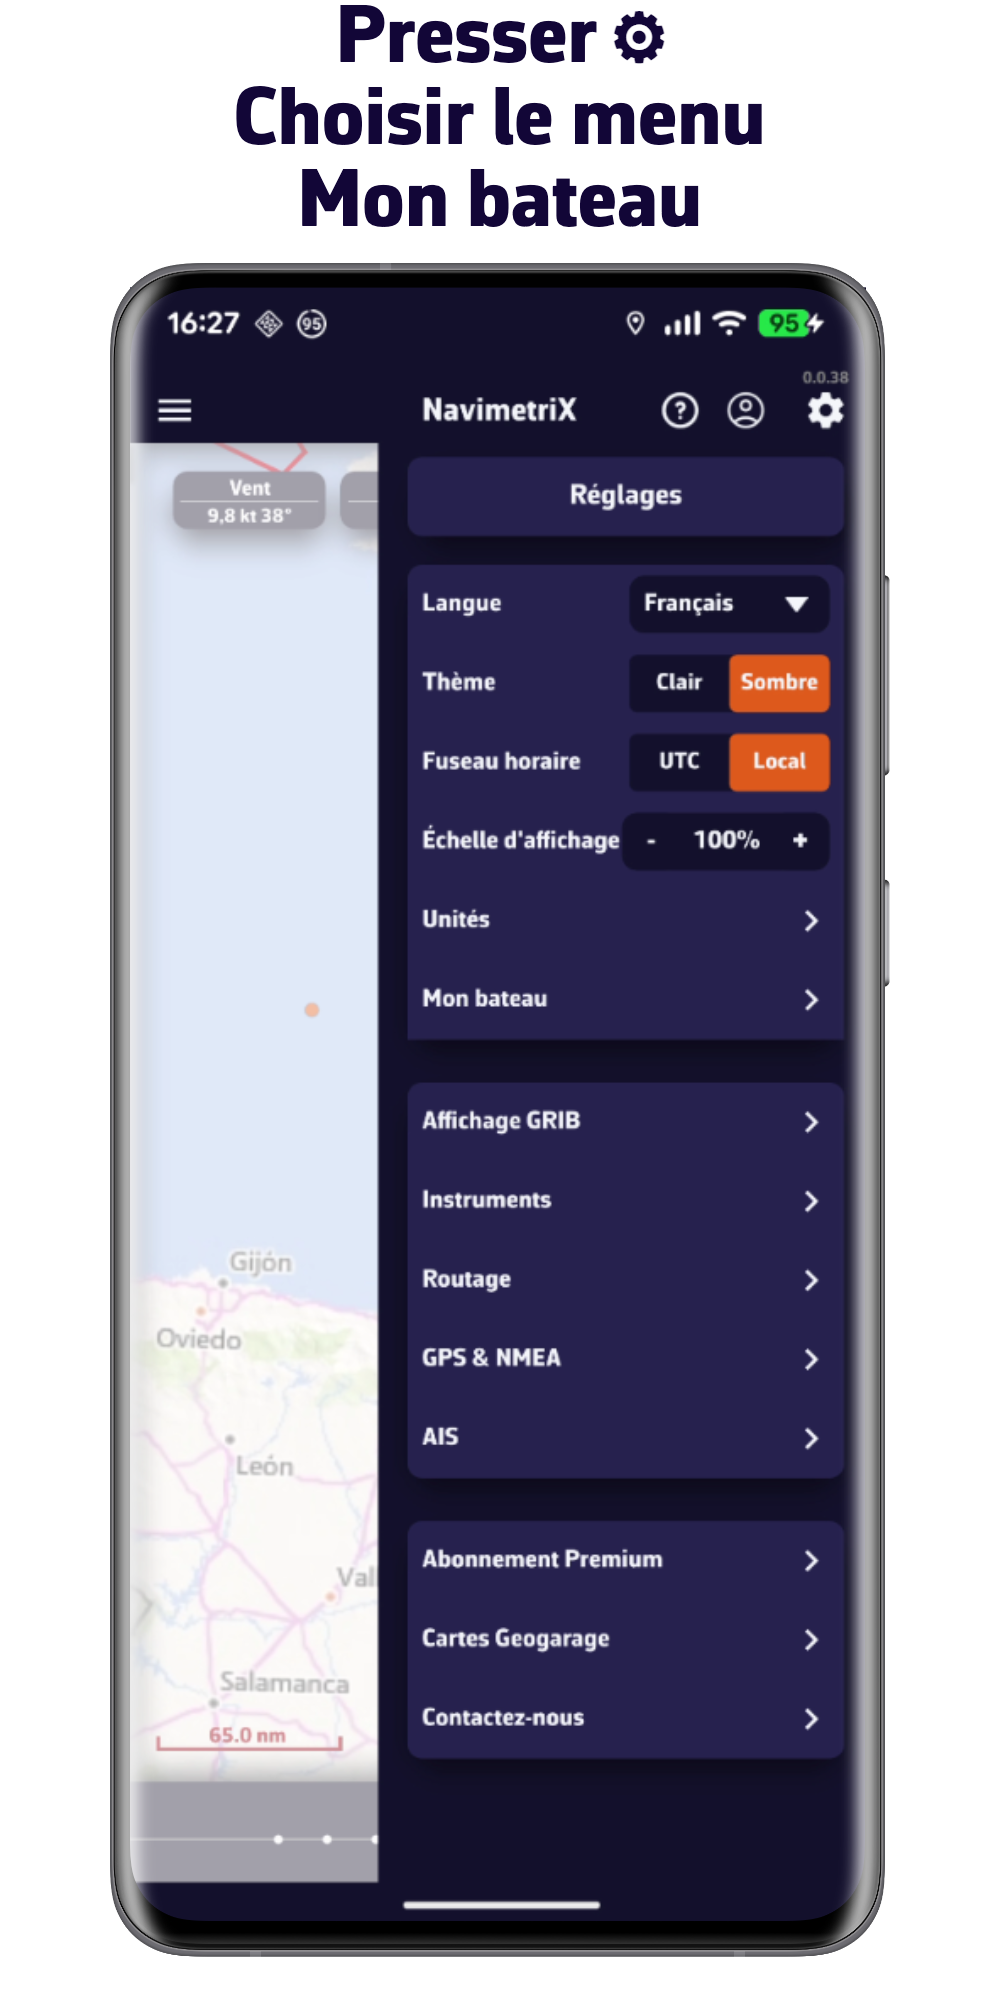
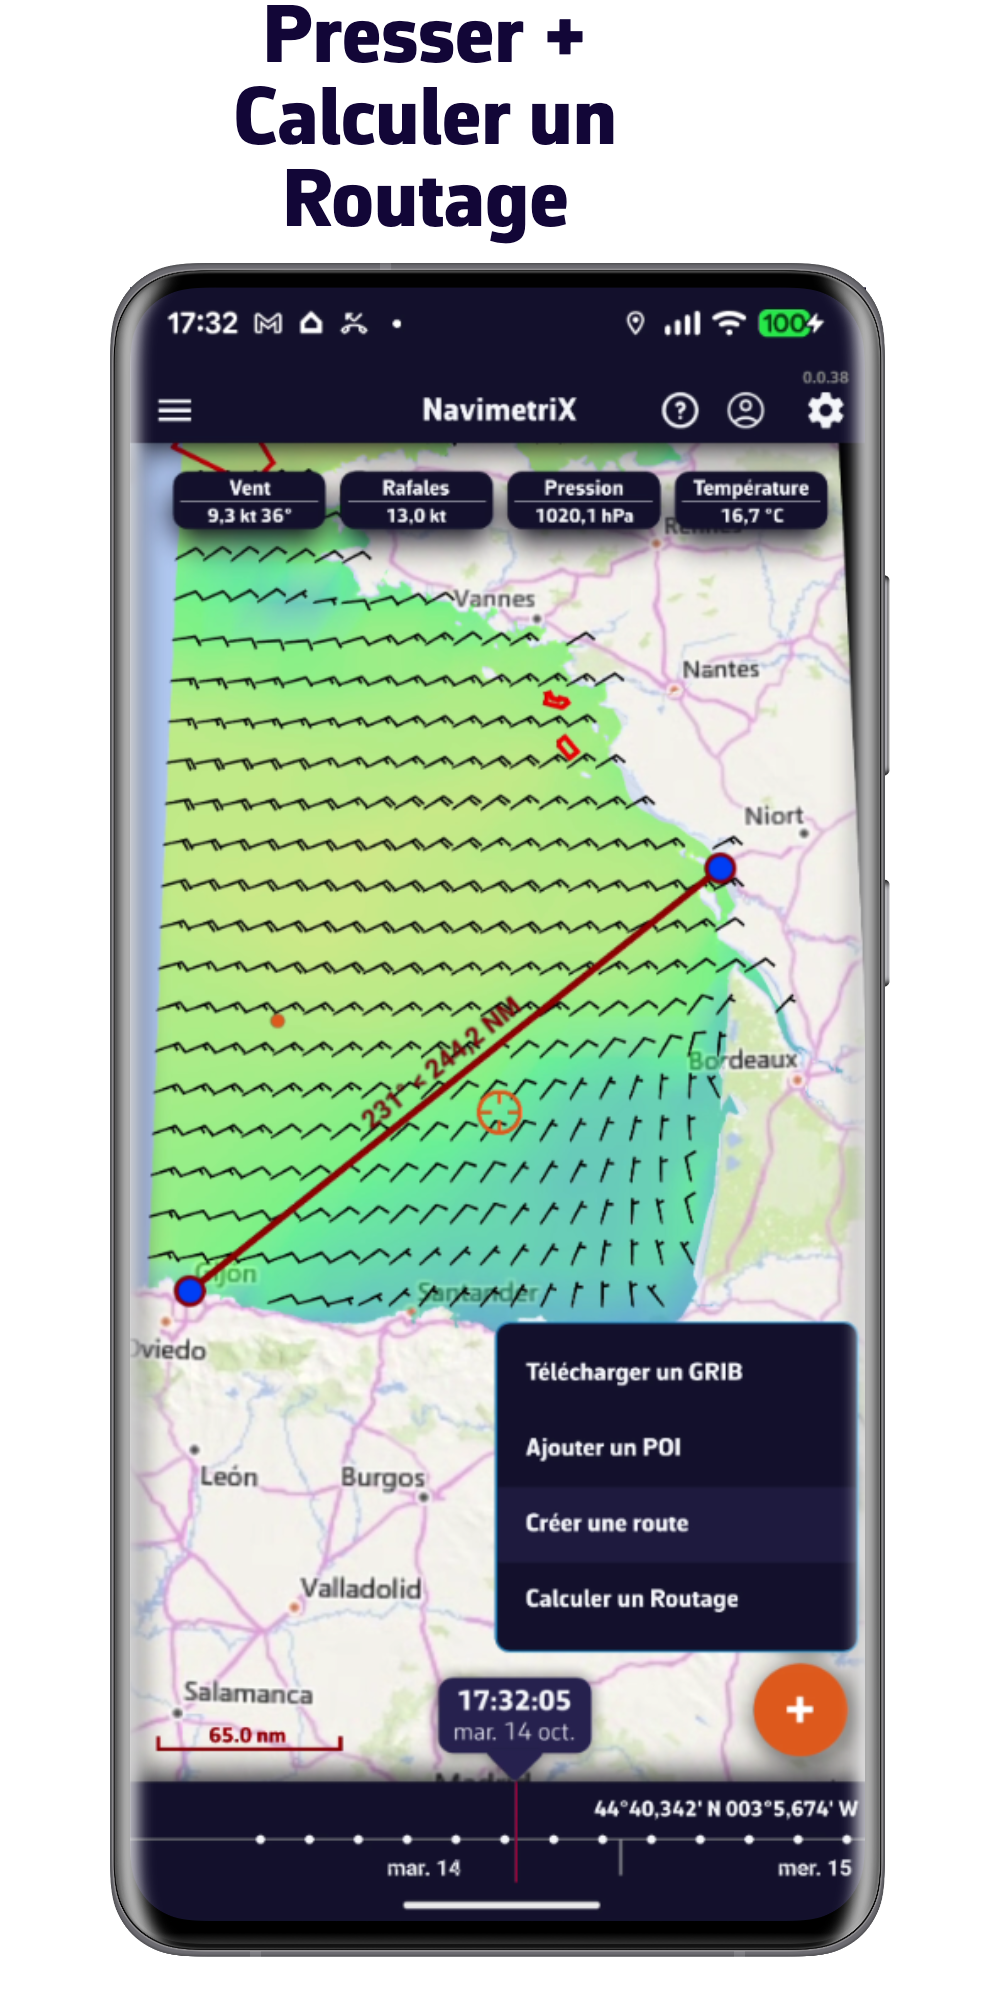
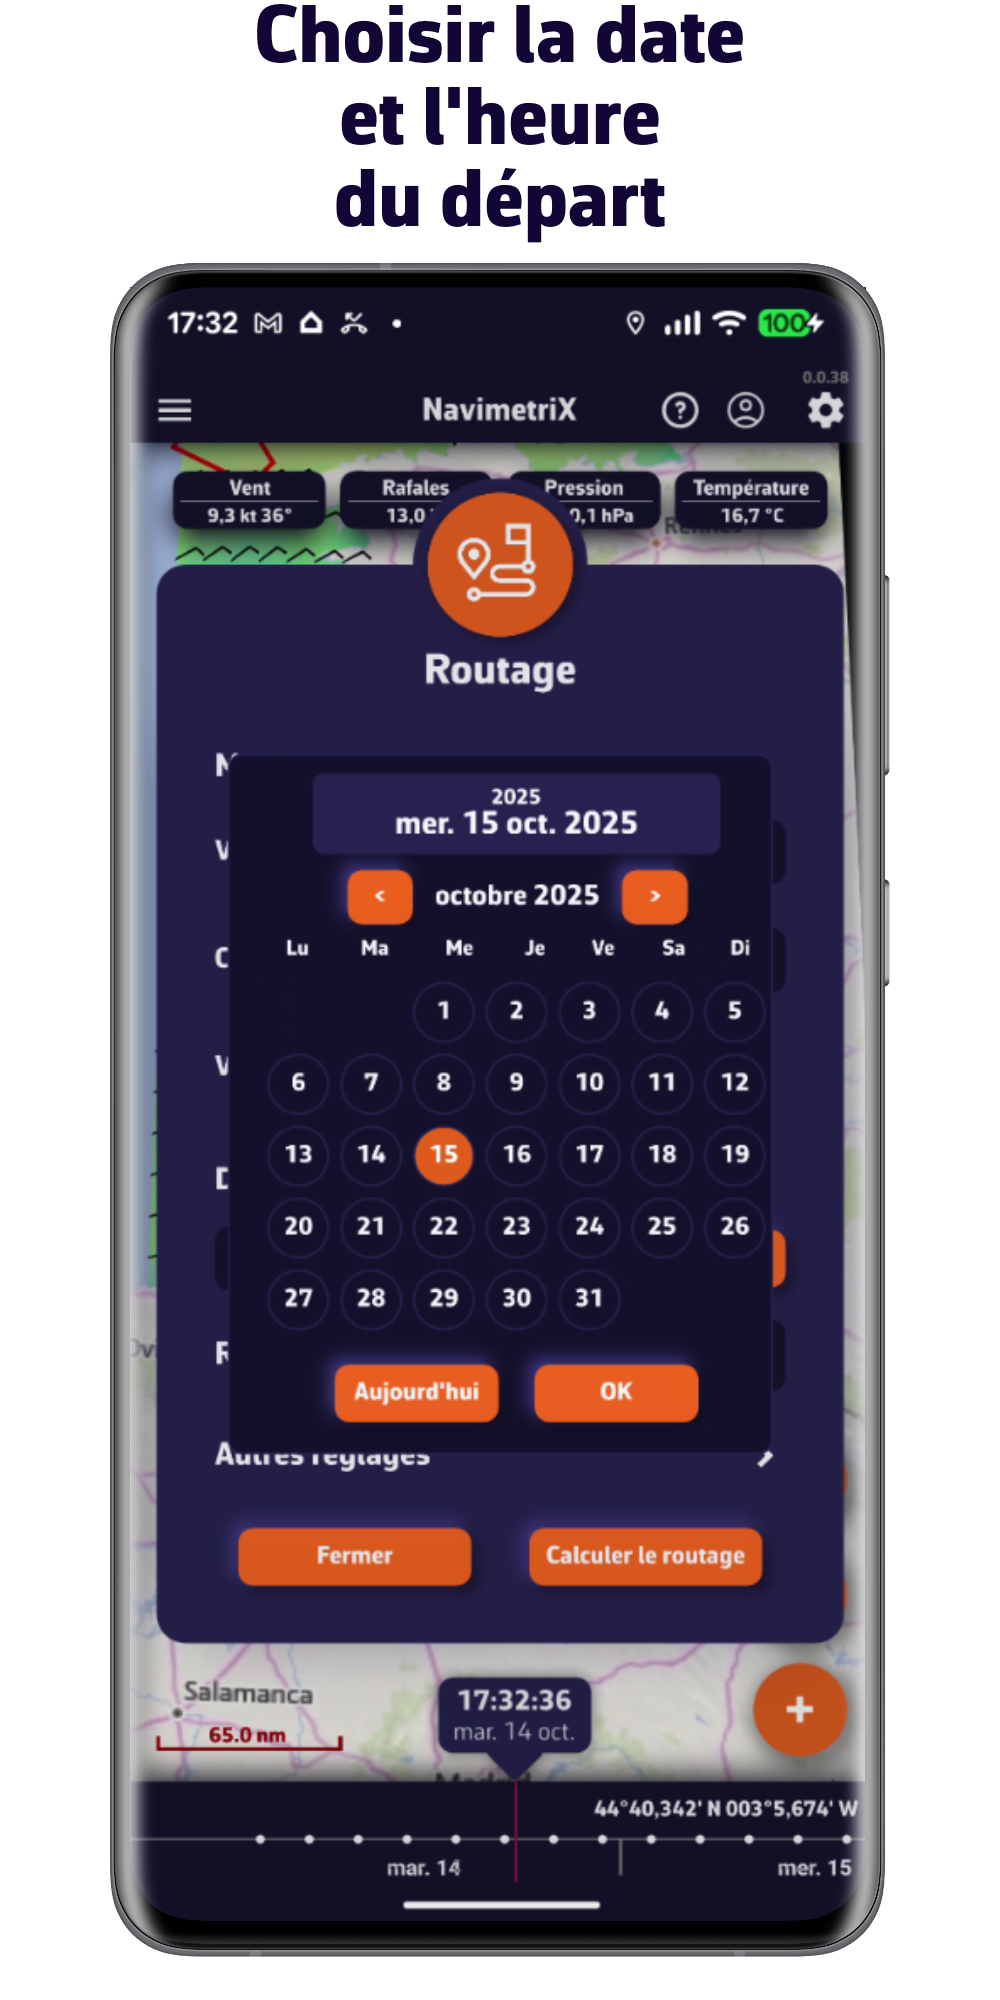
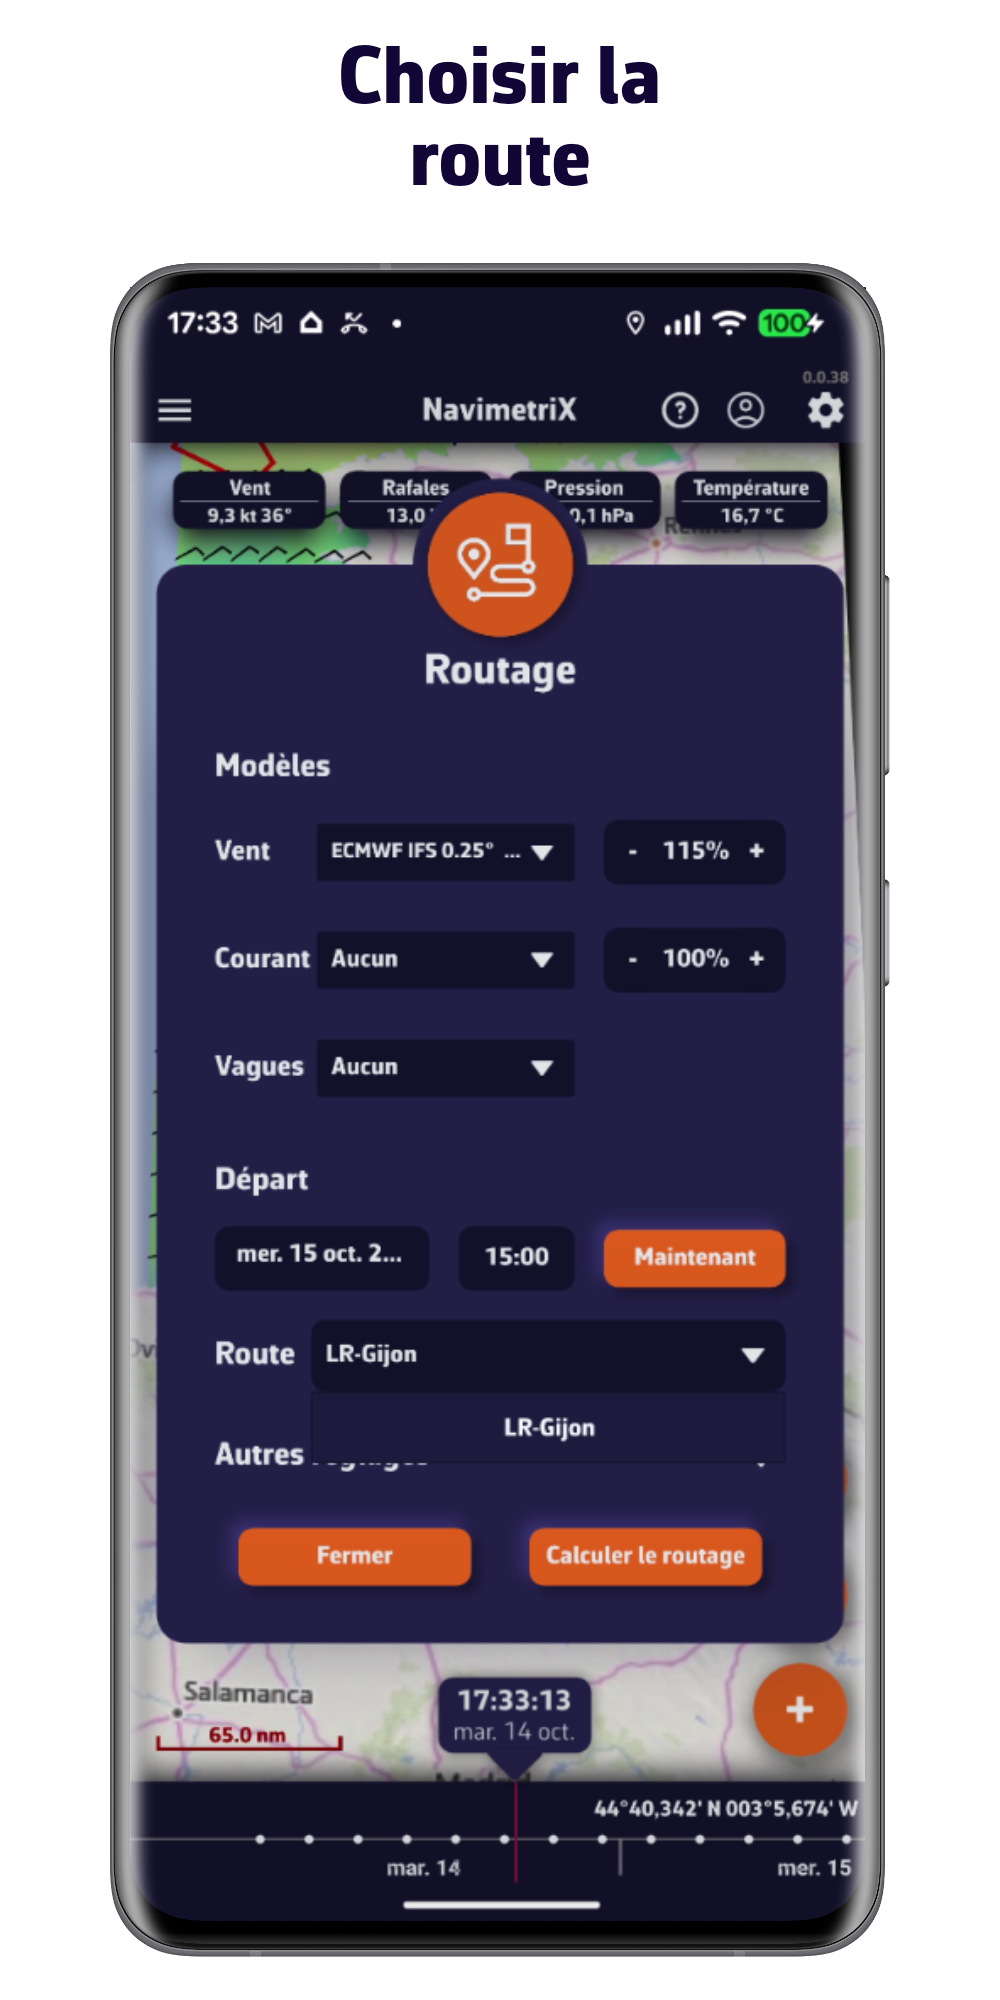
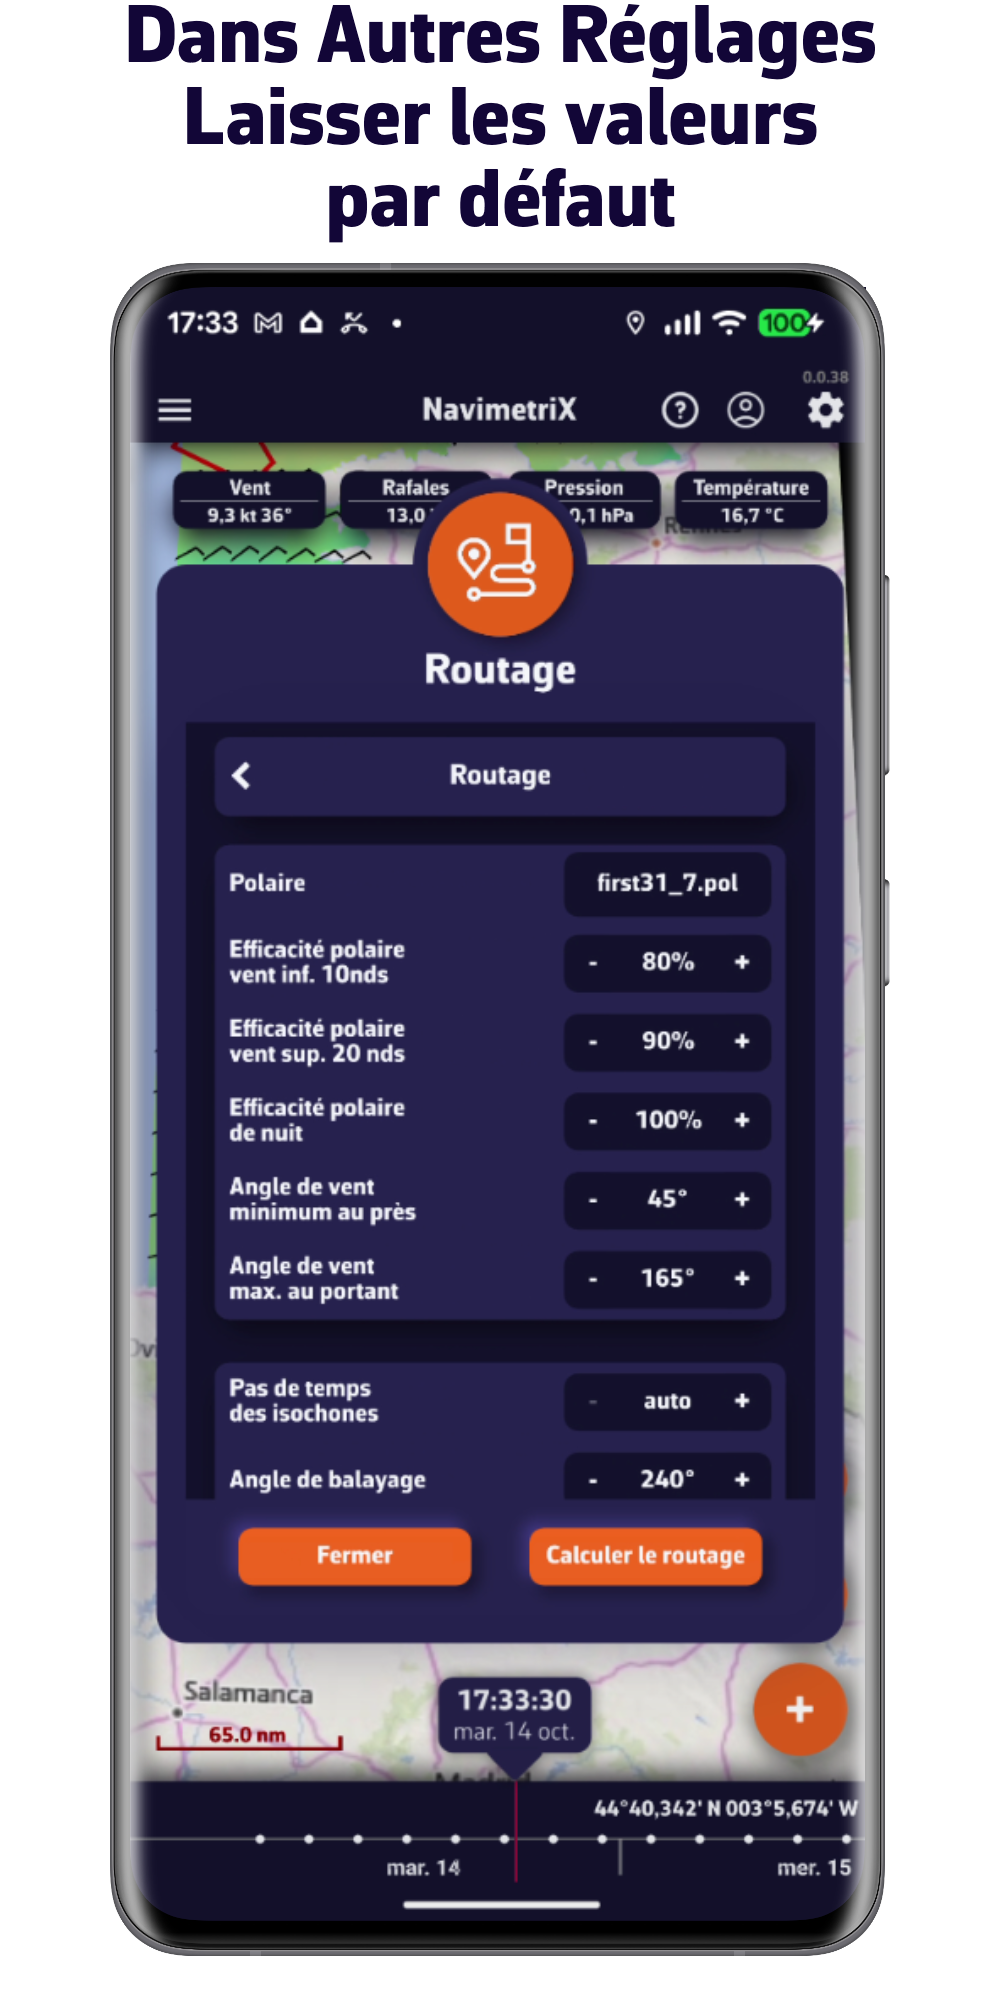
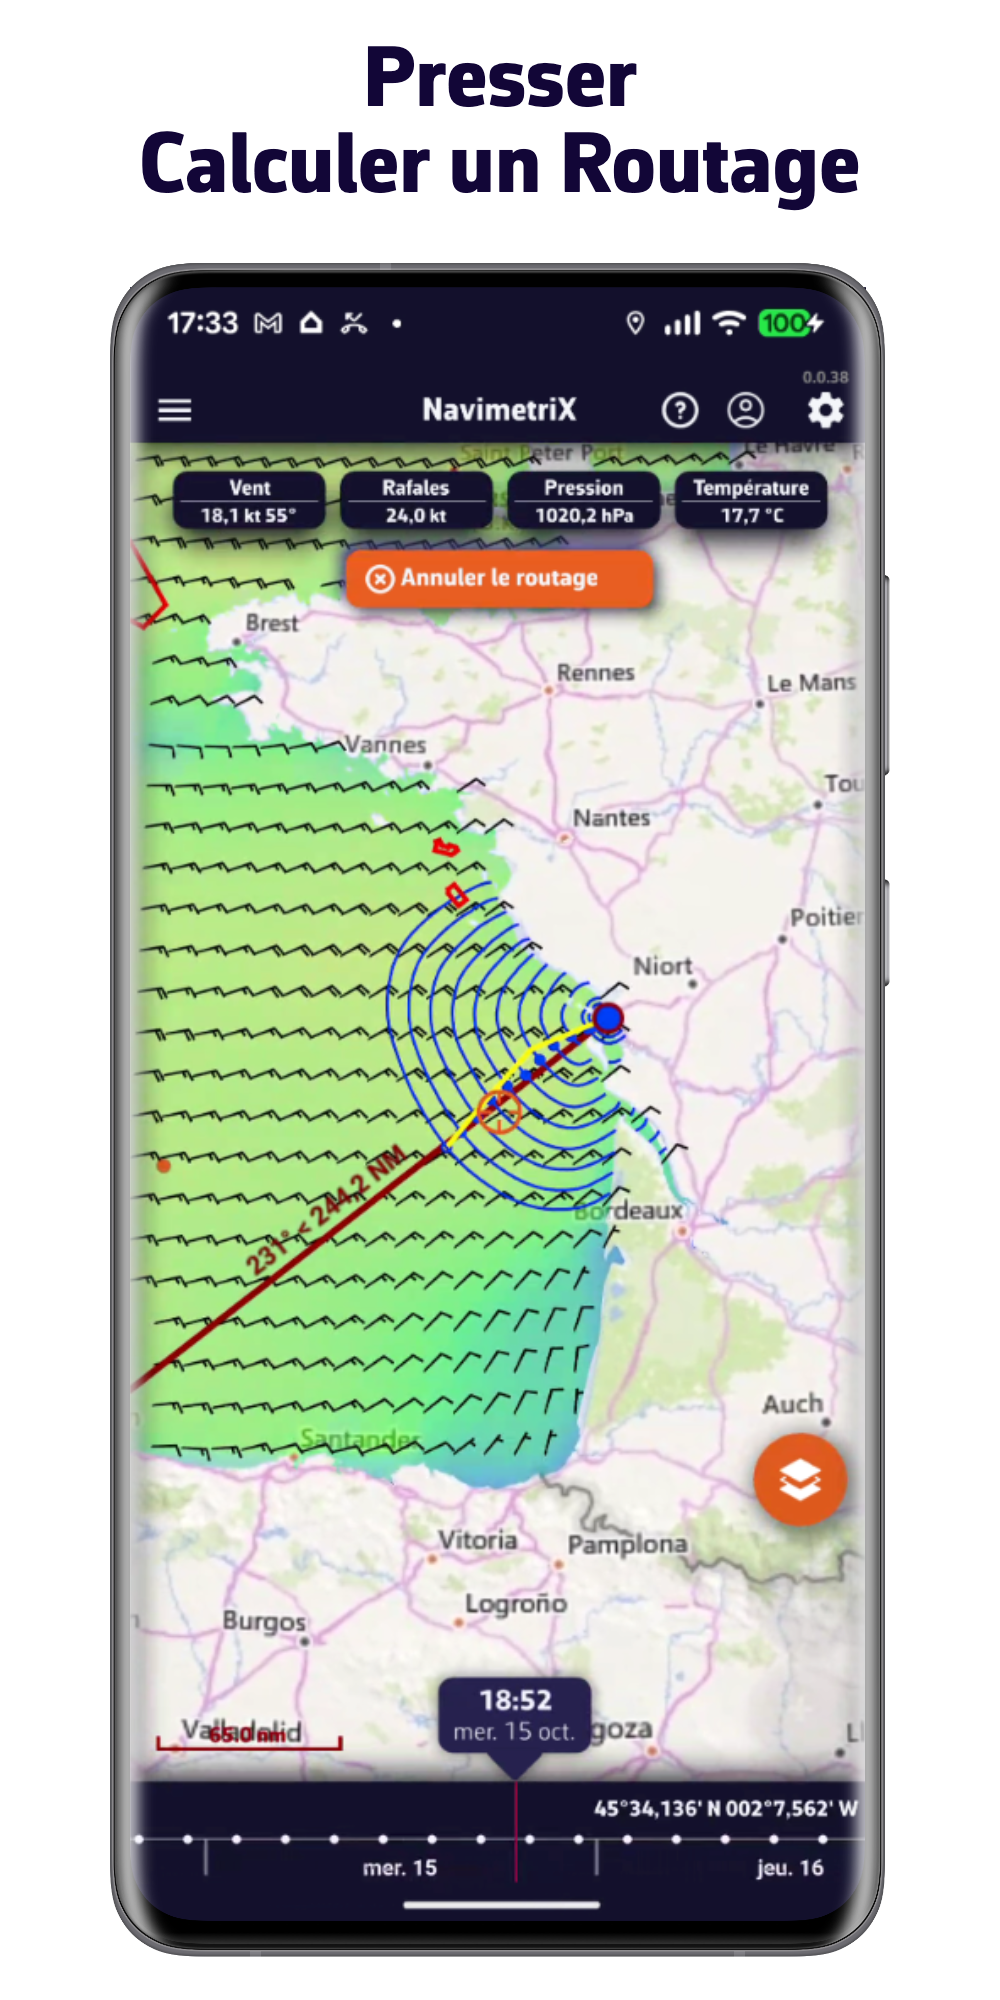
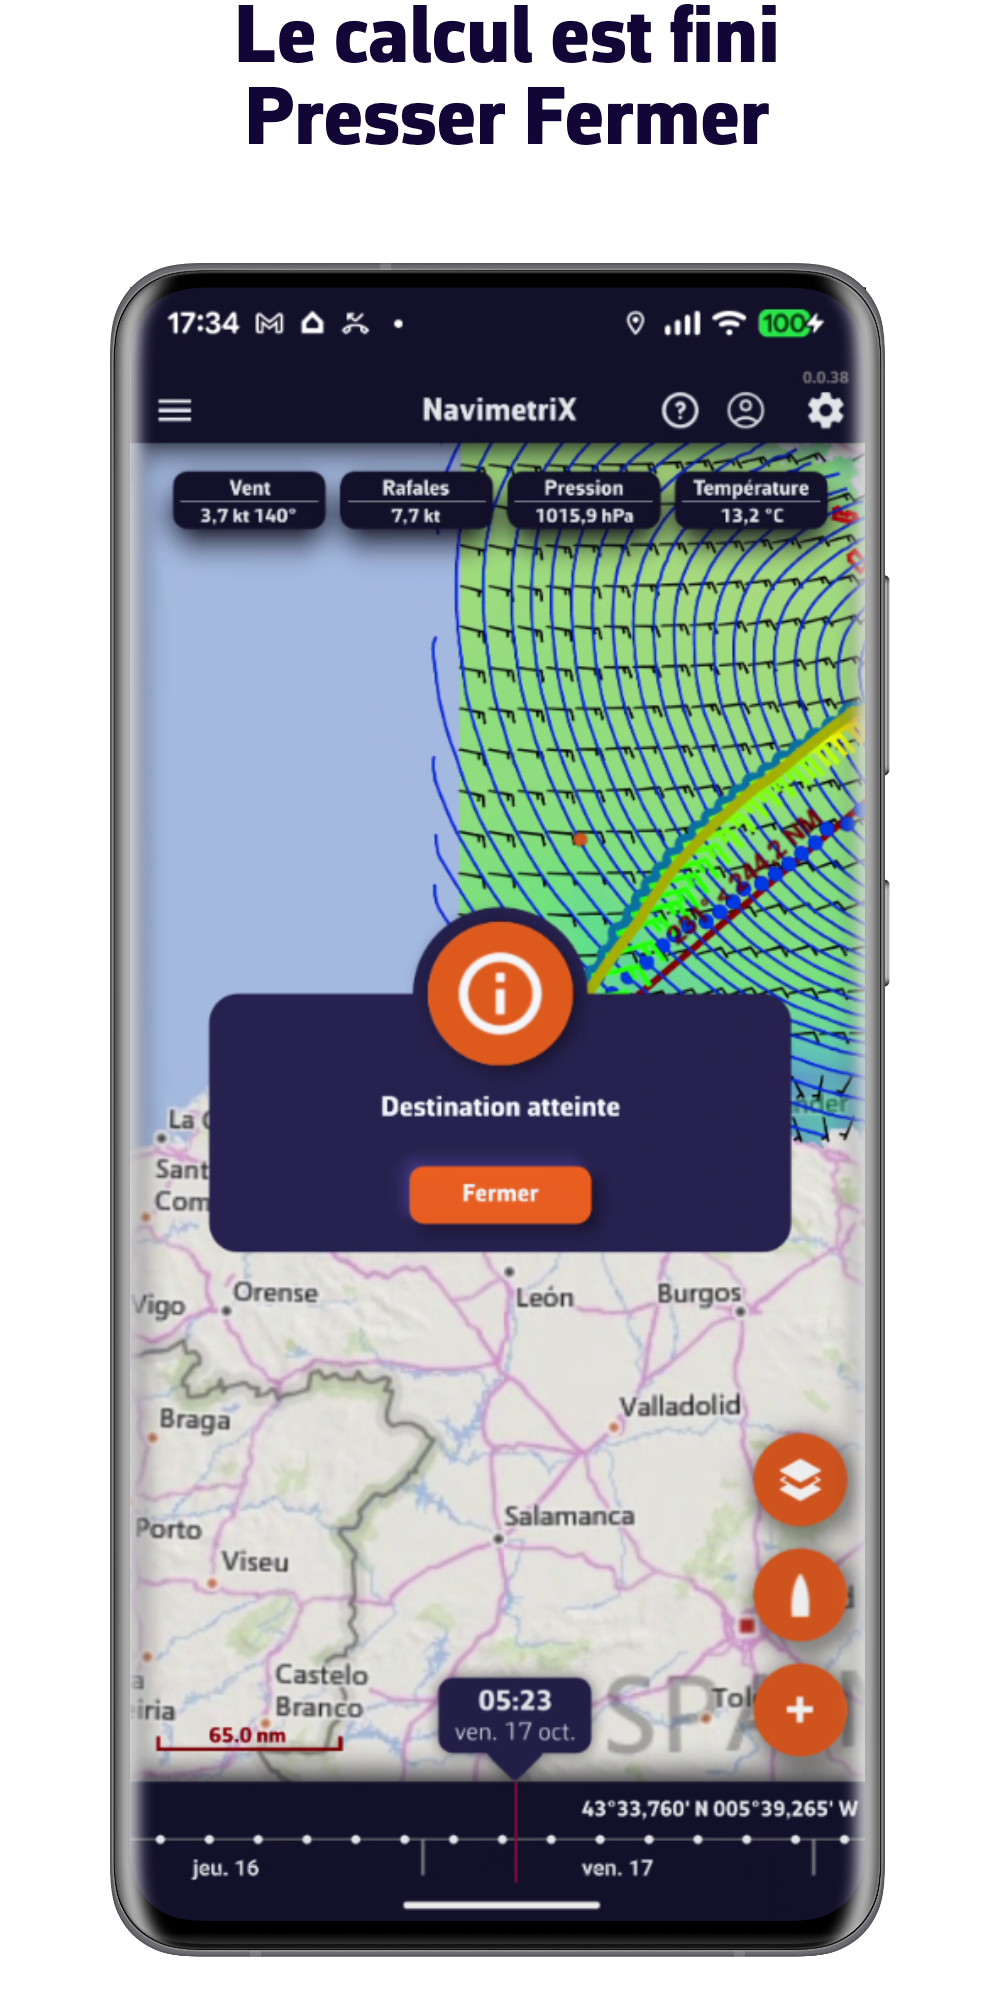
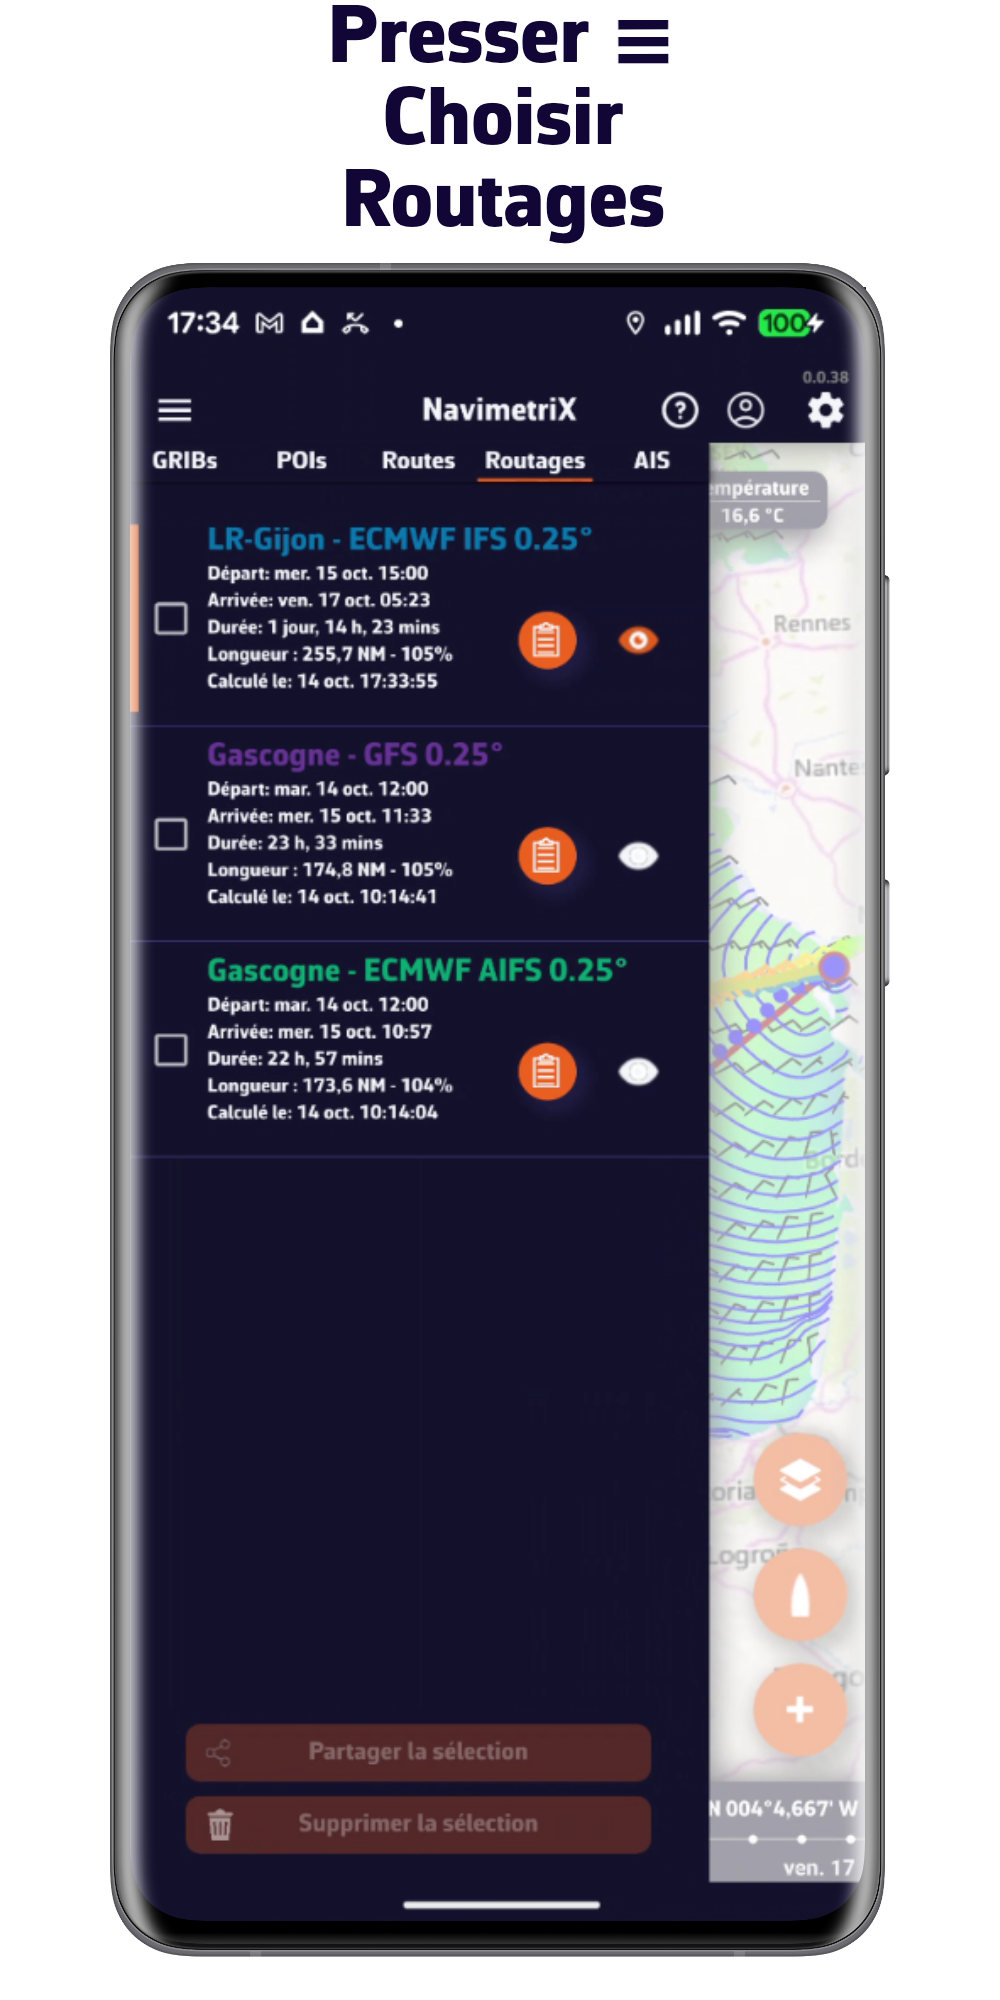
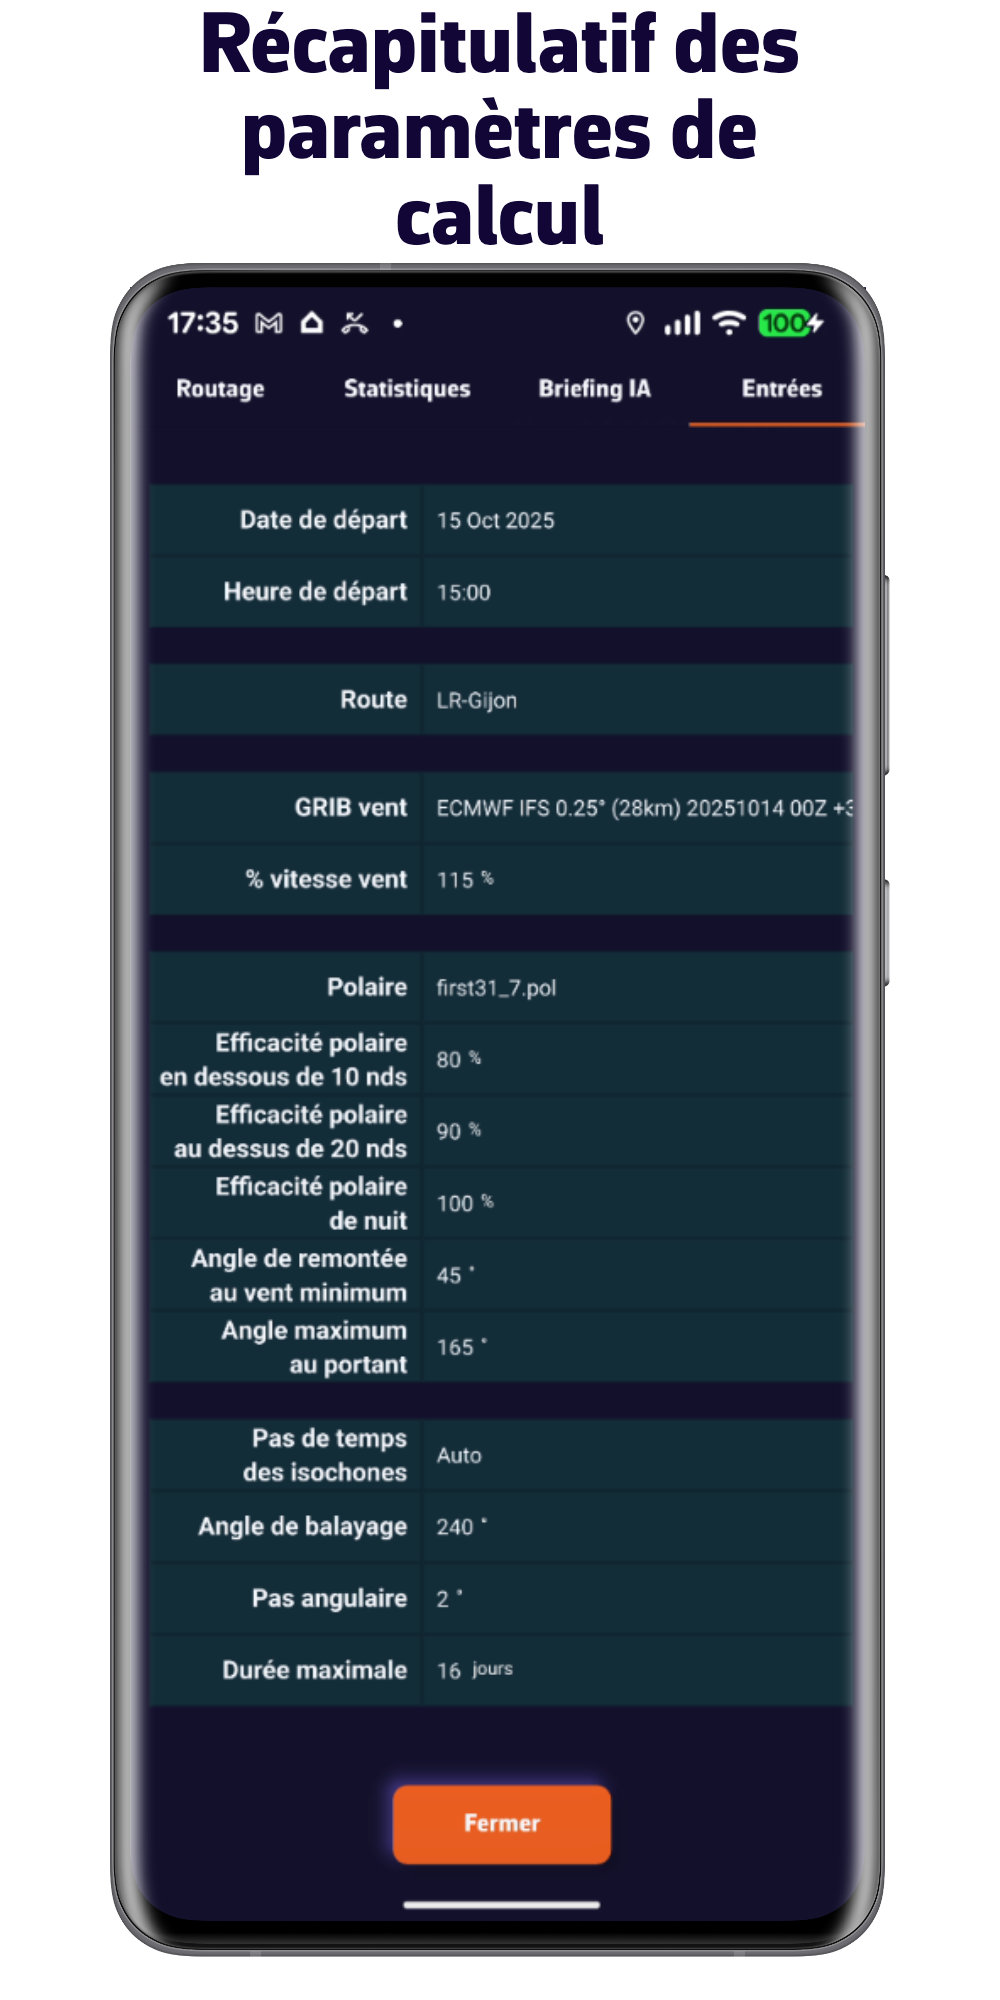
Optimisez votre route facilement et rapidement
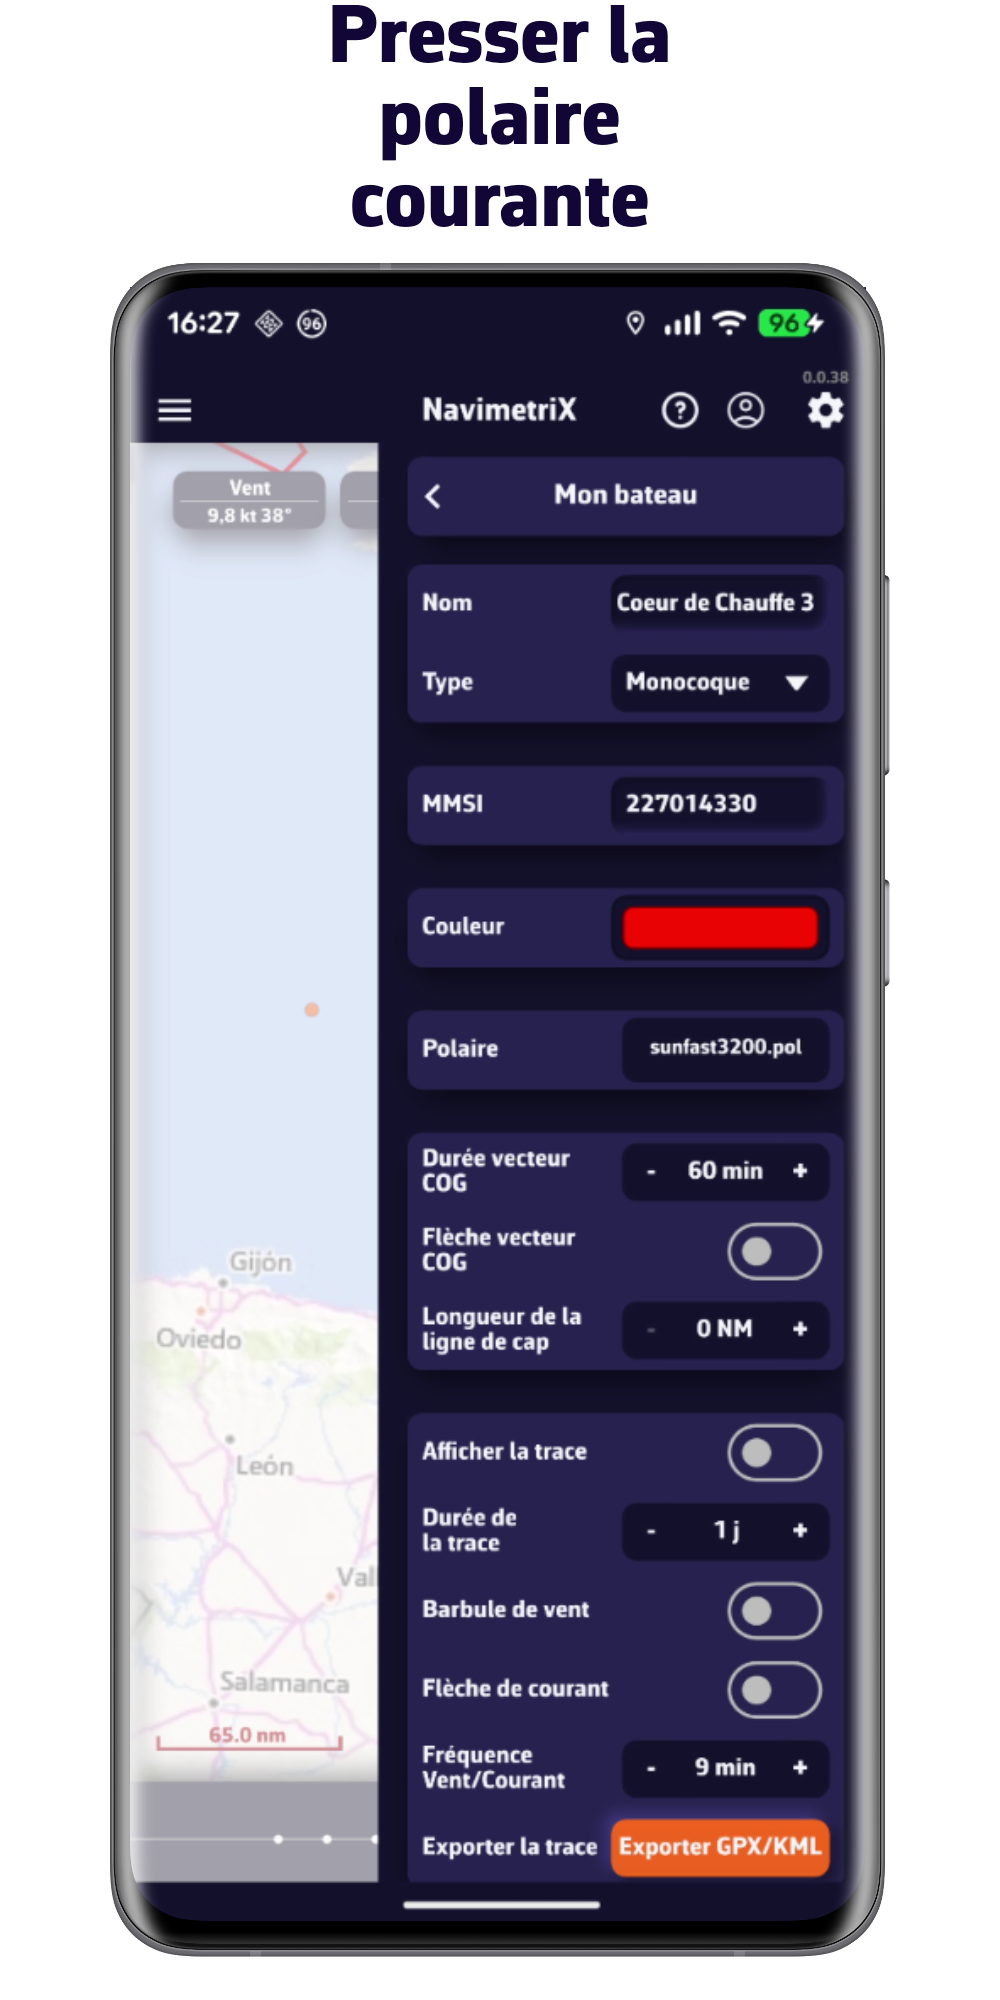
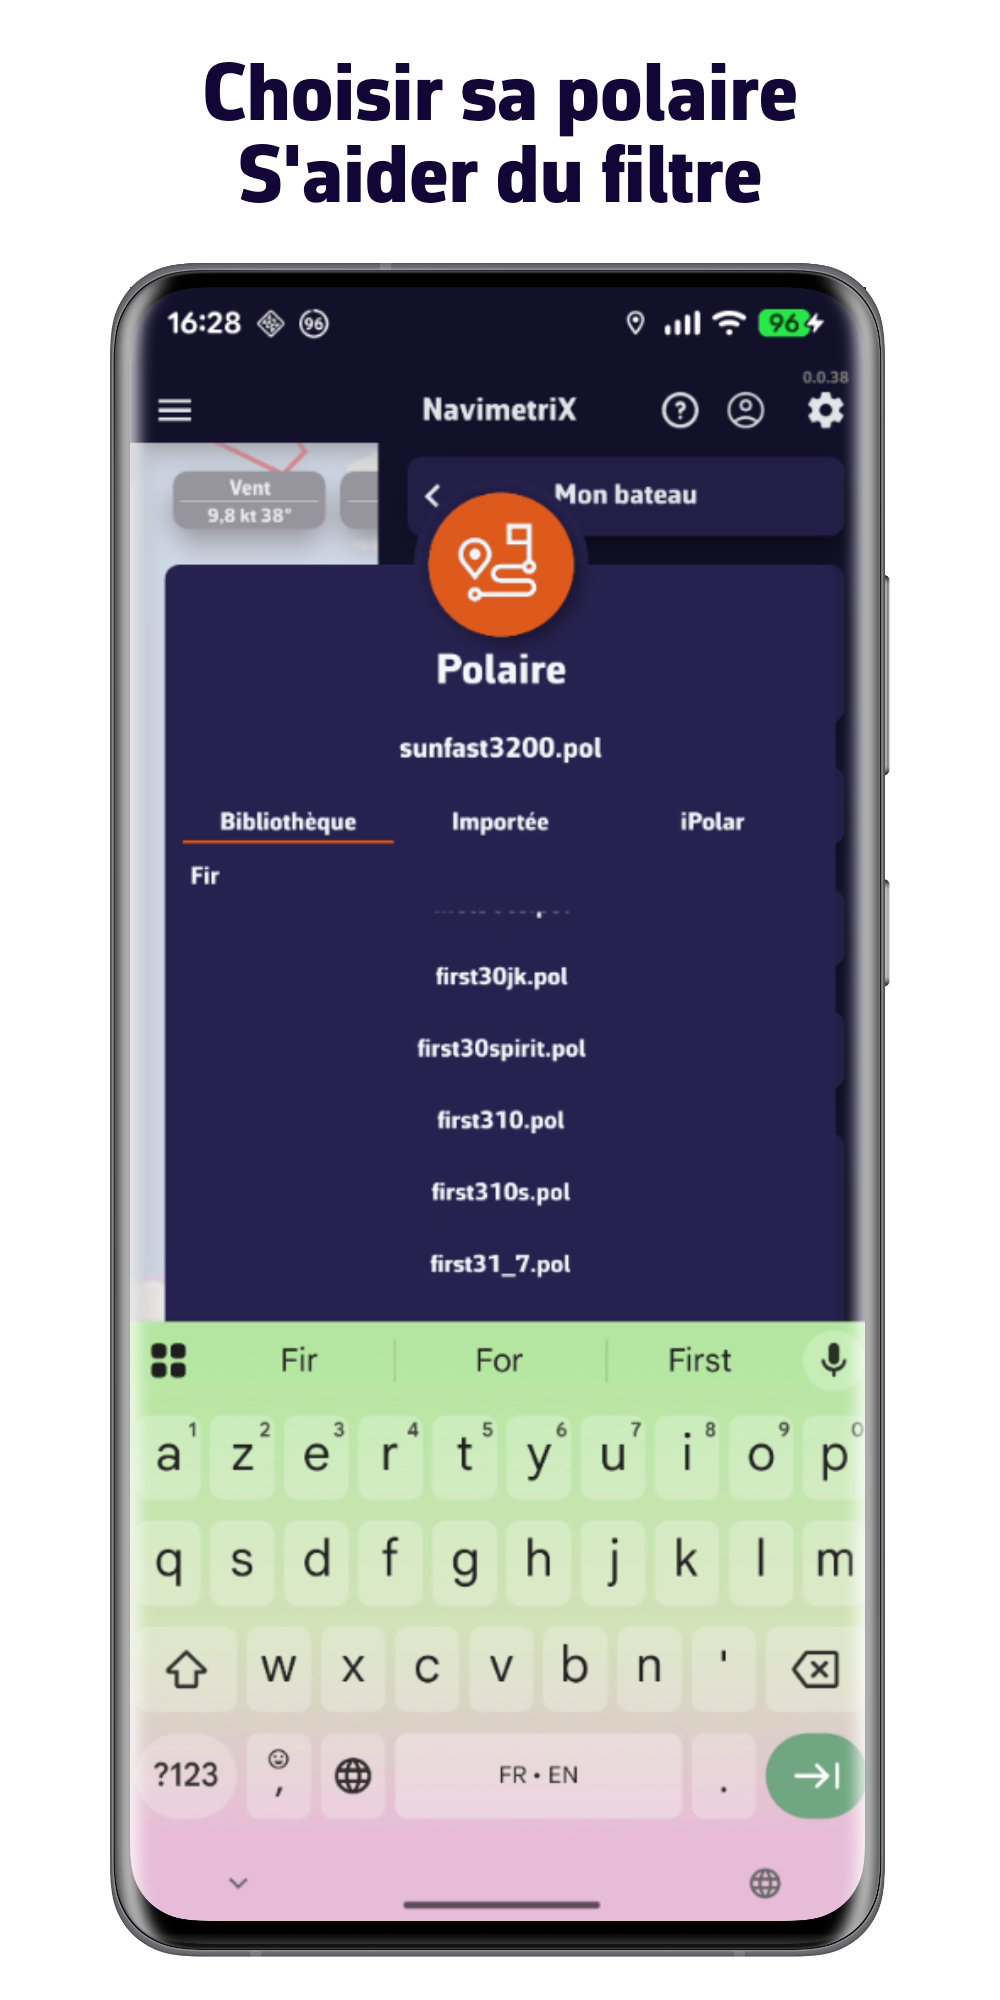
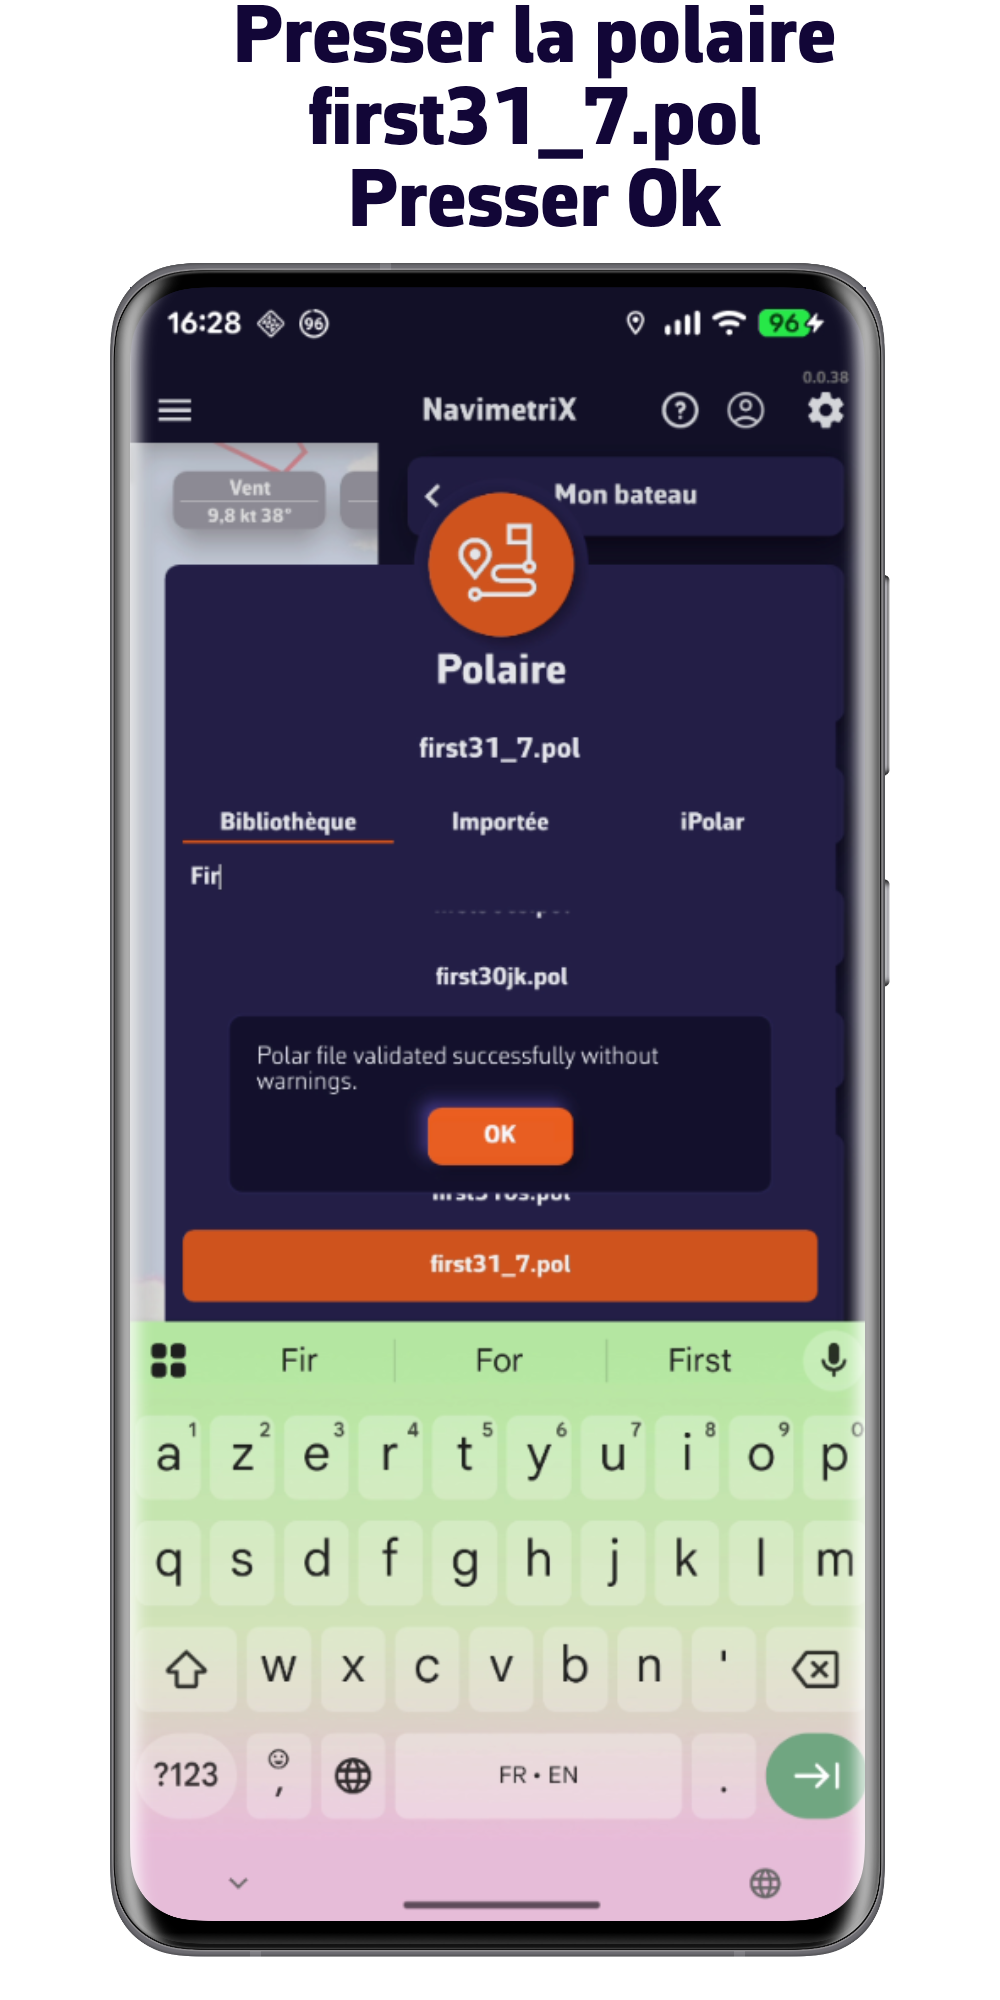
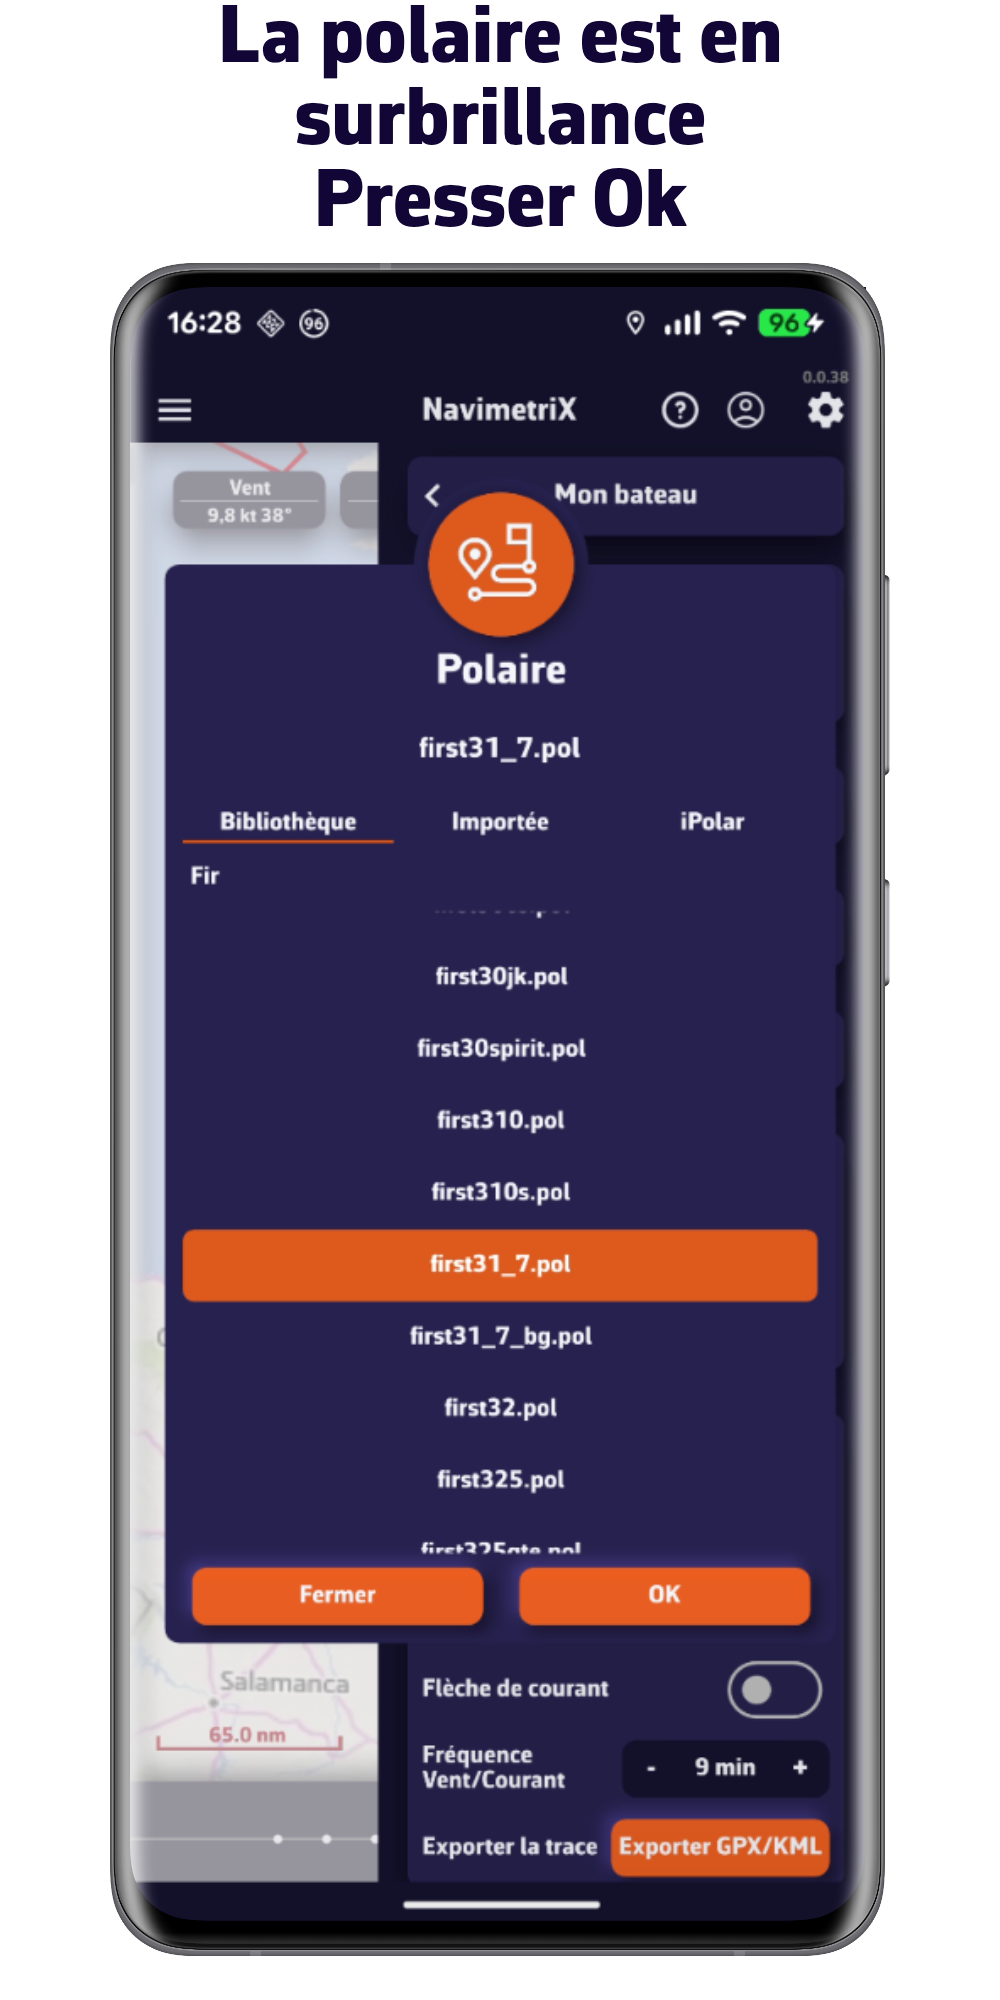
. Choisissez la polaire de votre bateau choisie dans notre vaste bibliothèque, importez la ou calculez la en quelques clics
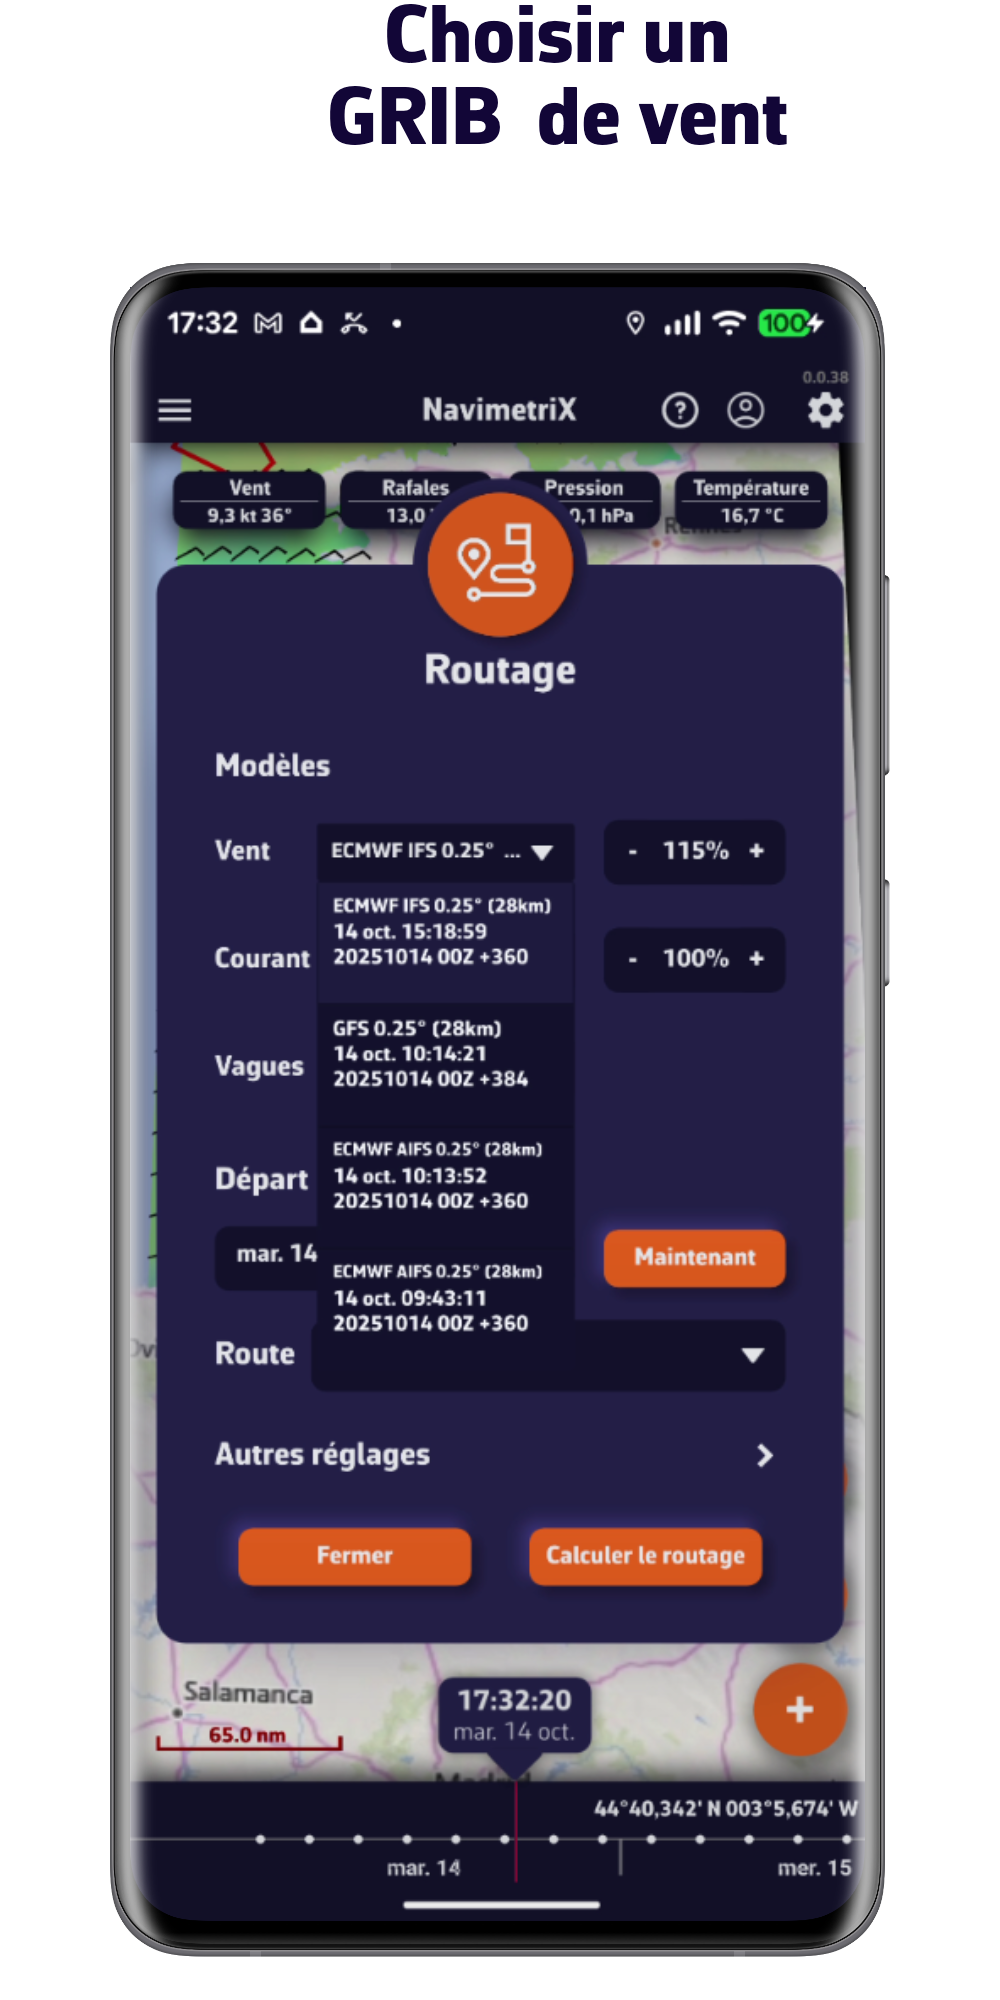
. Intégrez les prévisions de vent, de vagues et de courants
. Contraignez votre routage en fonction de votre style de navigation
. Travaillez votre routage avec des points pivots
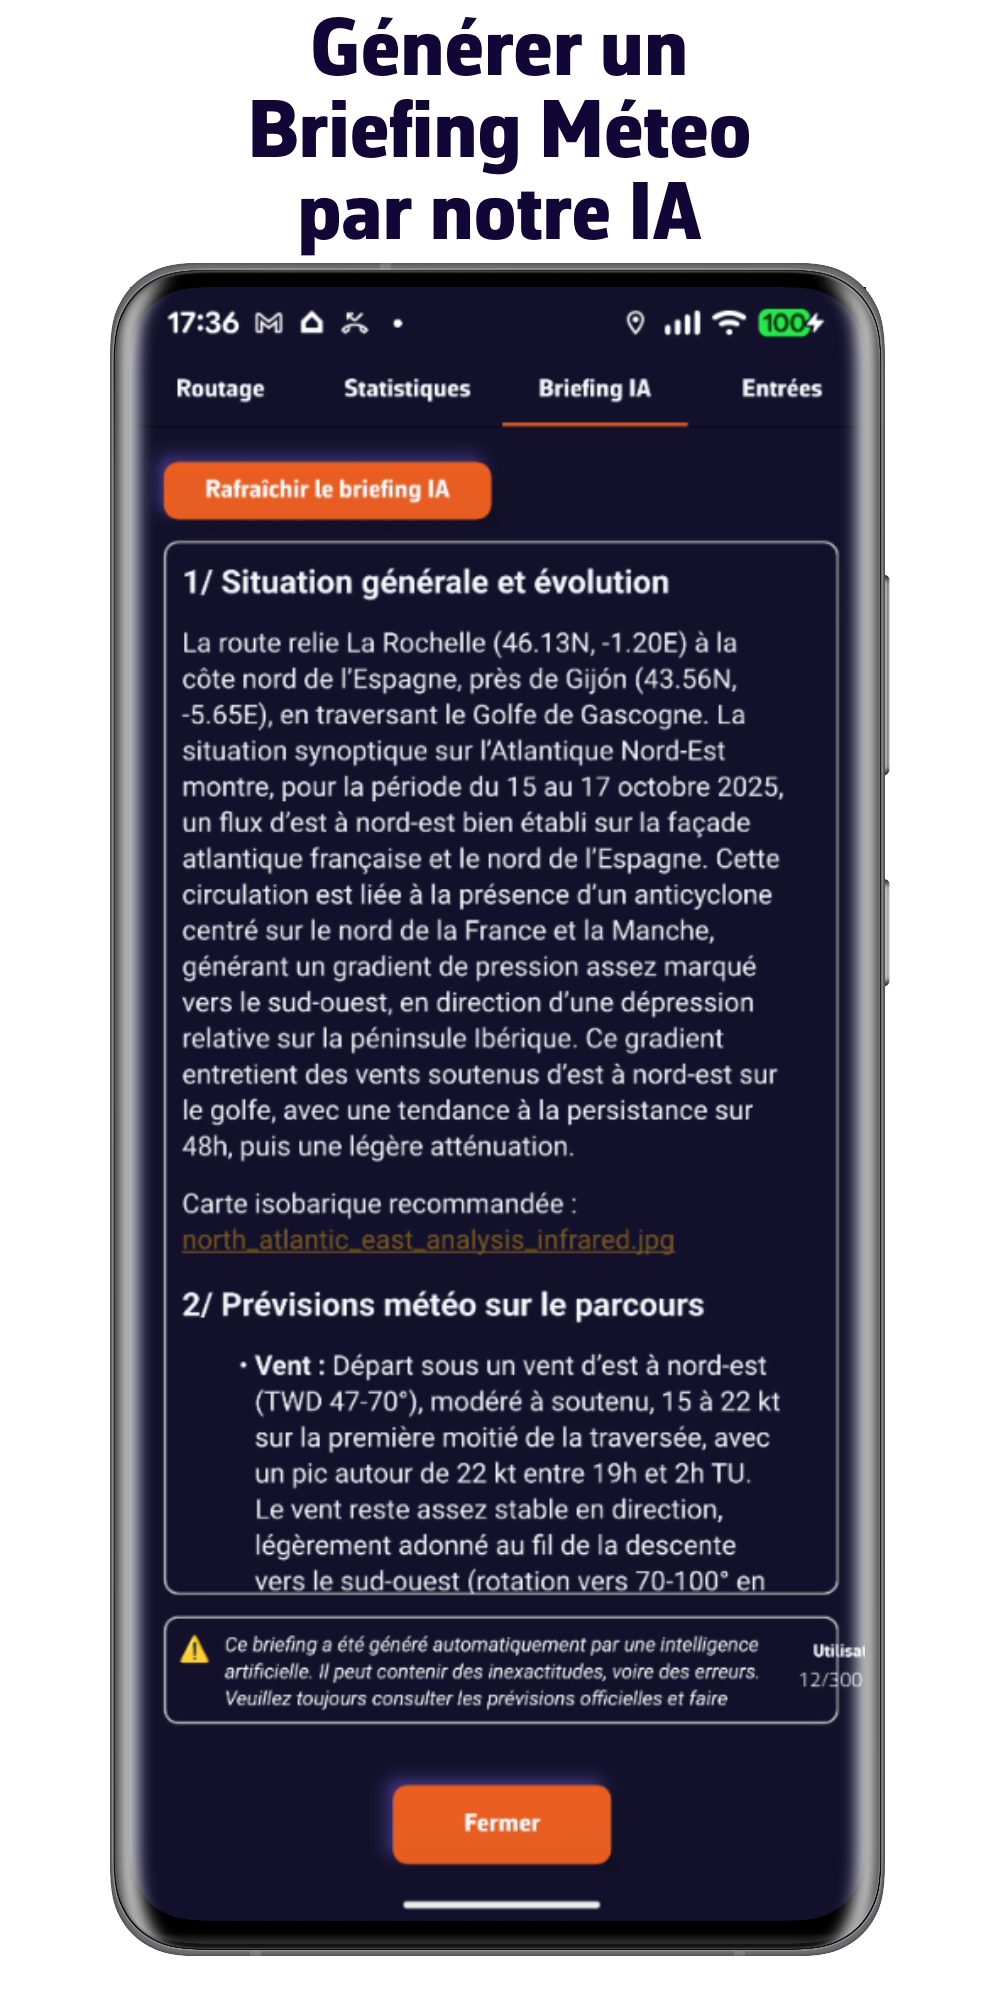
. Demandez à notre IA de vous préparez un briefing météo
Le tout très rapidement.
Découvrez notre offre
VERSION GRATUITE
- Multi-plateformes : iOS, Android, macOS et Windows
- Météo à 5 jours (modèle GFS)
- Routage 2 jours maximum
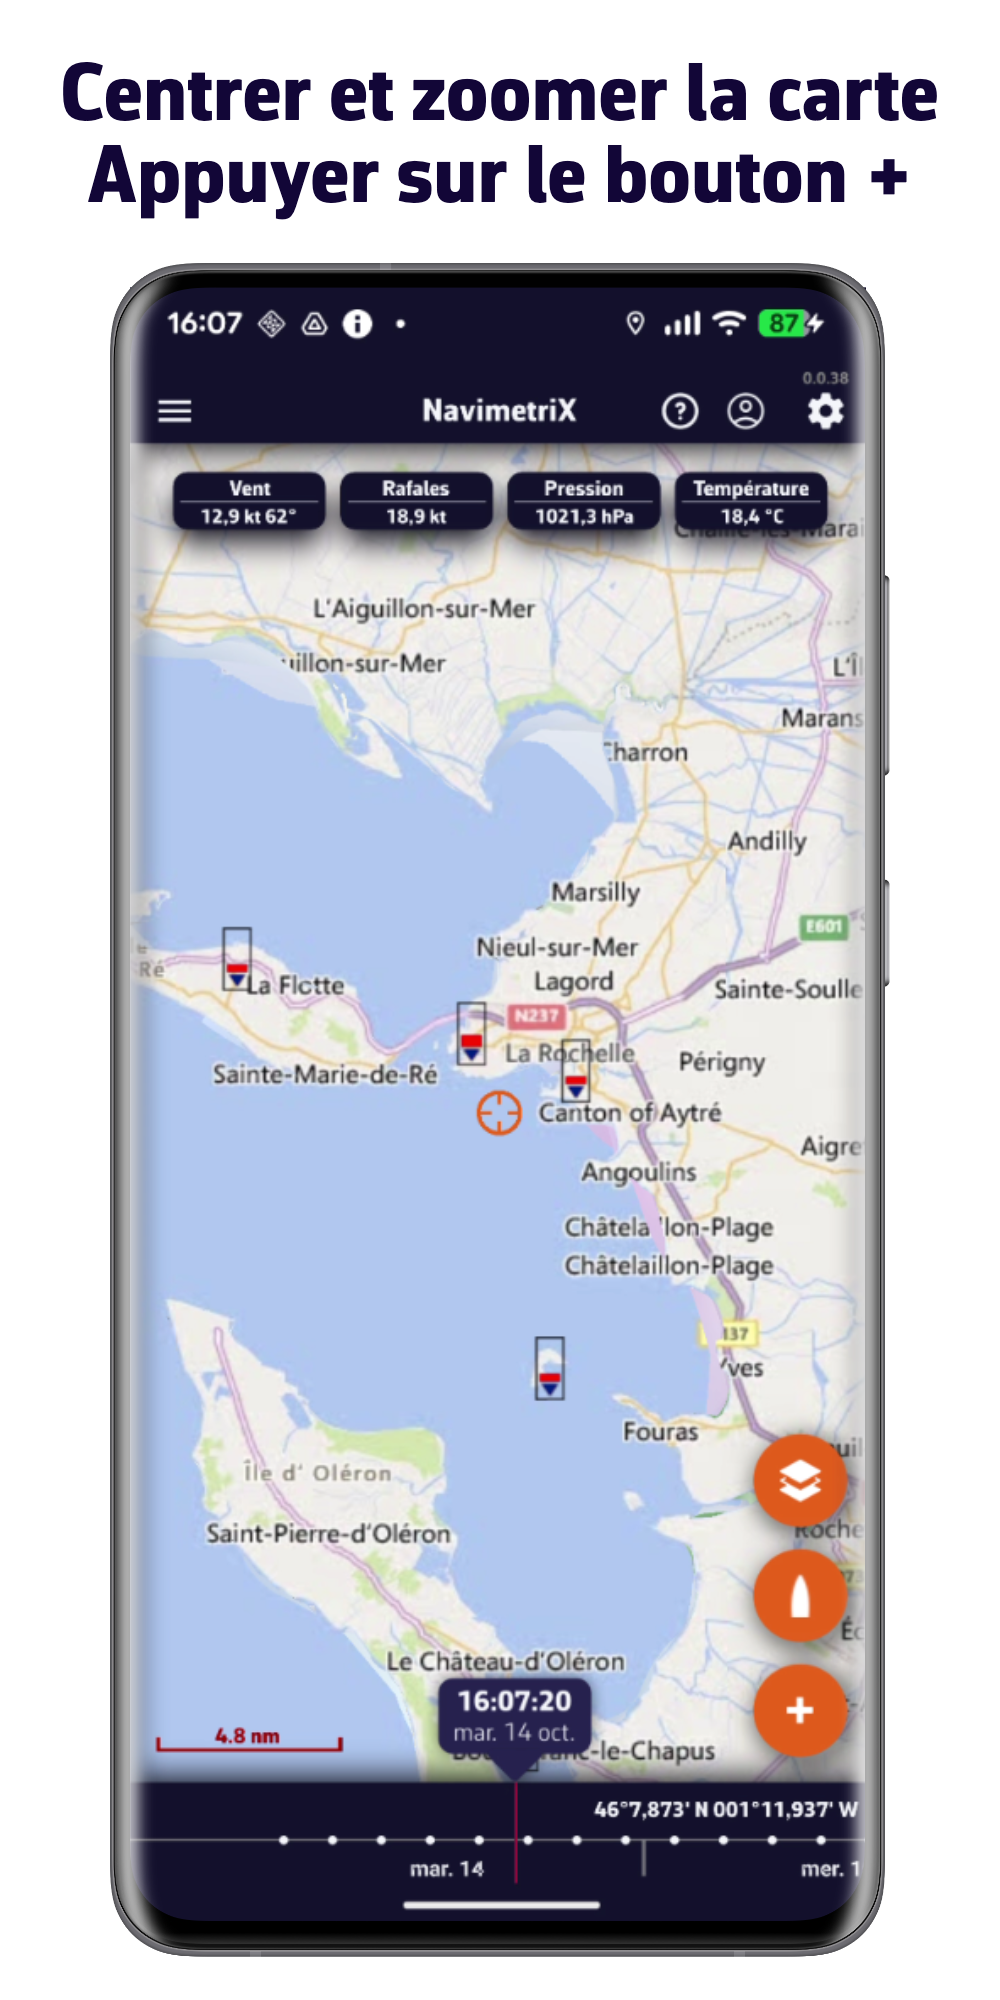
- Visualisation de la météo
- Affichage de vos cartes marine (cartes non fournies)
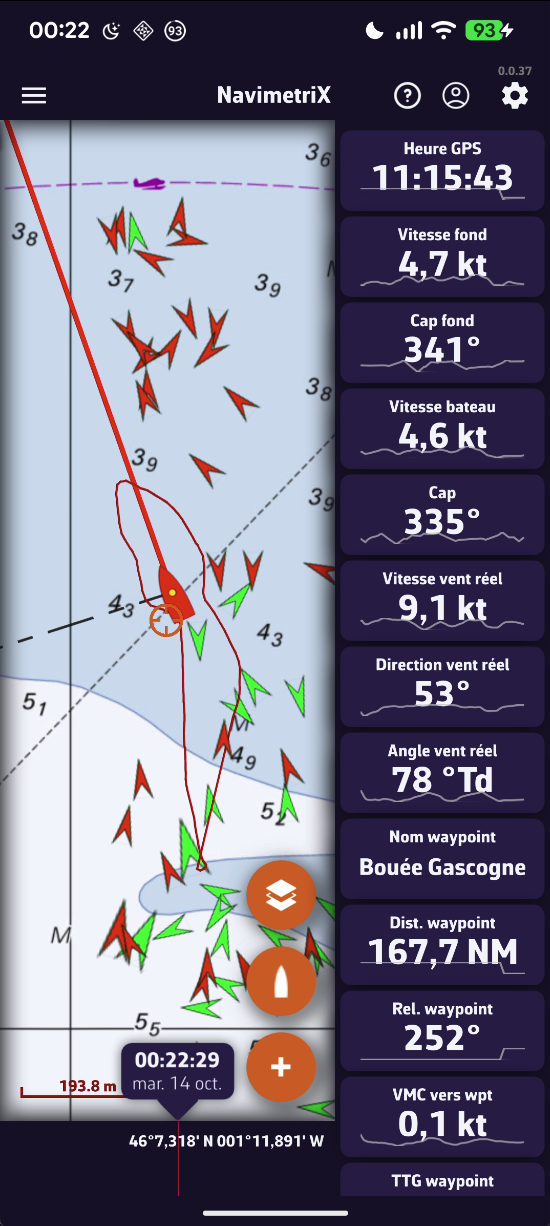
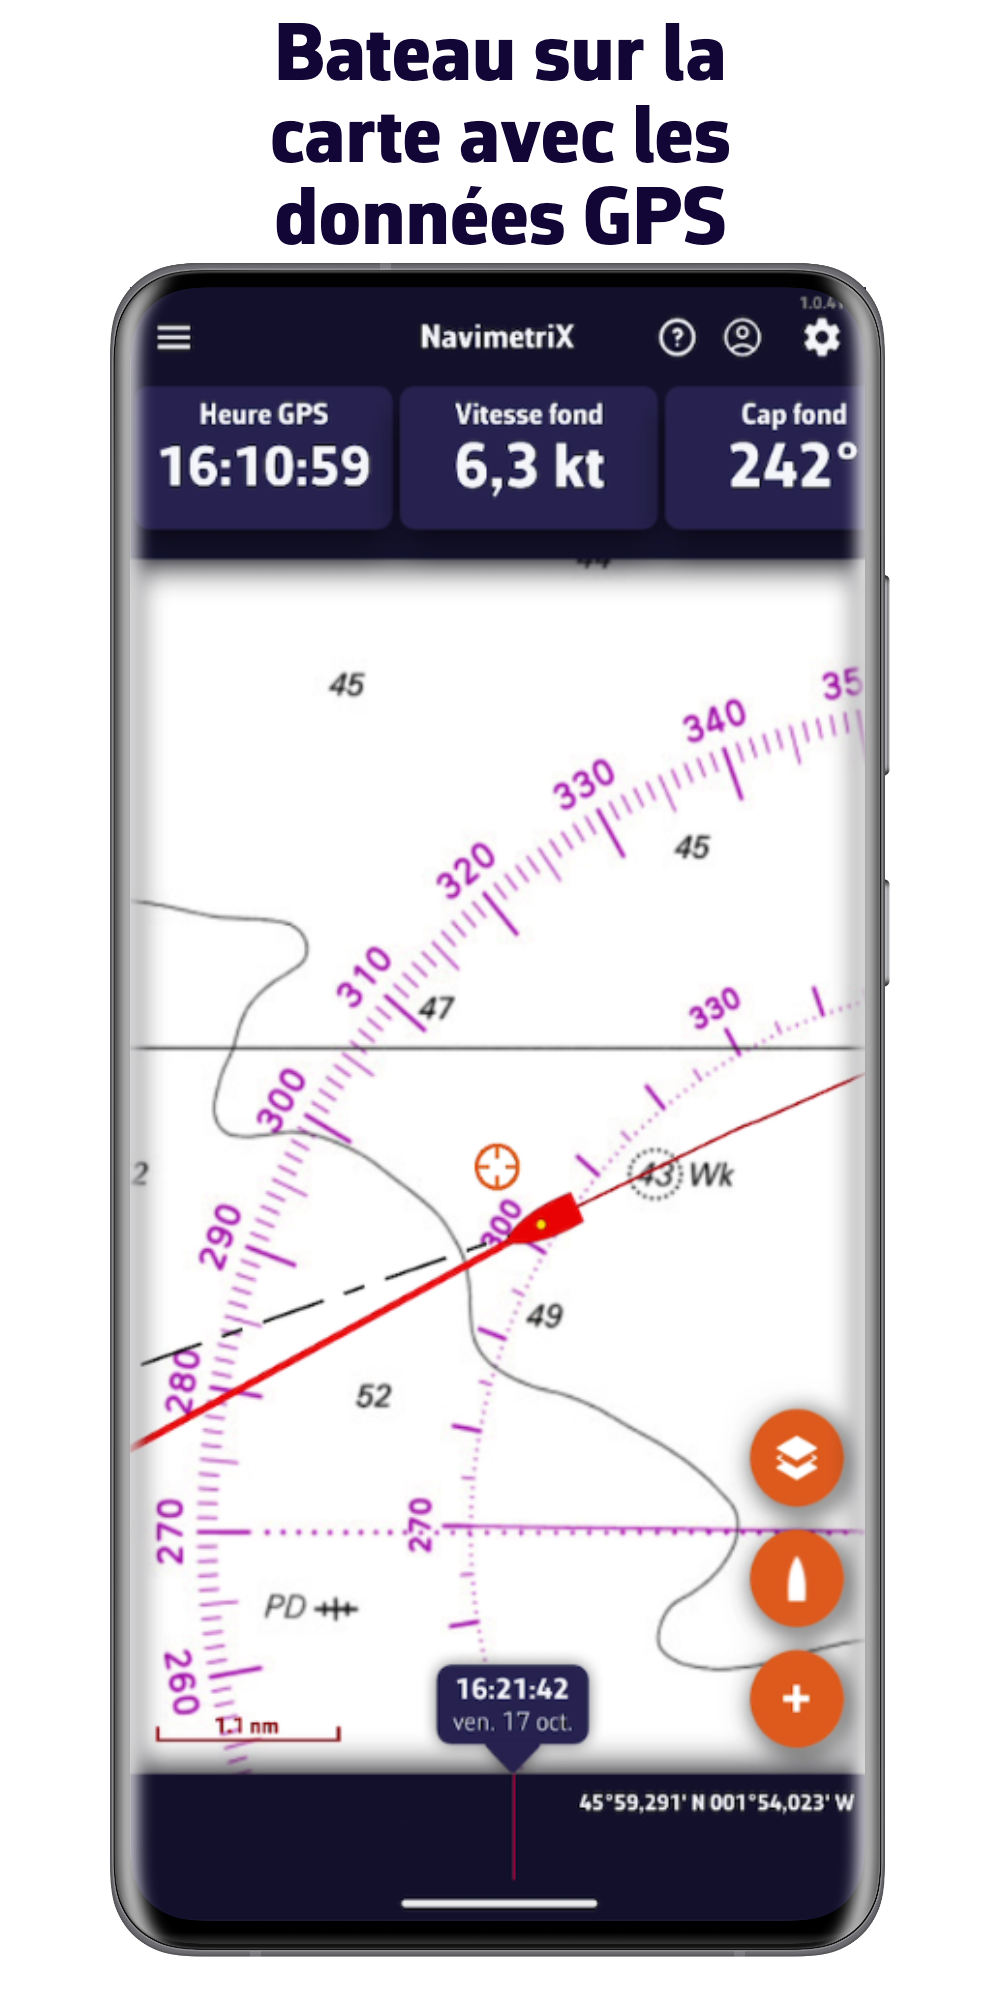
- Mode navigation
- Connexion aux données du bord
- Compte et synchronisation Cloud
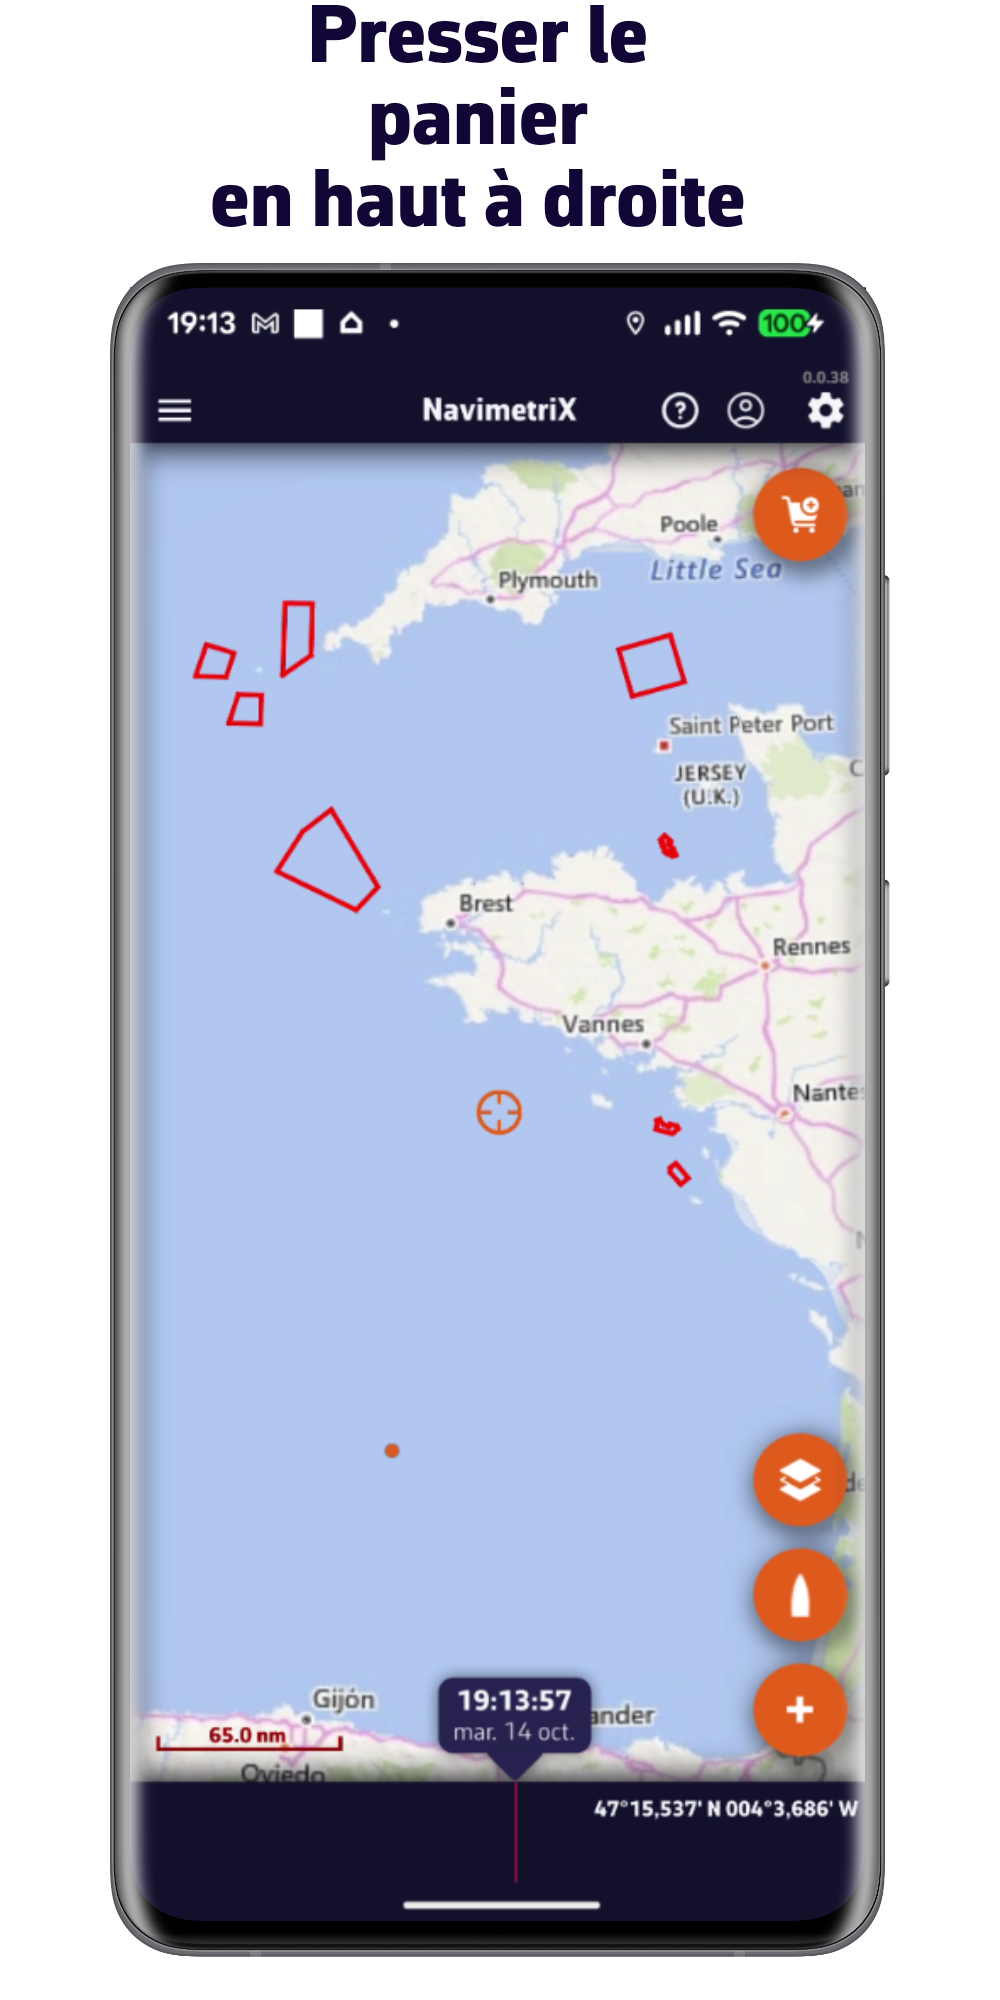
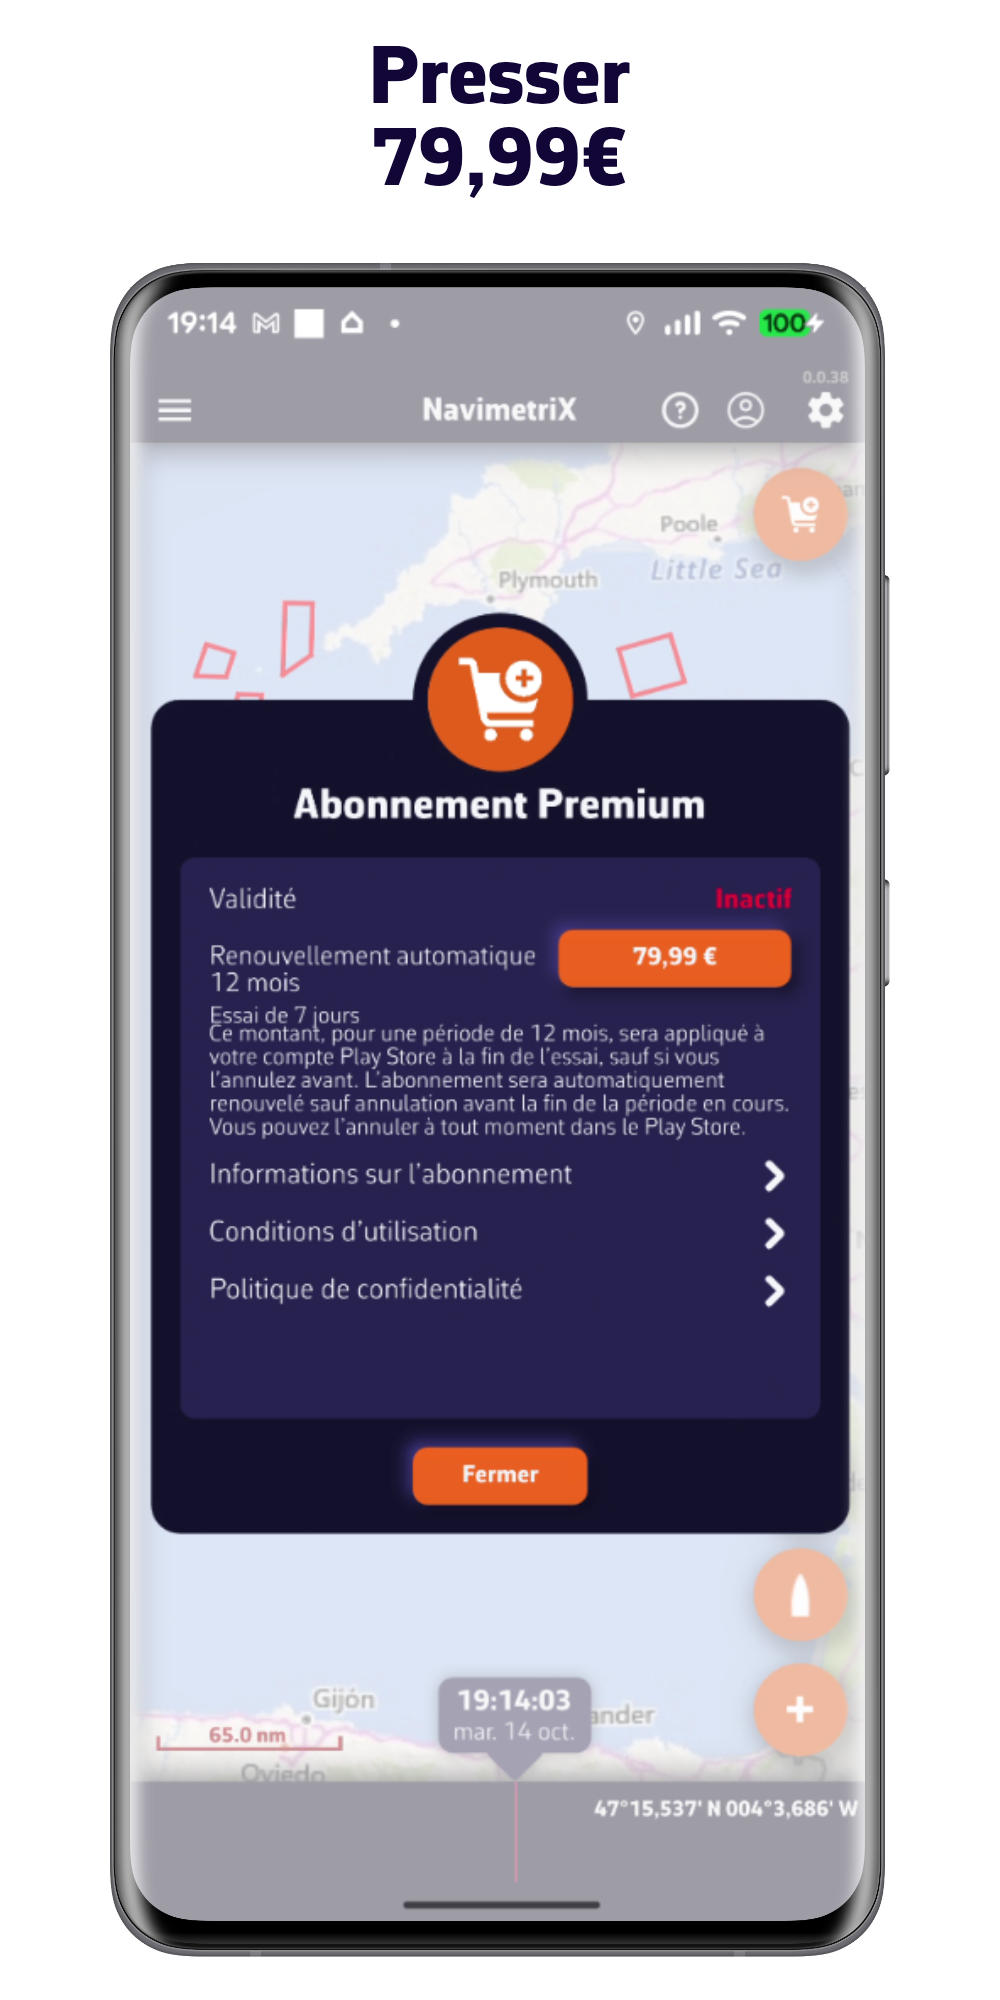
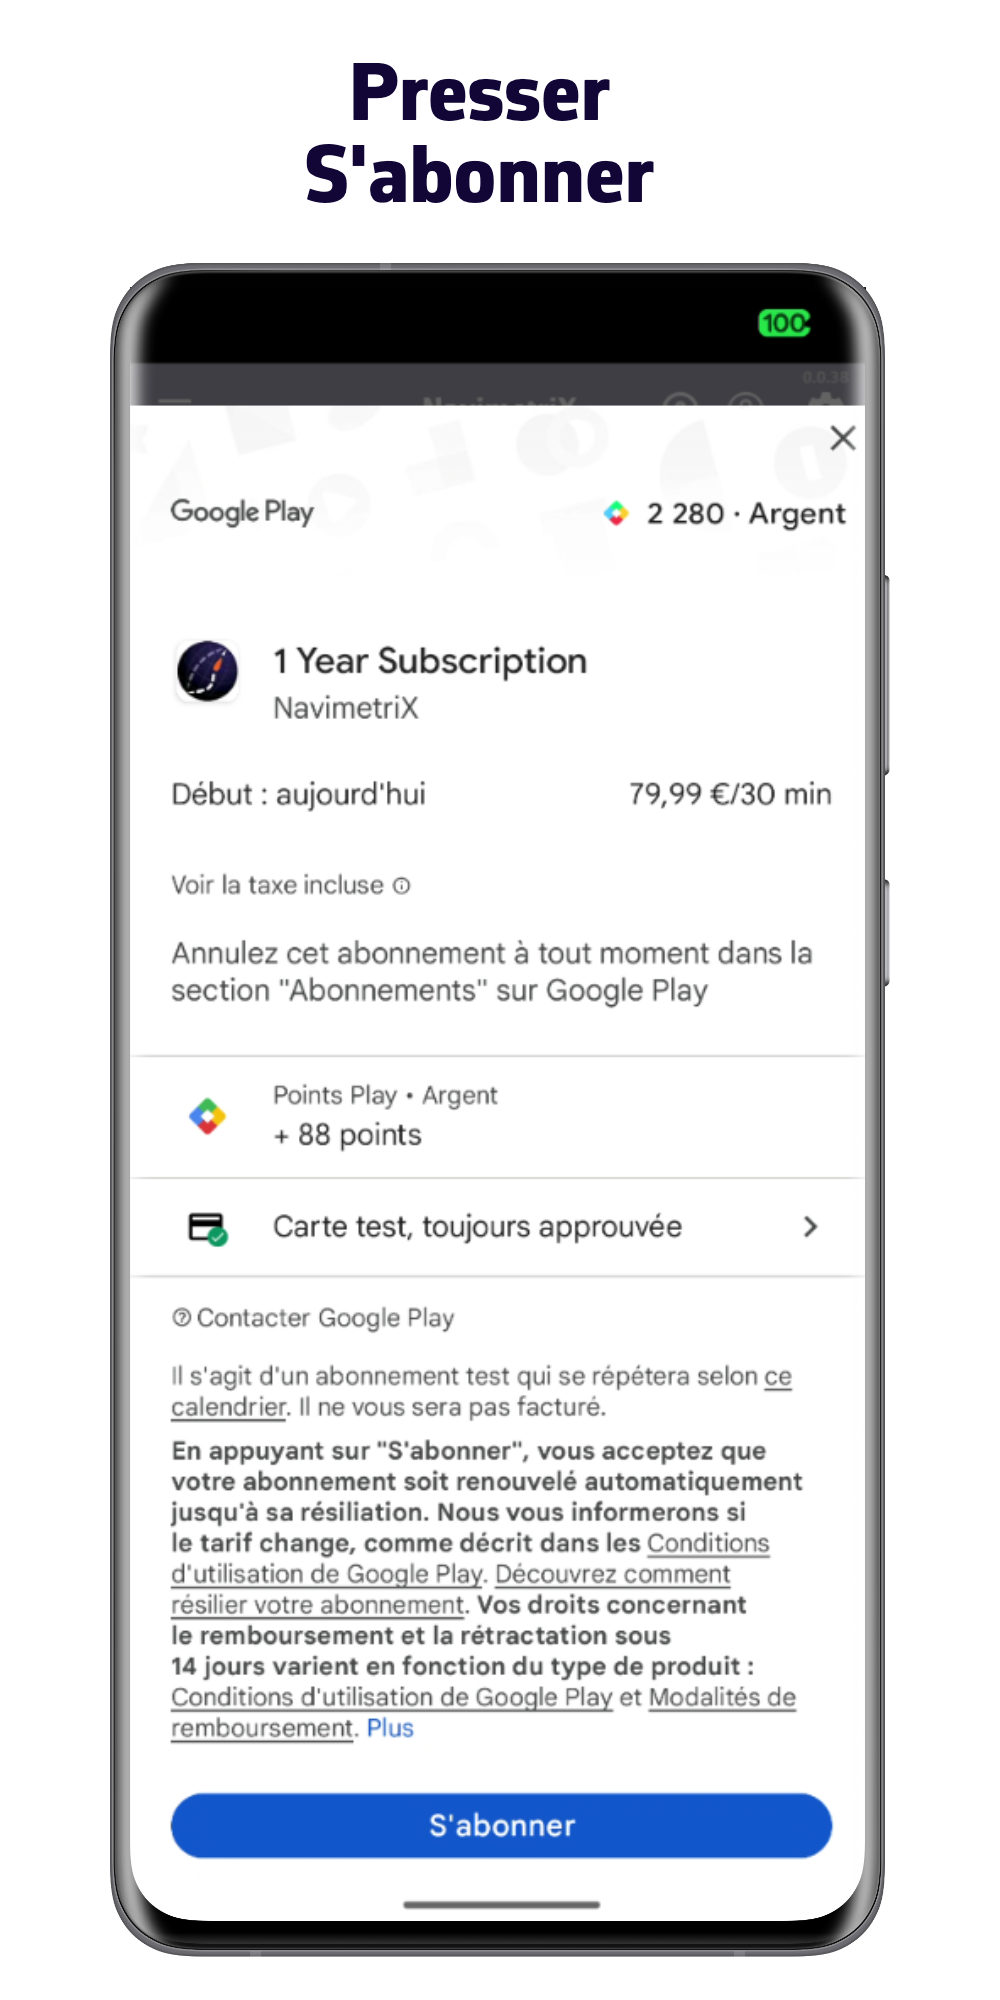
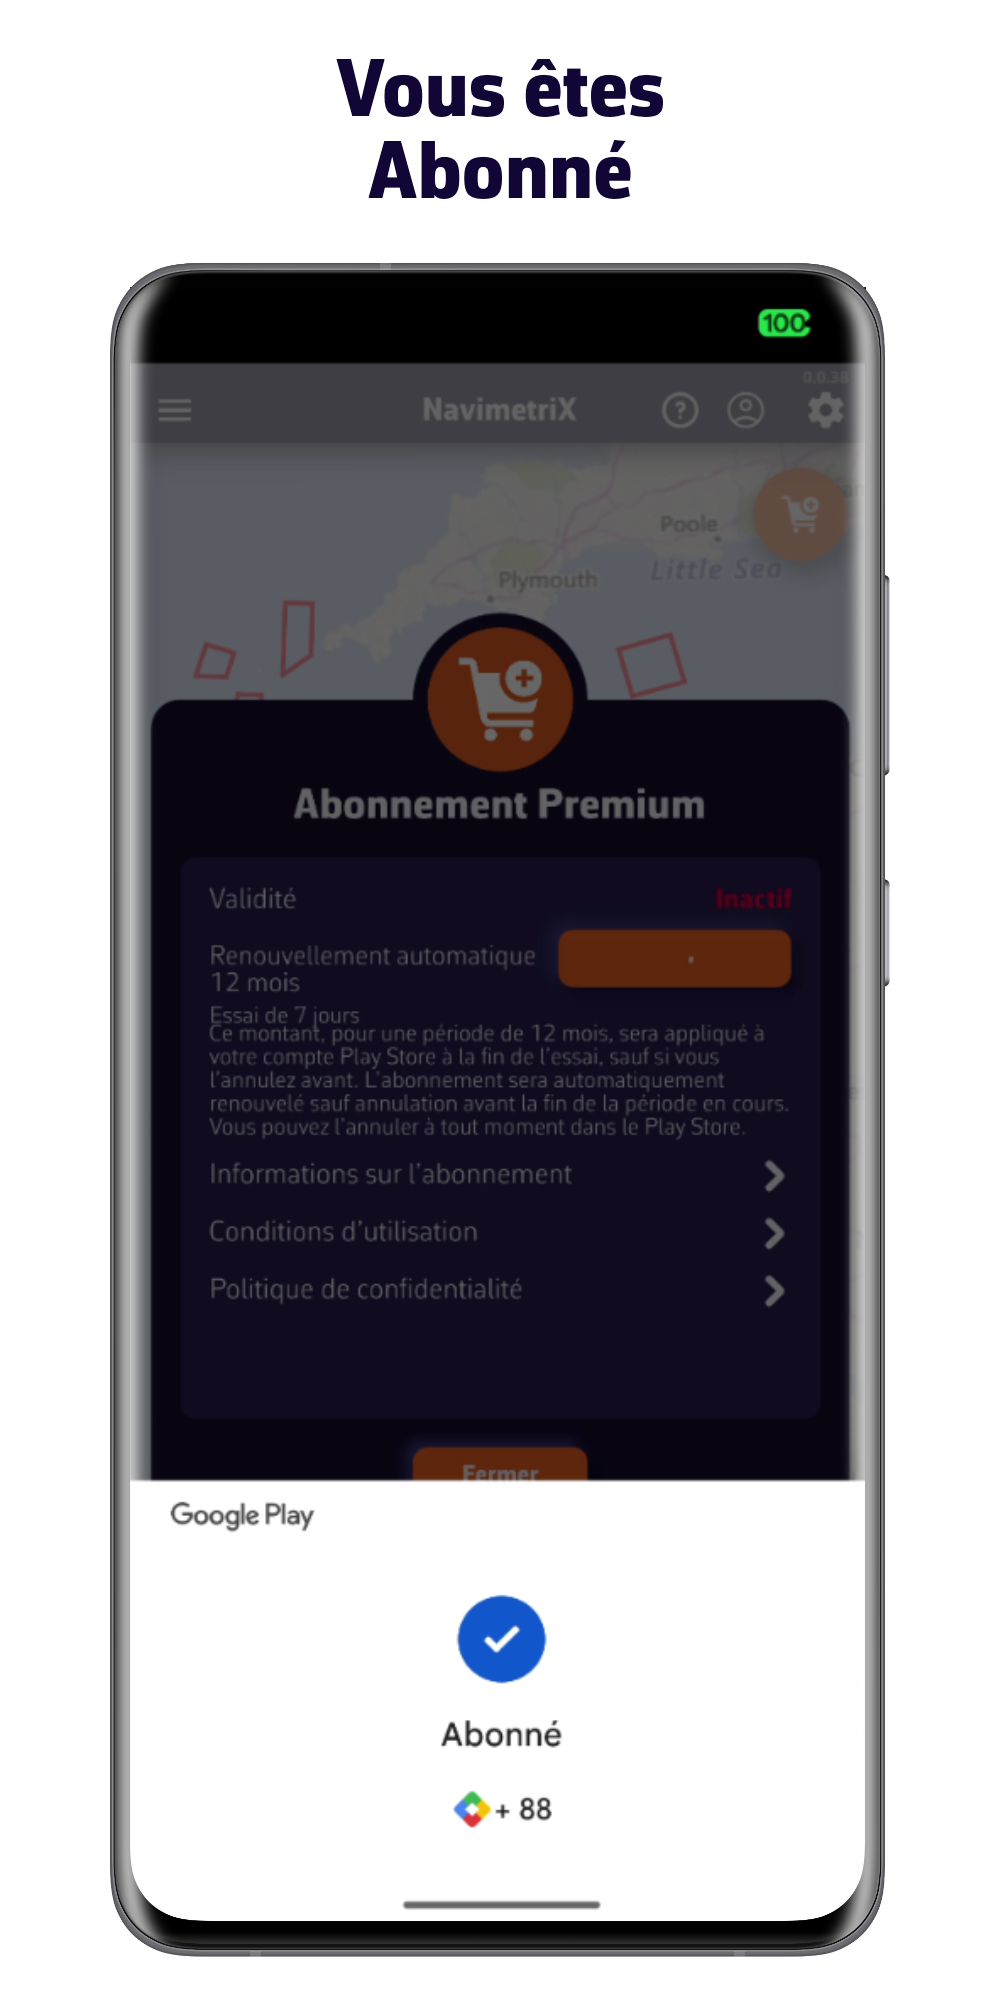
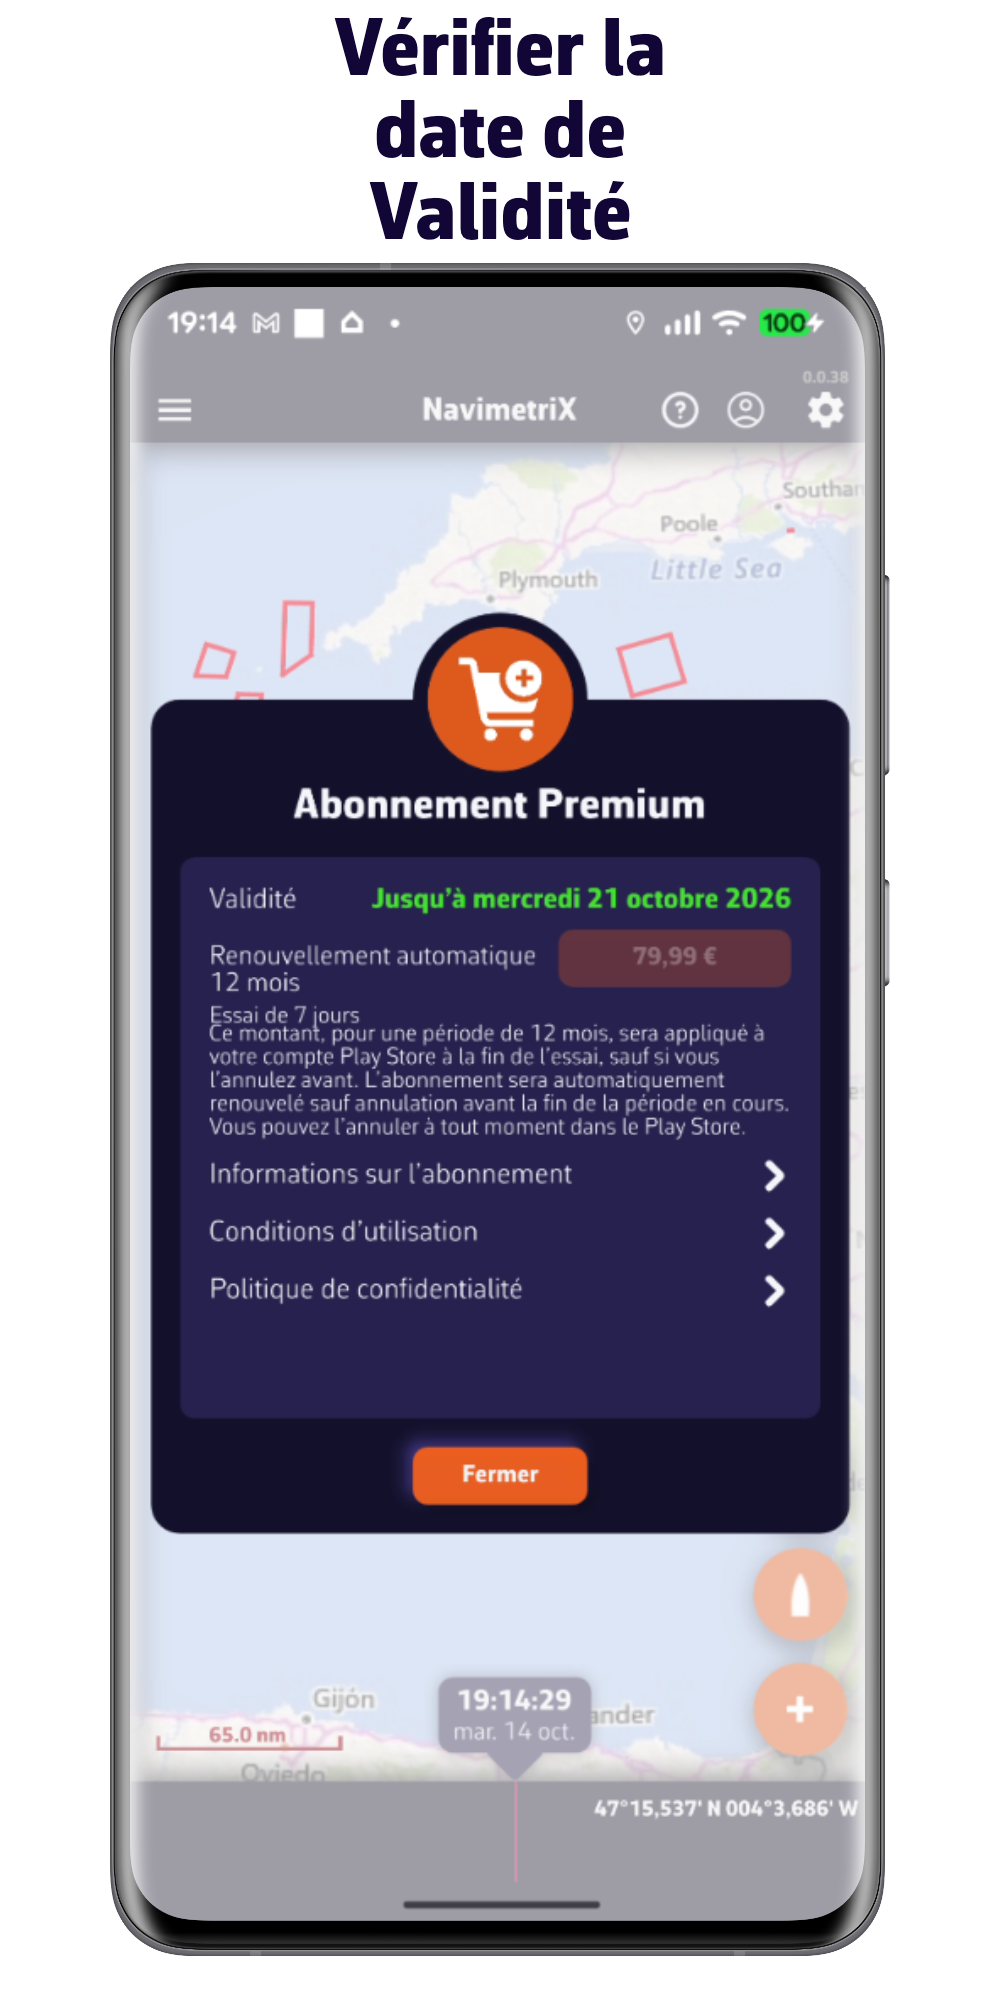
ABONNEMENT PREMIUM
une semaine d'essai gratuite
Toutes les options de la version gratuite plus :
- Compte NavimetriX
- Synchronisation de tous vos appareils
- Vaste choix de modèles météo
- Prévisions jusqu'à 15 jours
- Prévisions des vagues et des courants
- Routage jusqu'à 15 jours
- Briefing Météo généré par notre IA
- Mode navigation
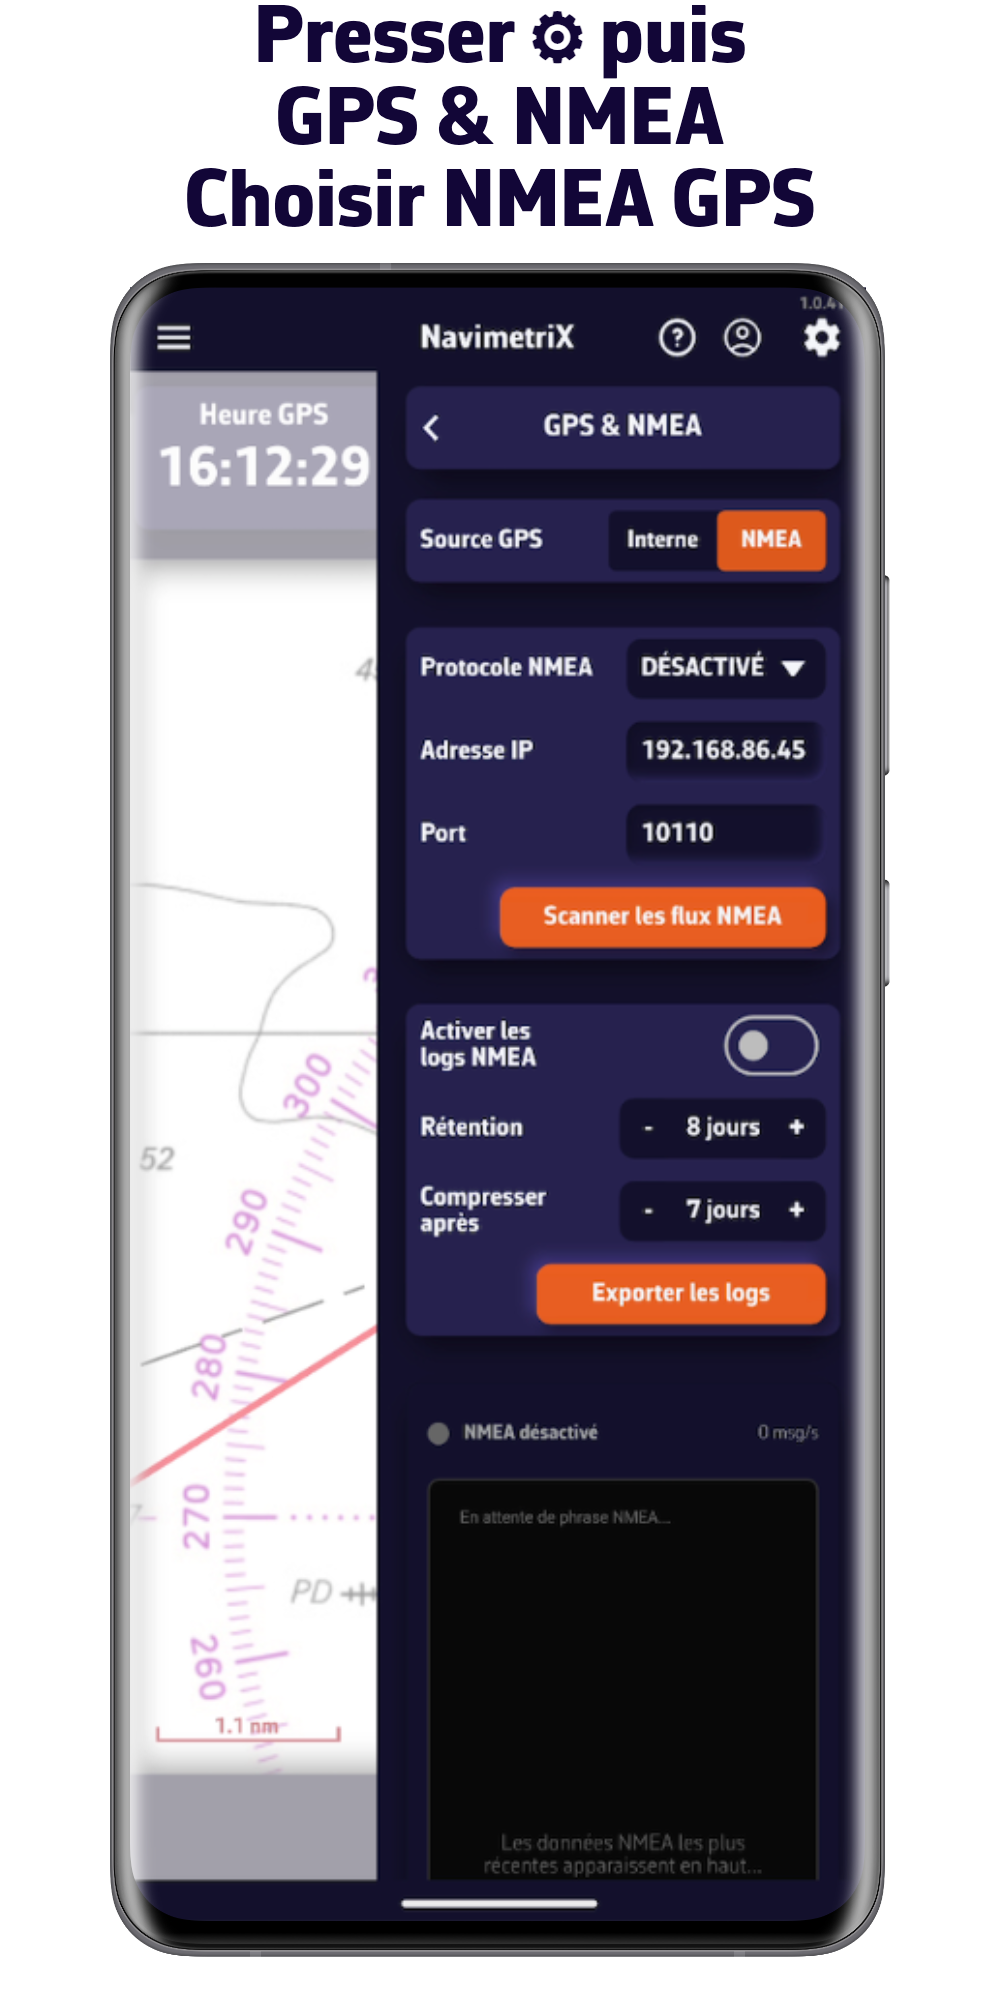
- Connexion aux données GPS et NMEA du bord
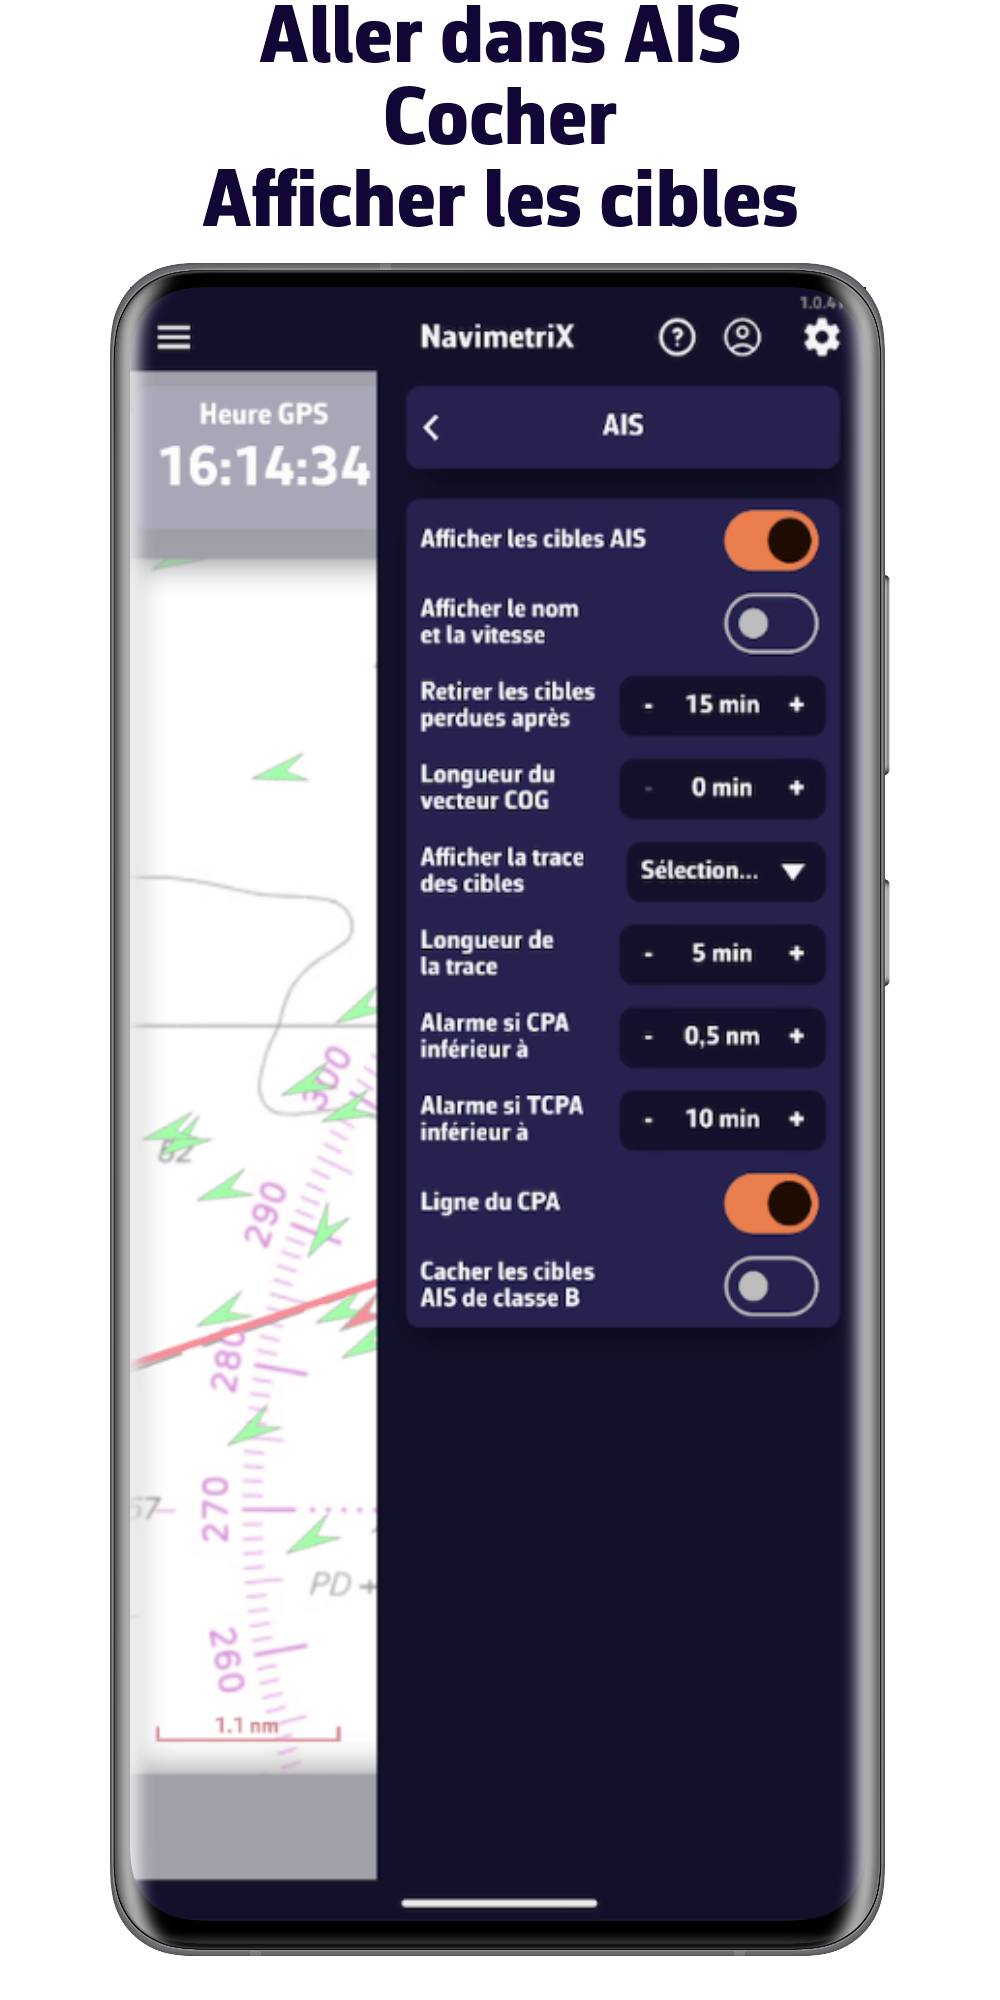
- Traitement des cibles AIS
- Et bien plus encore...
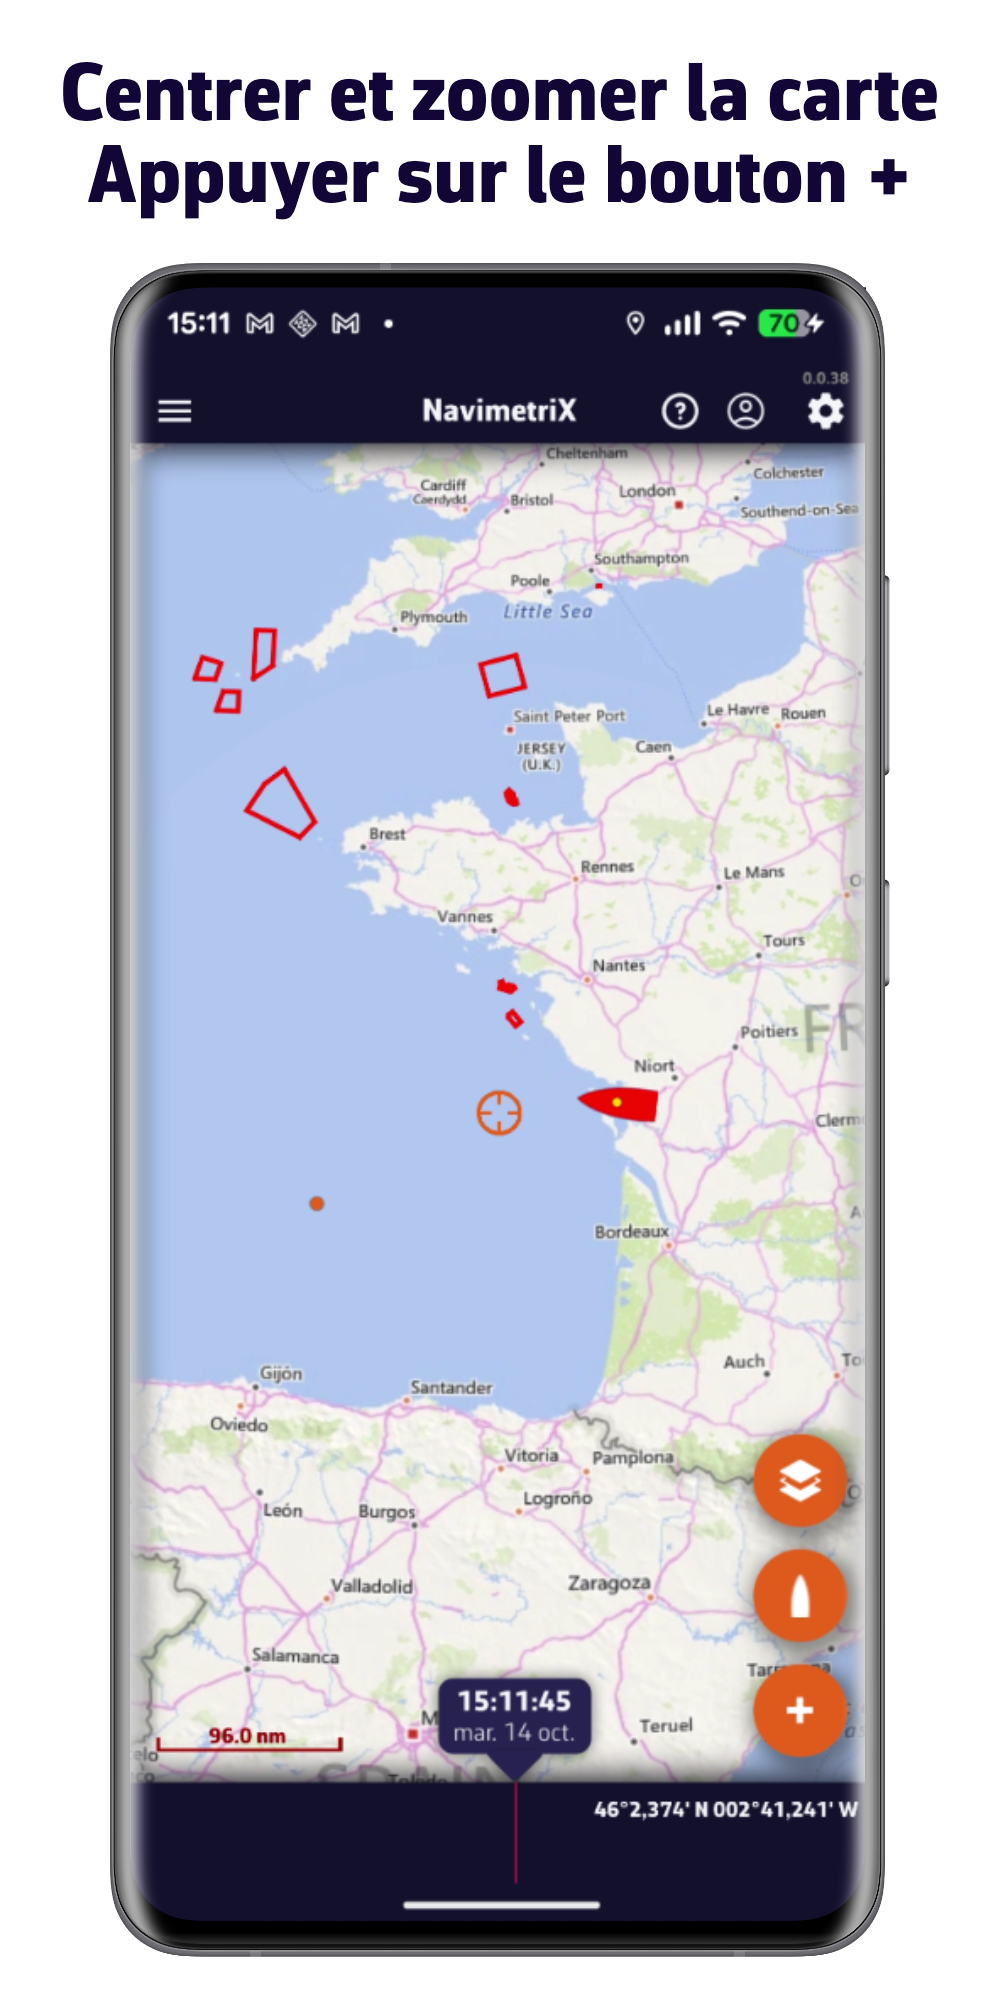
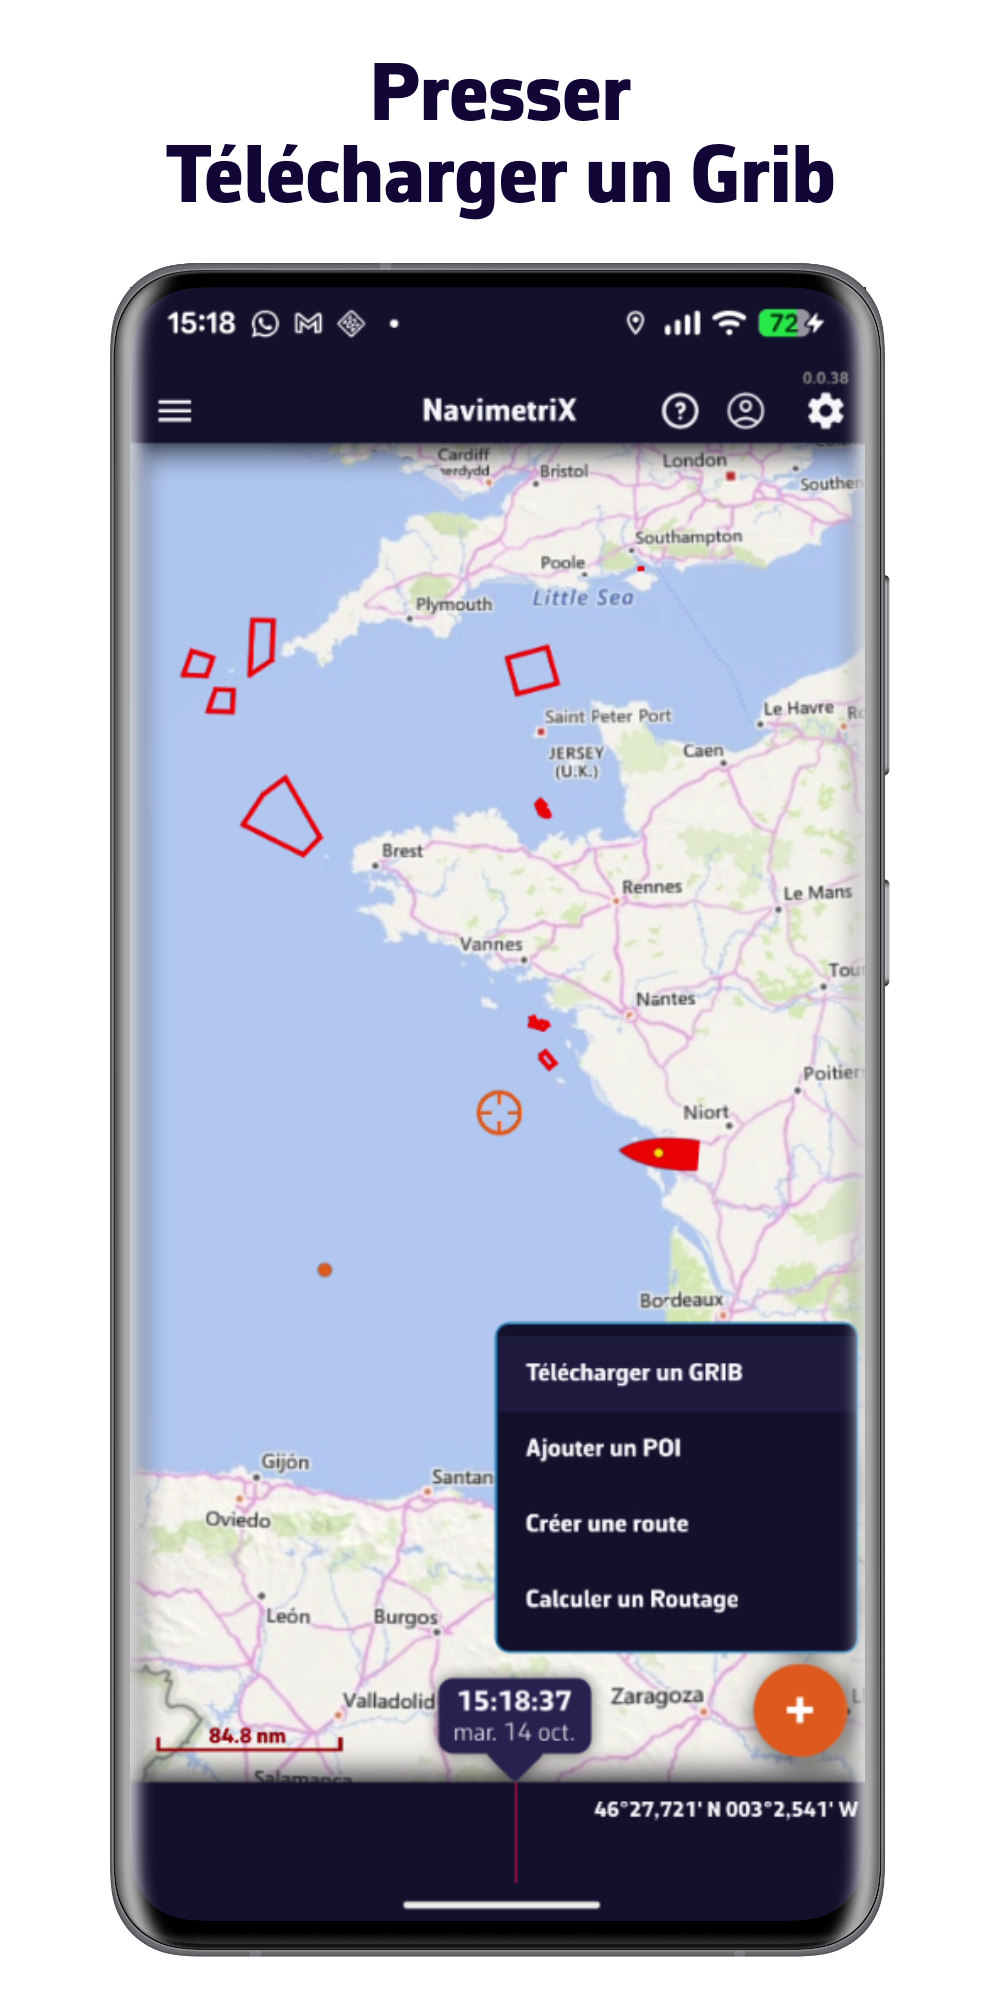
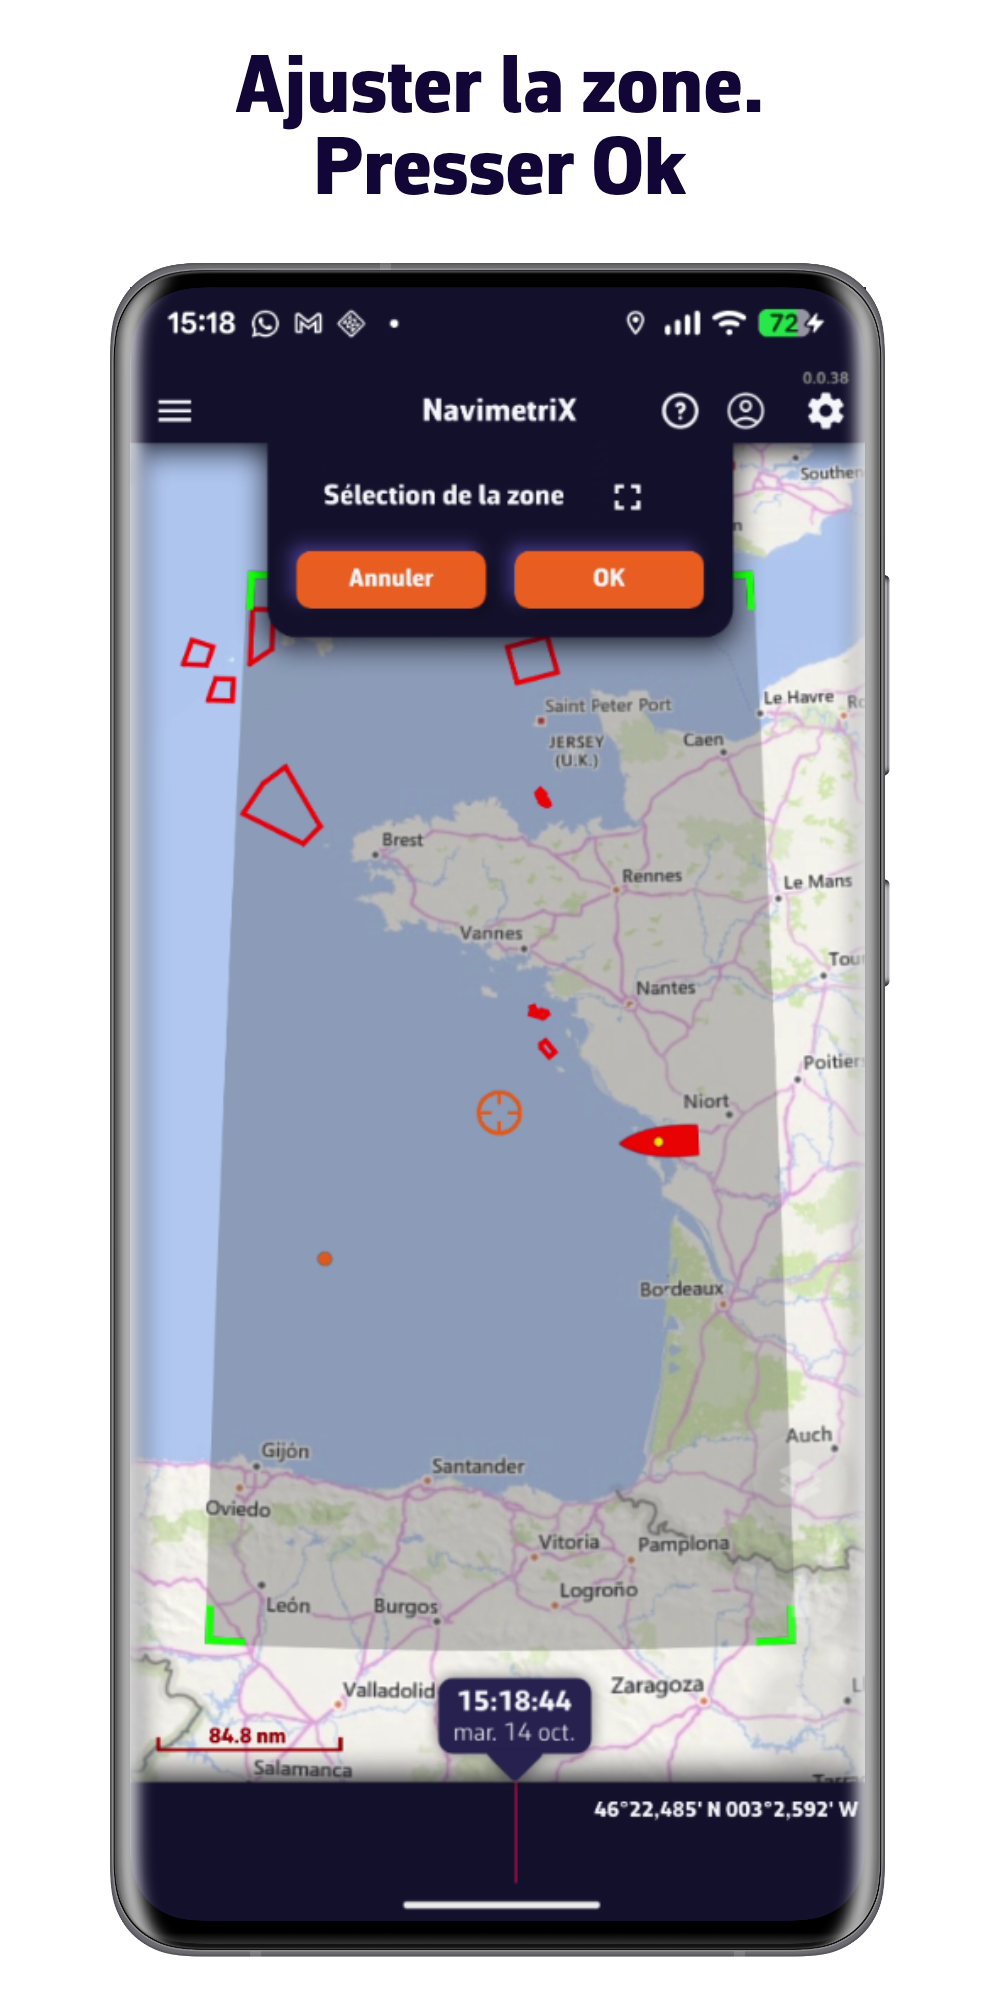
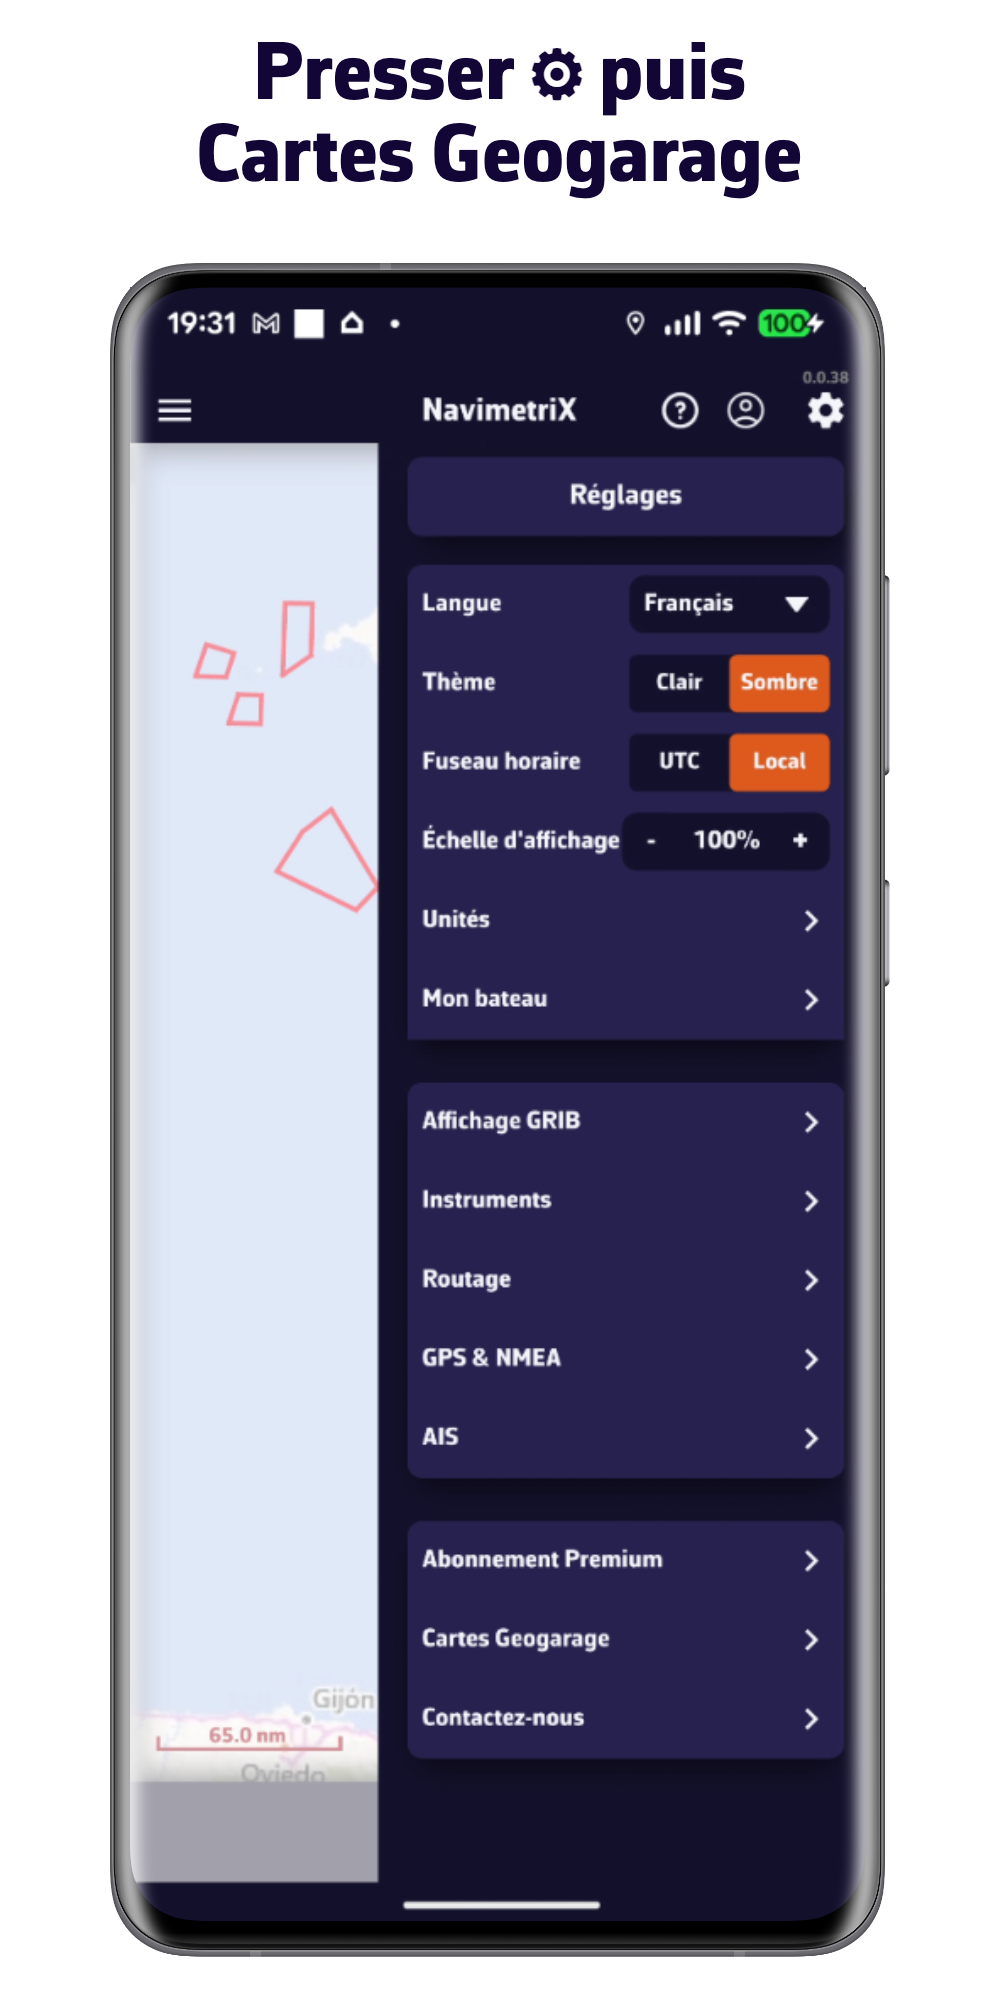
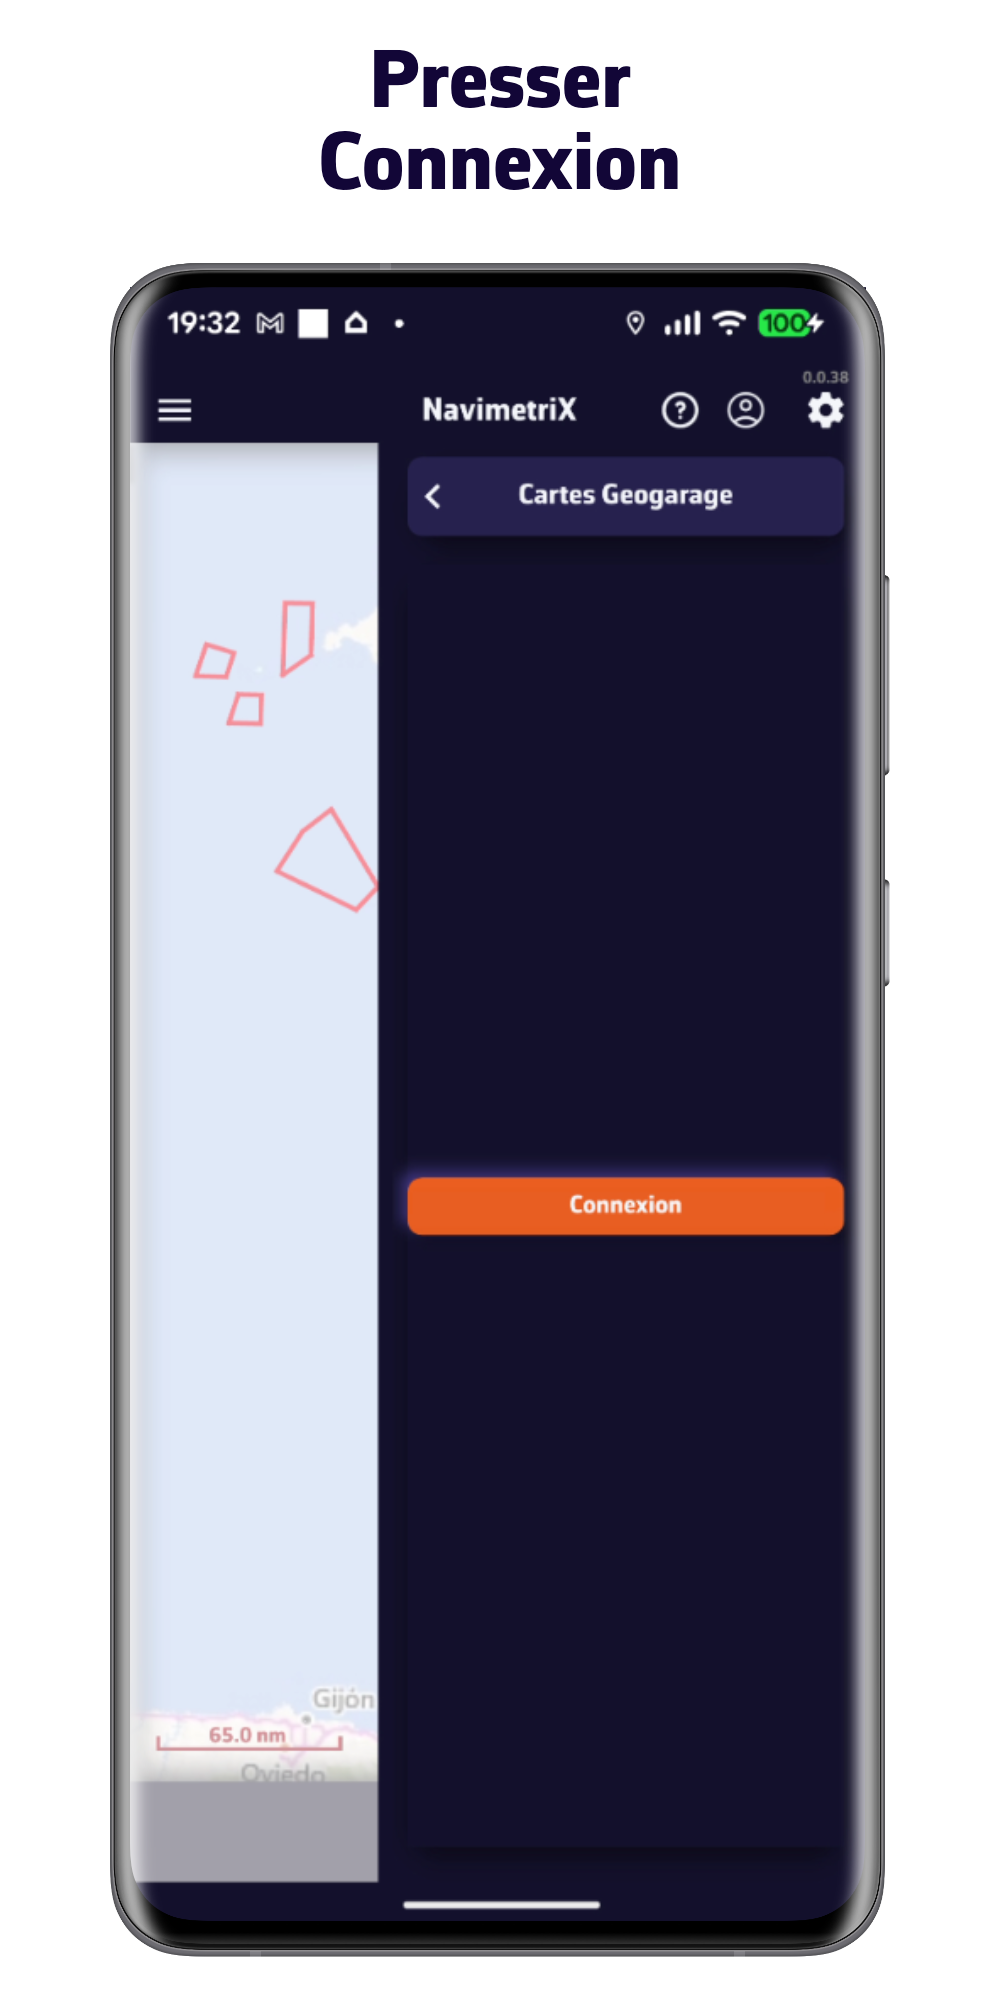
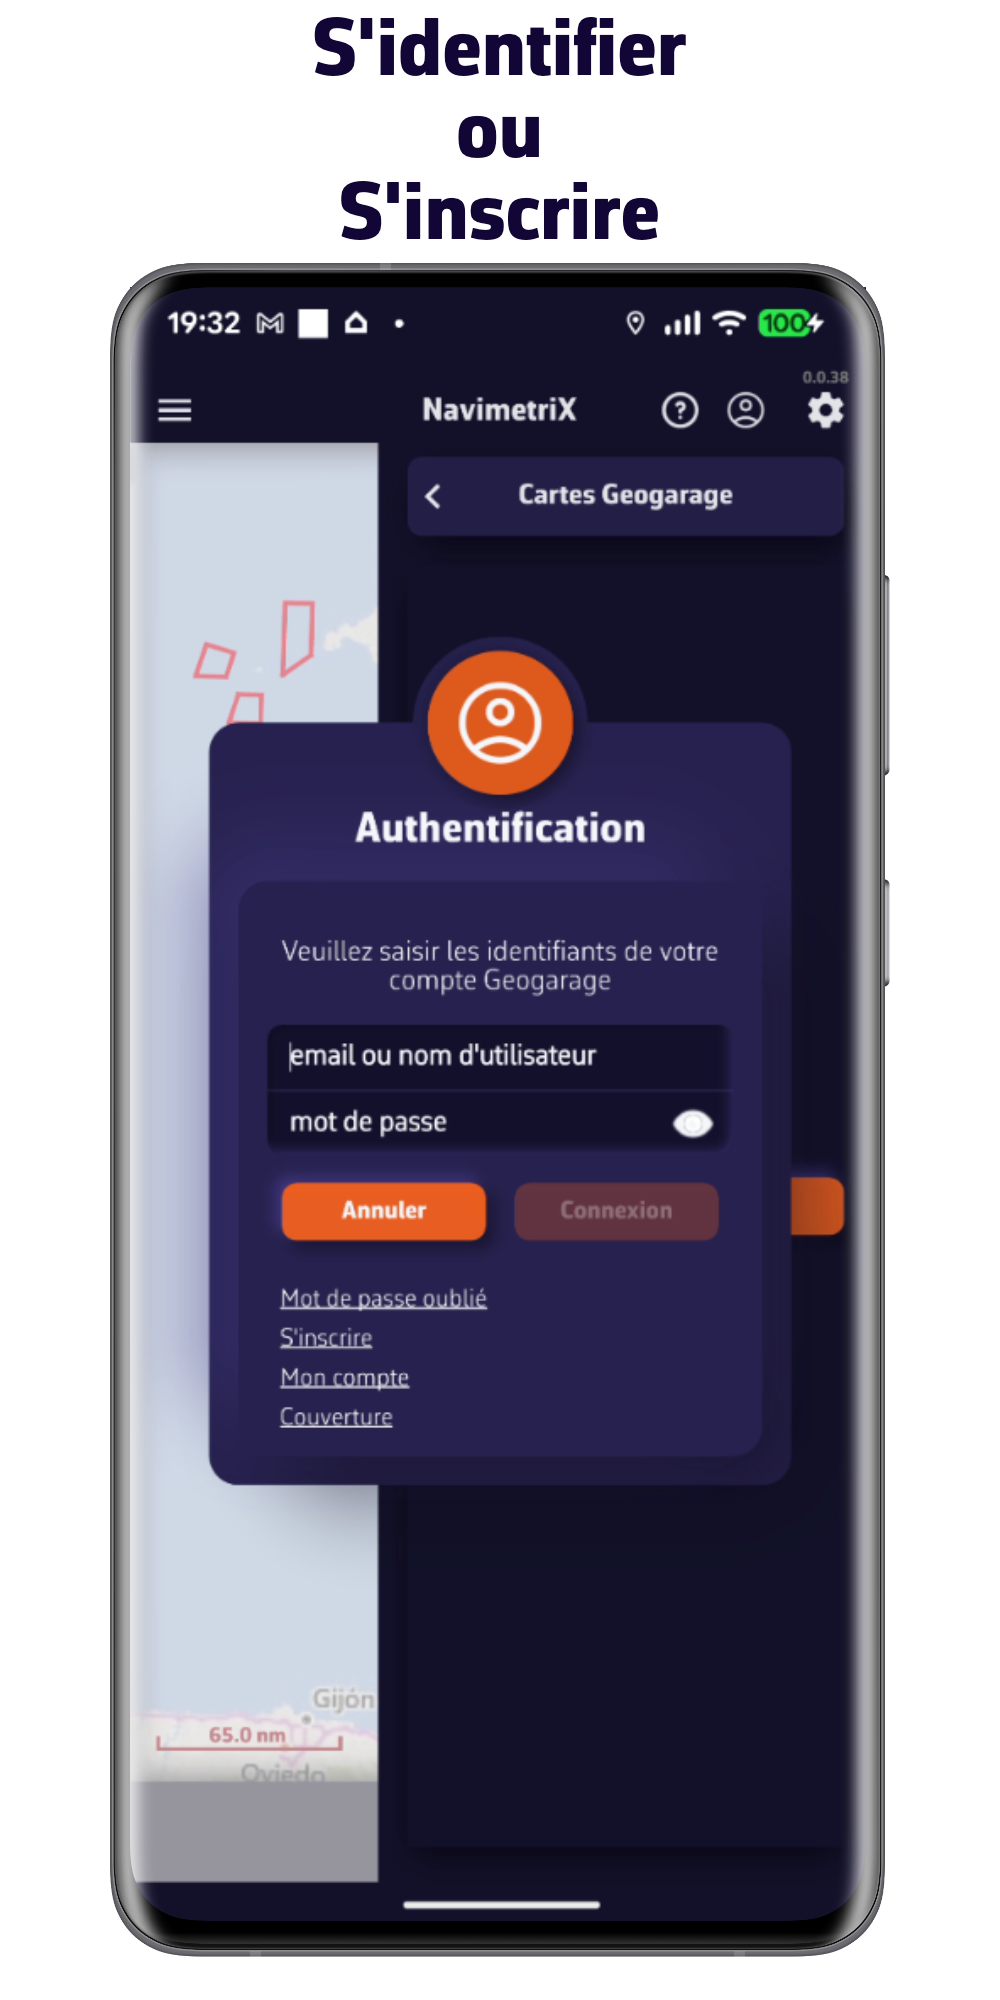
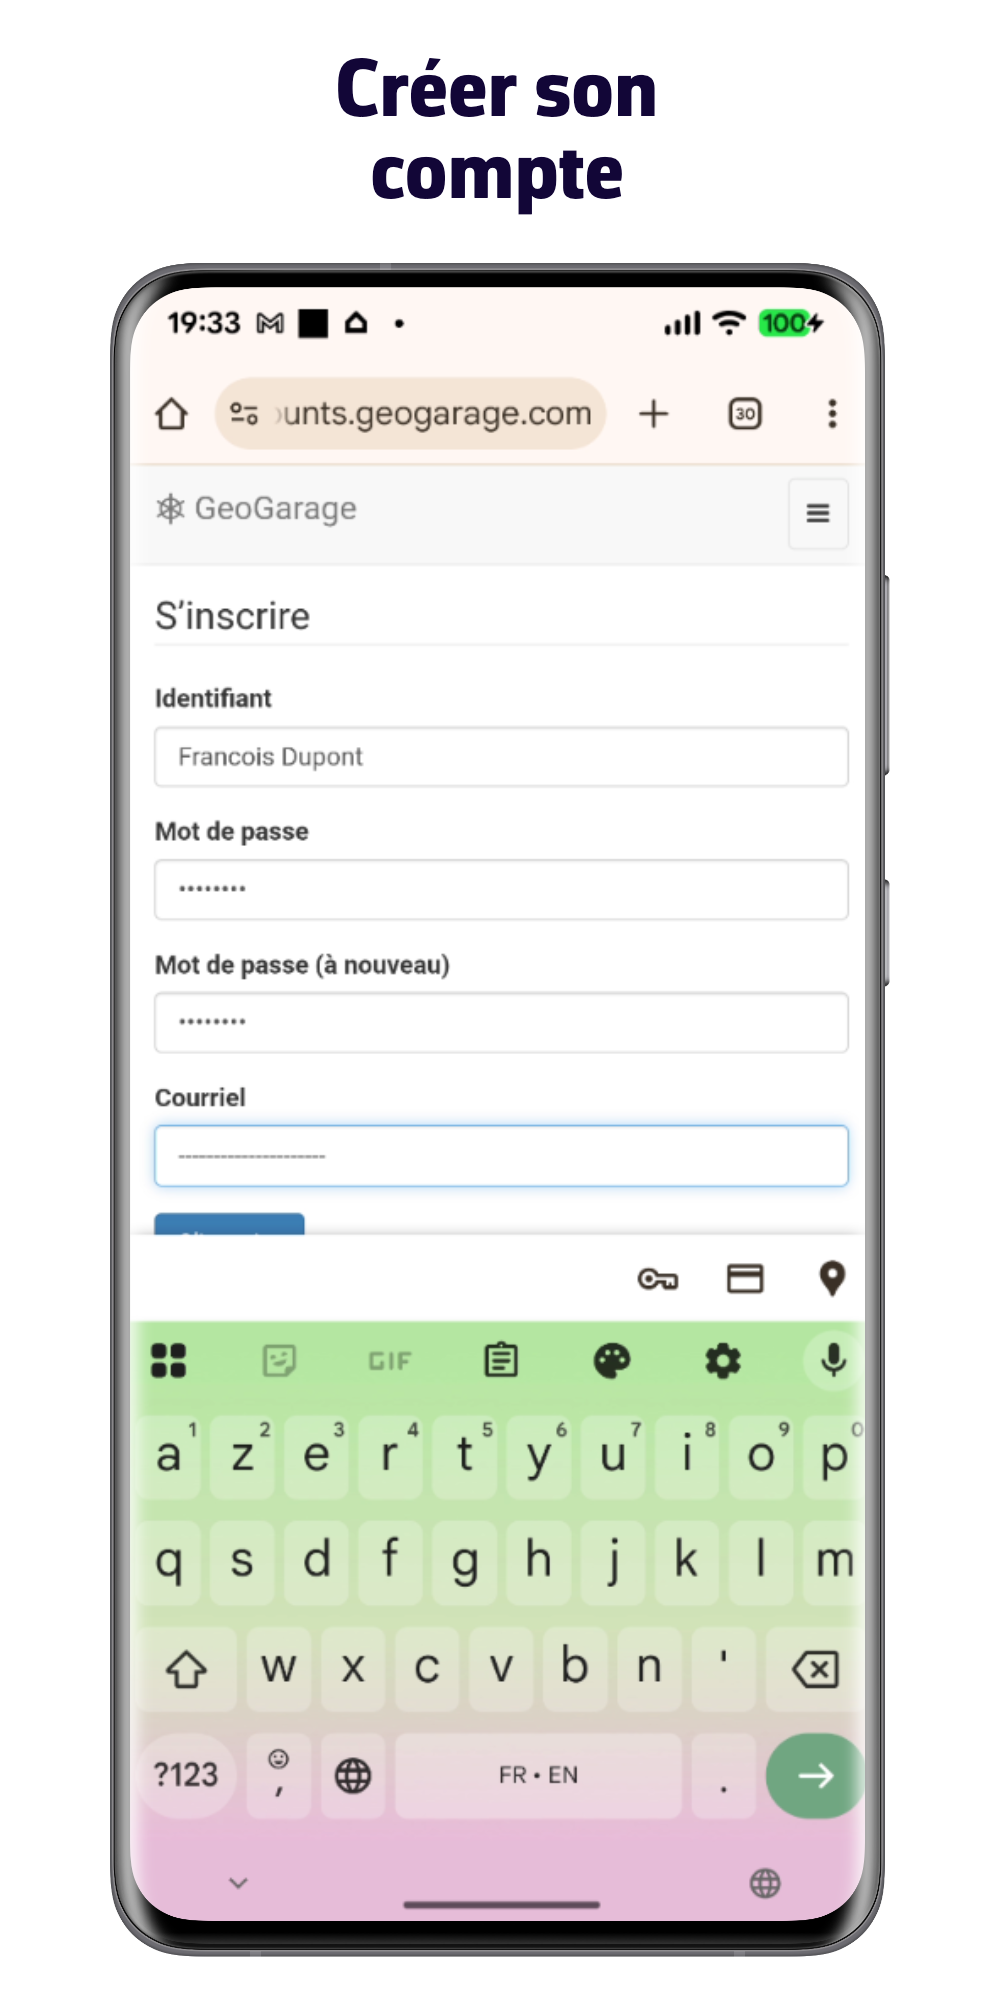
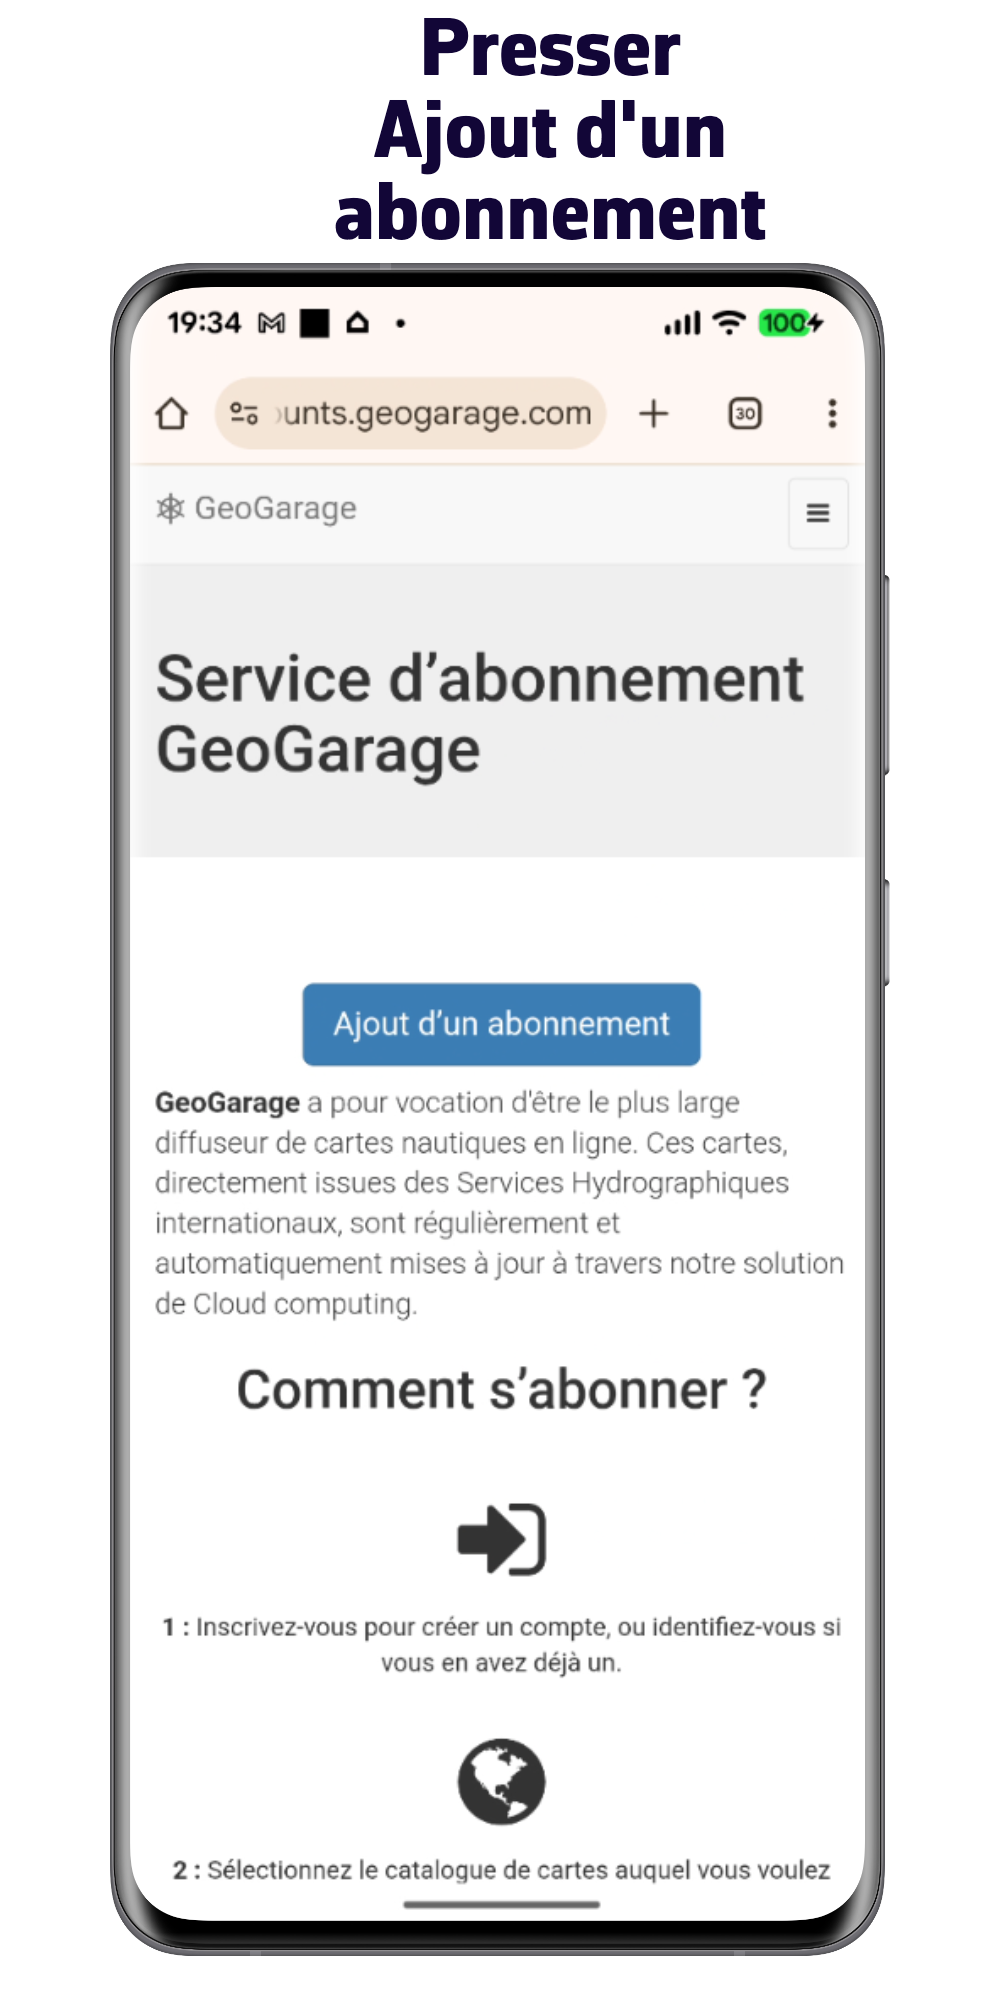
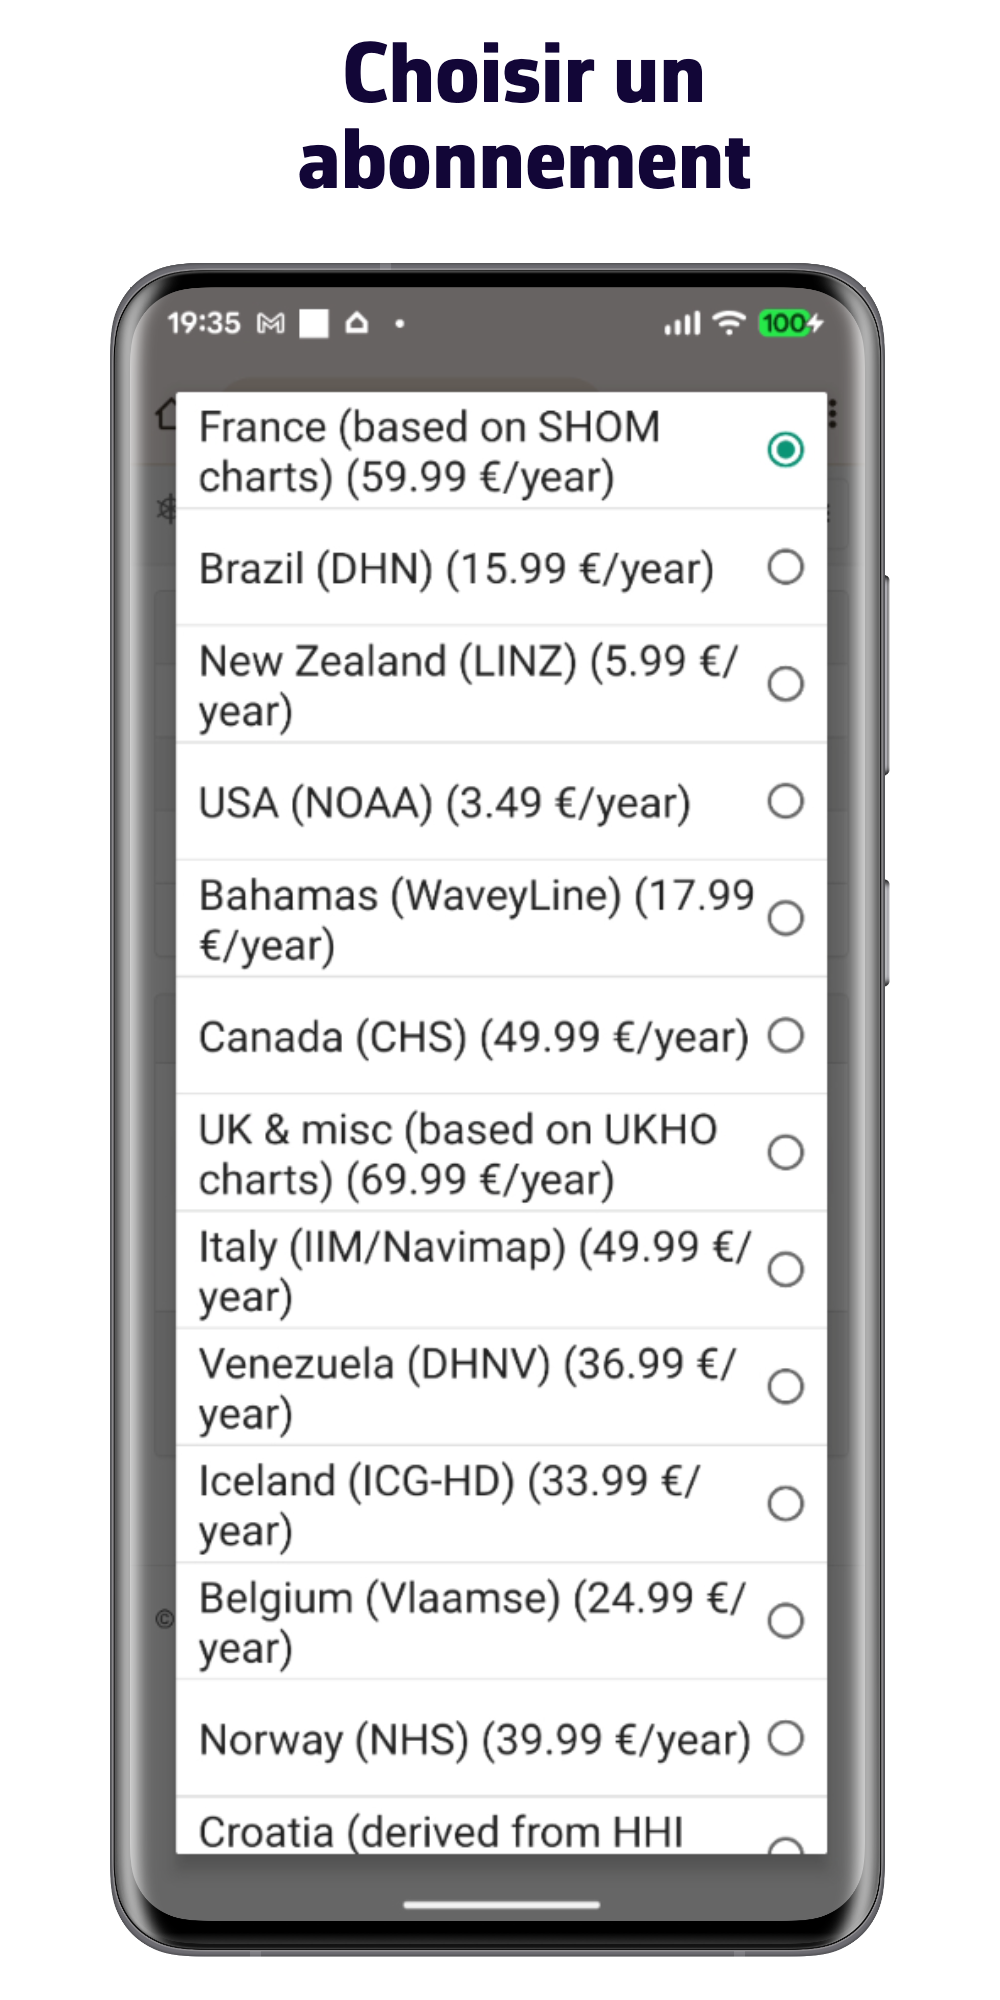
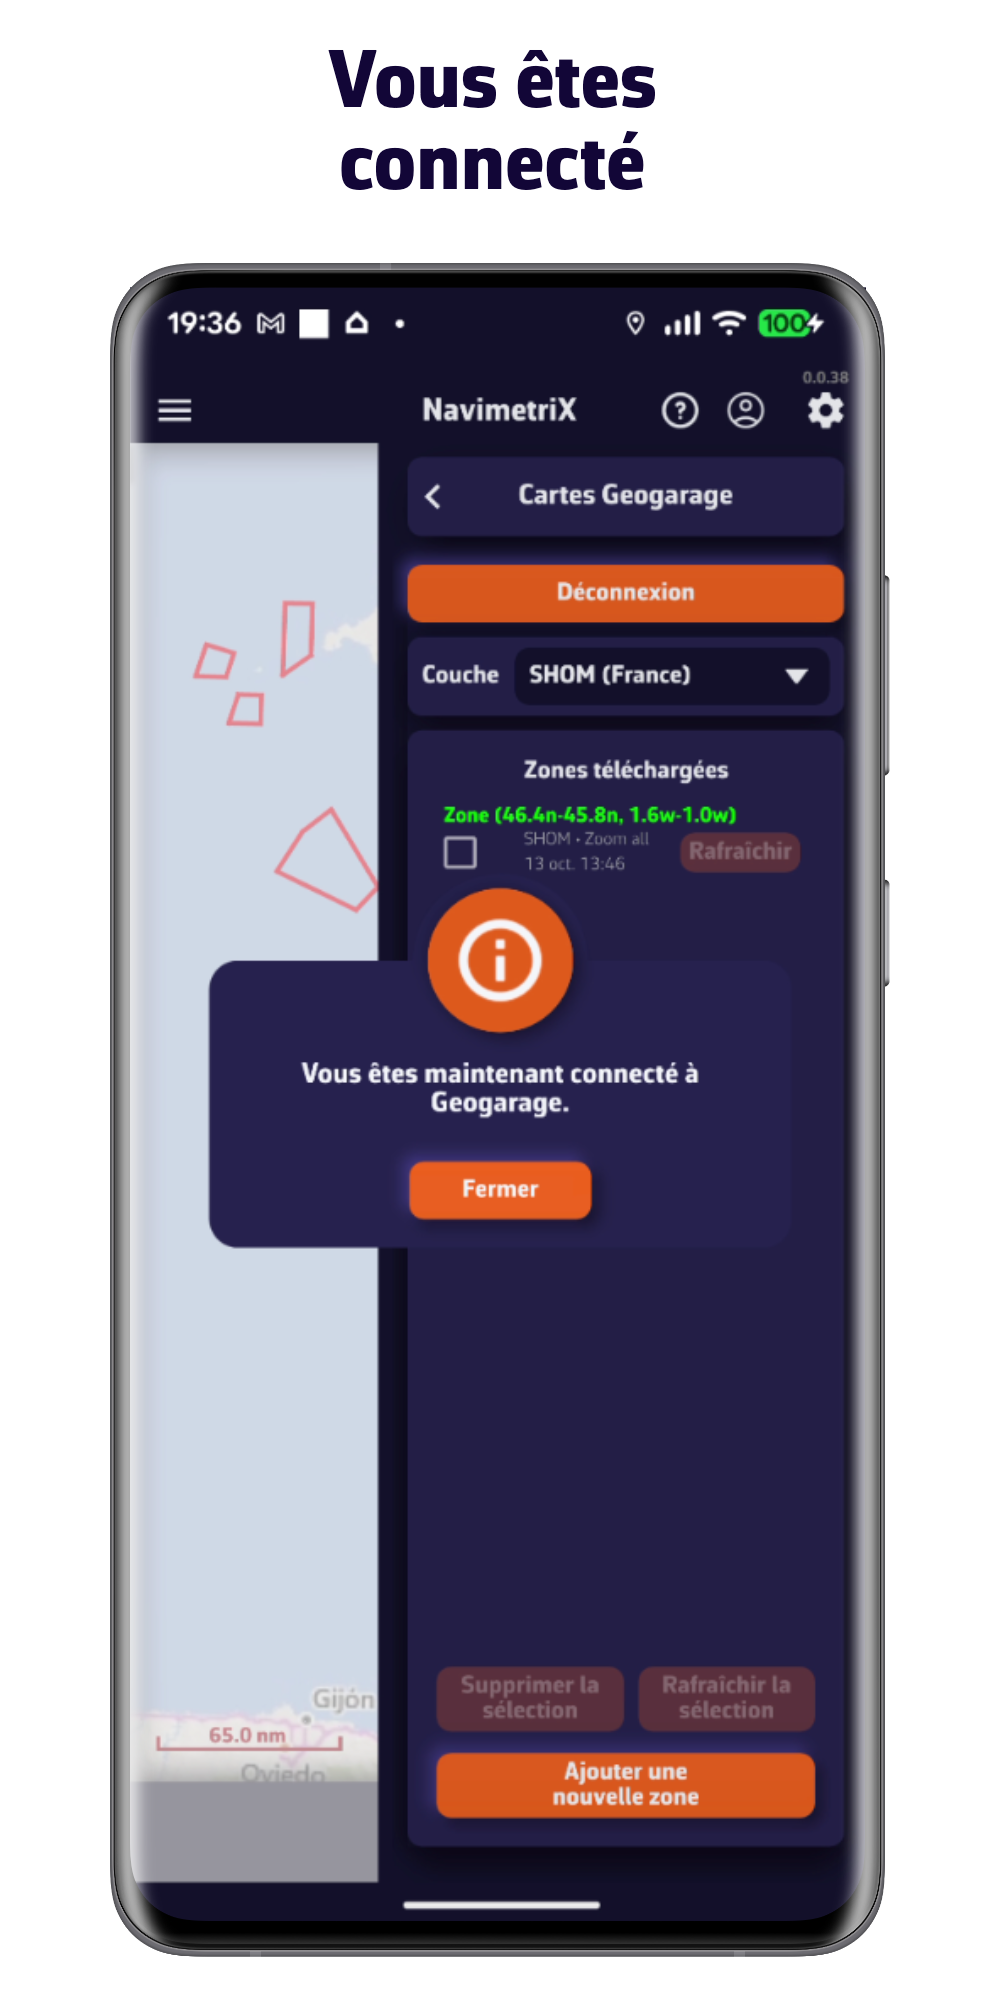
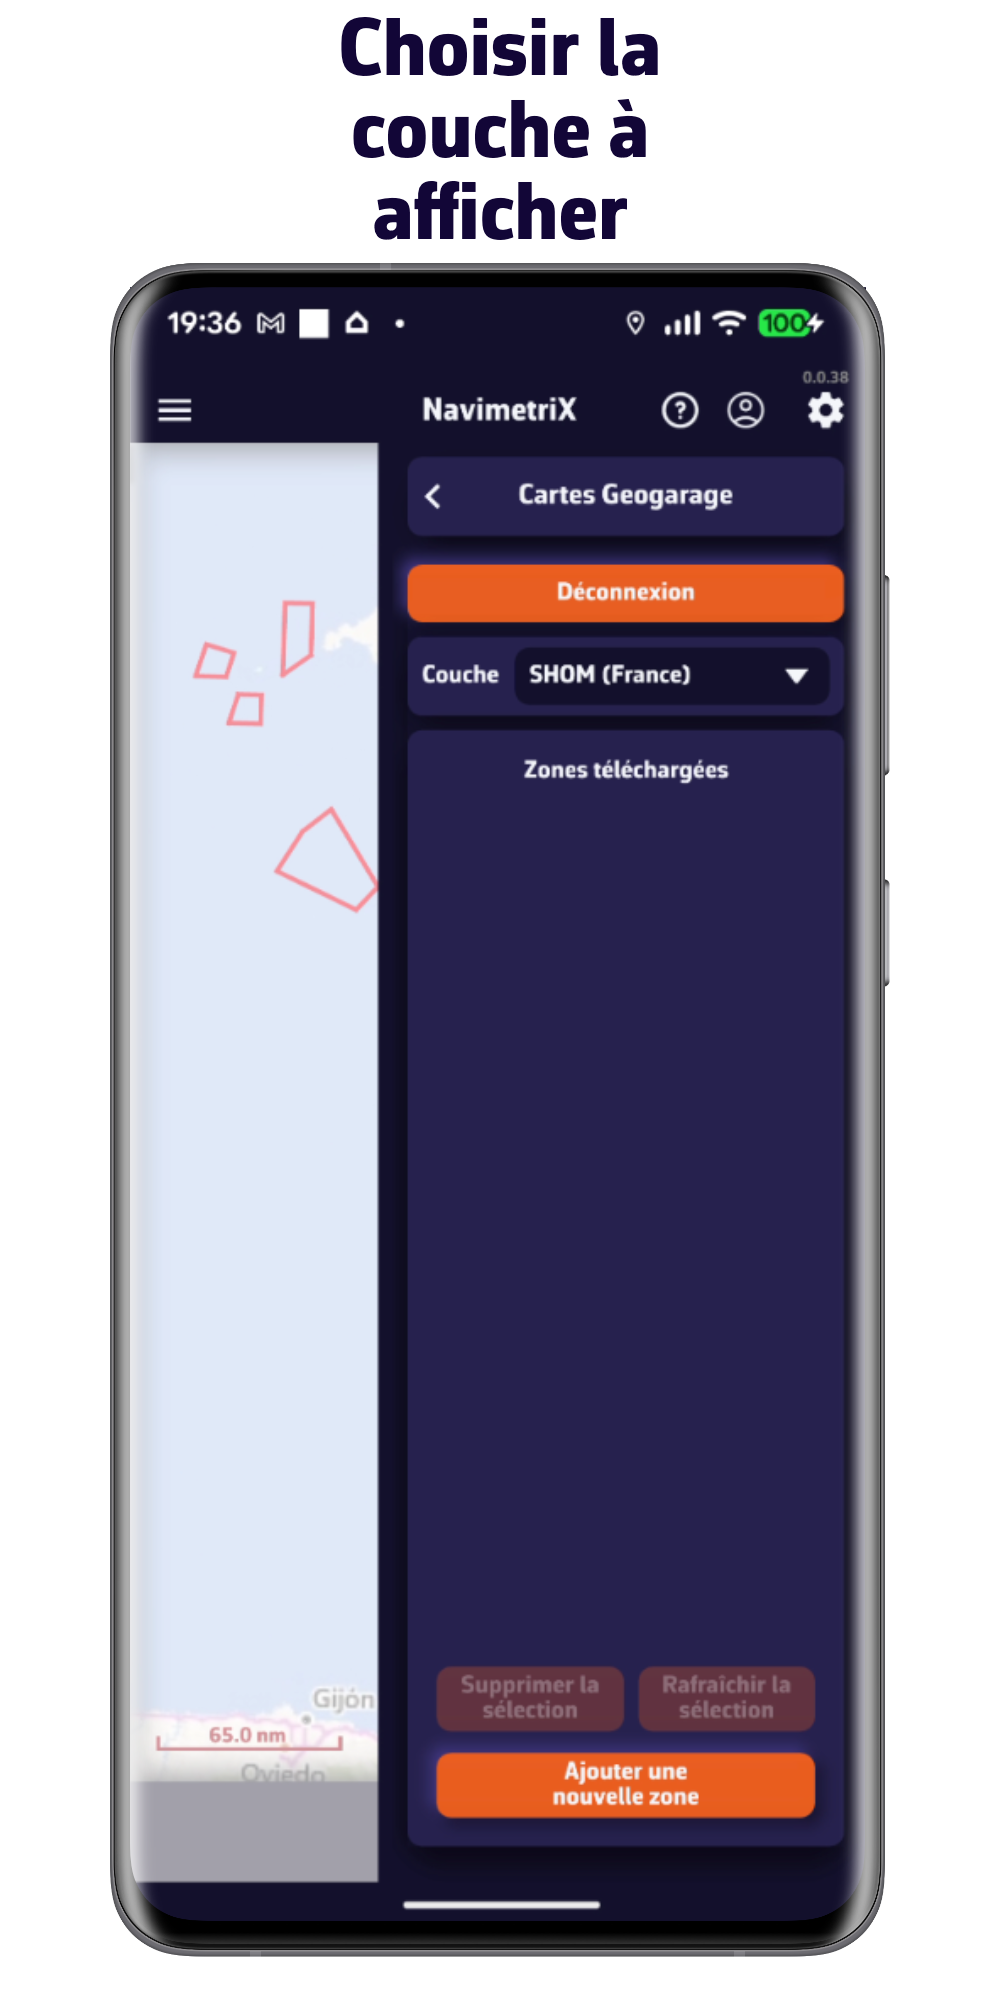
Prise en main de l'application

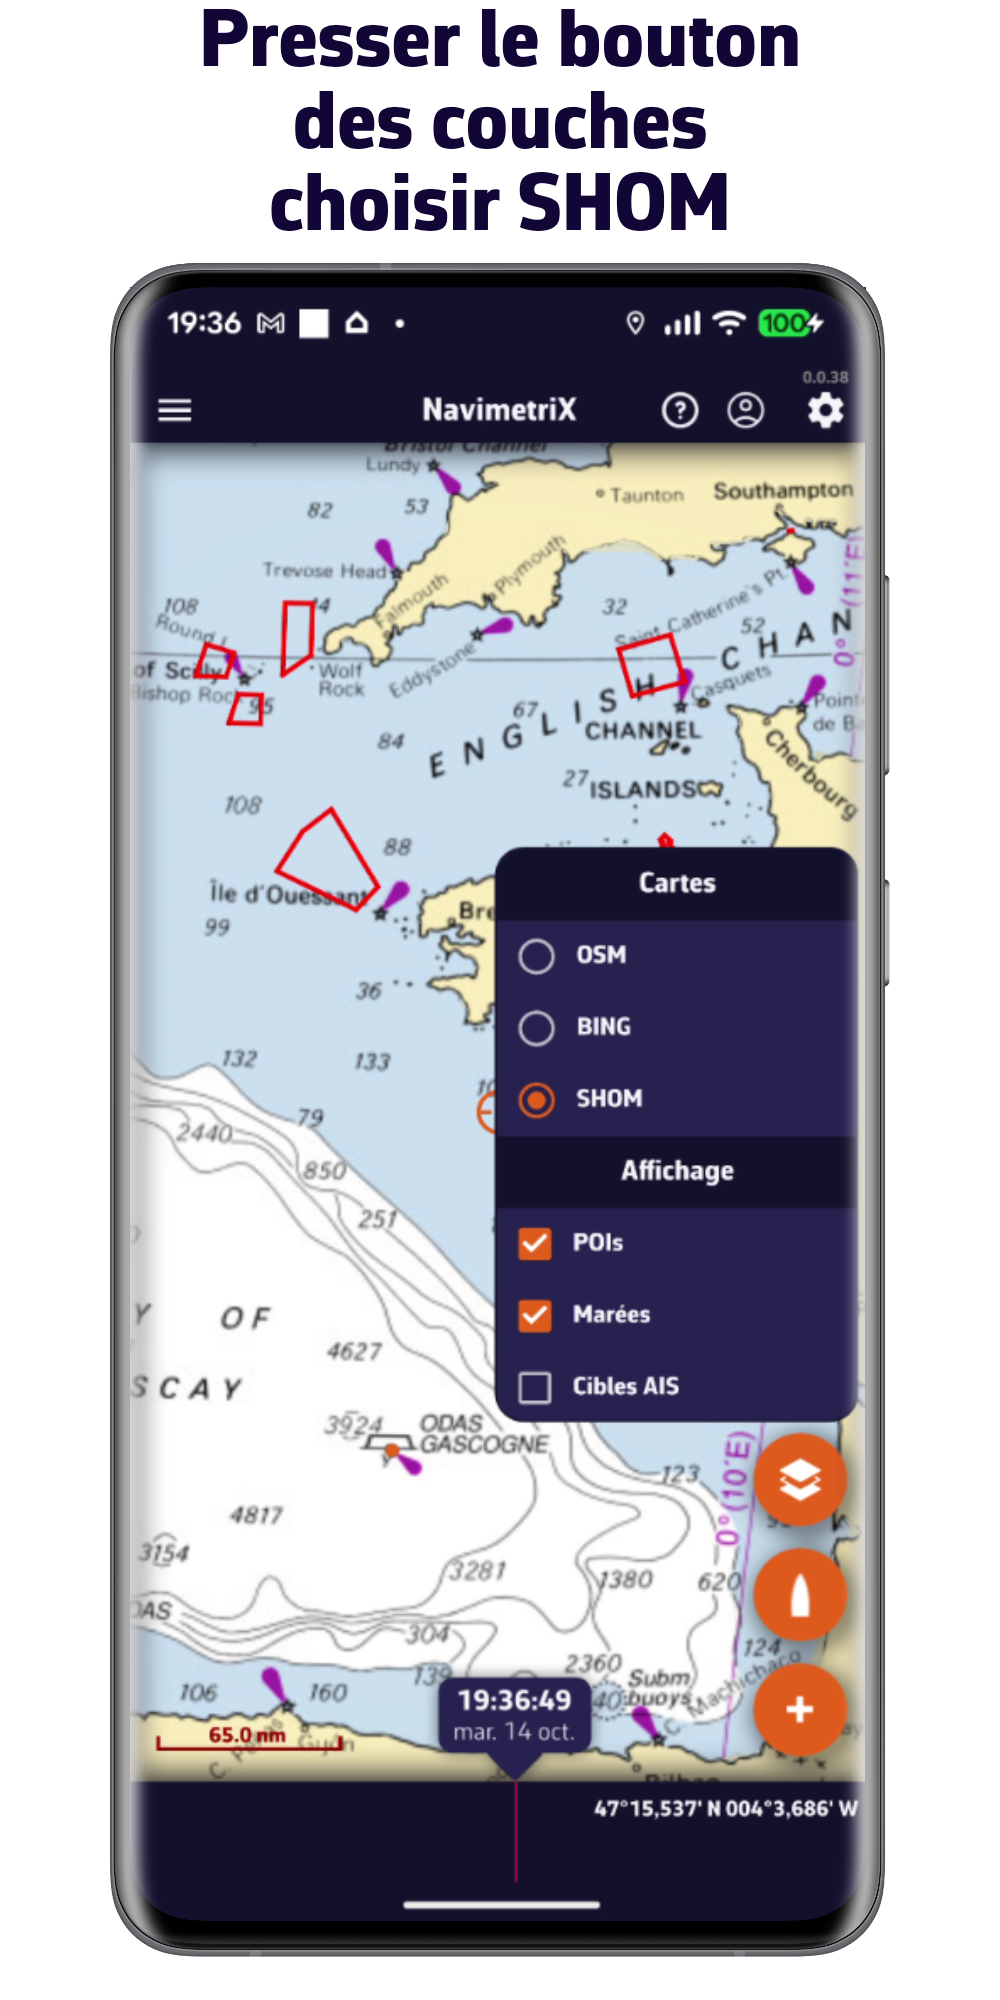
1/ Naviguer avec le GPS de son téléphone ou de sa tablette
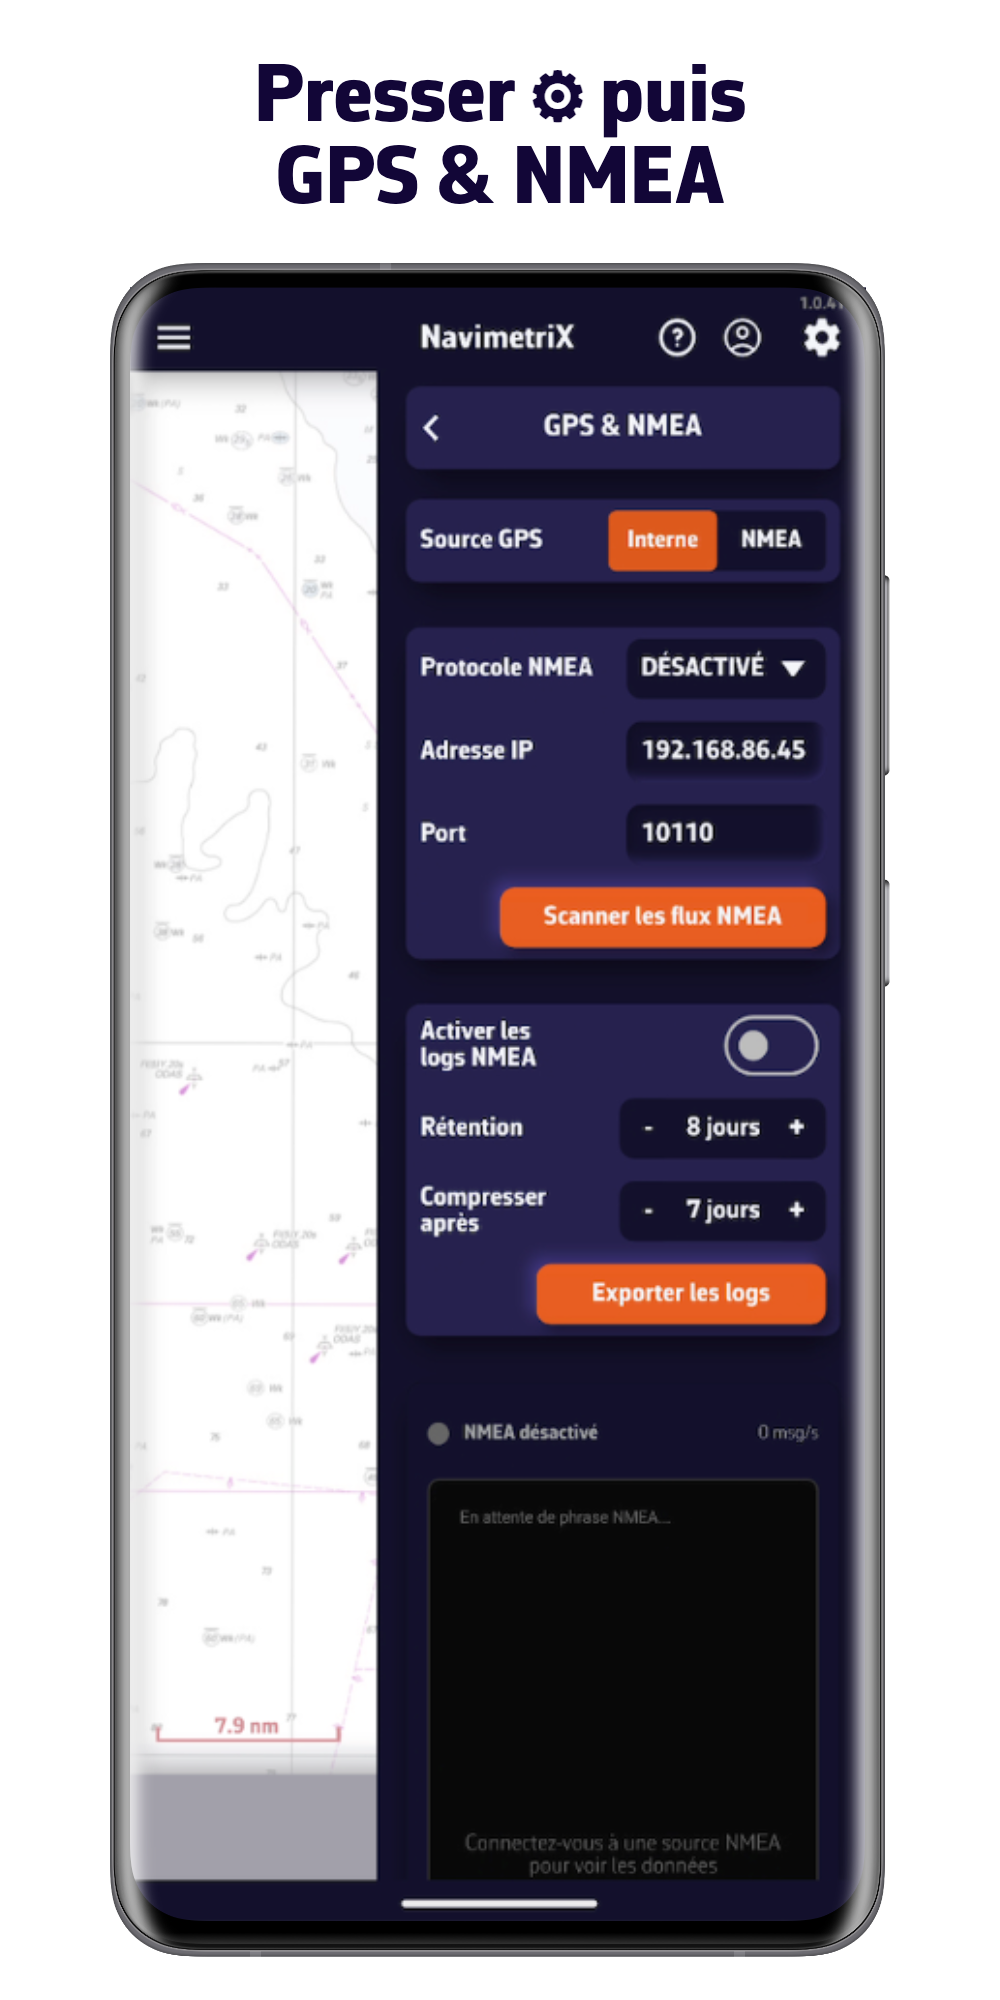

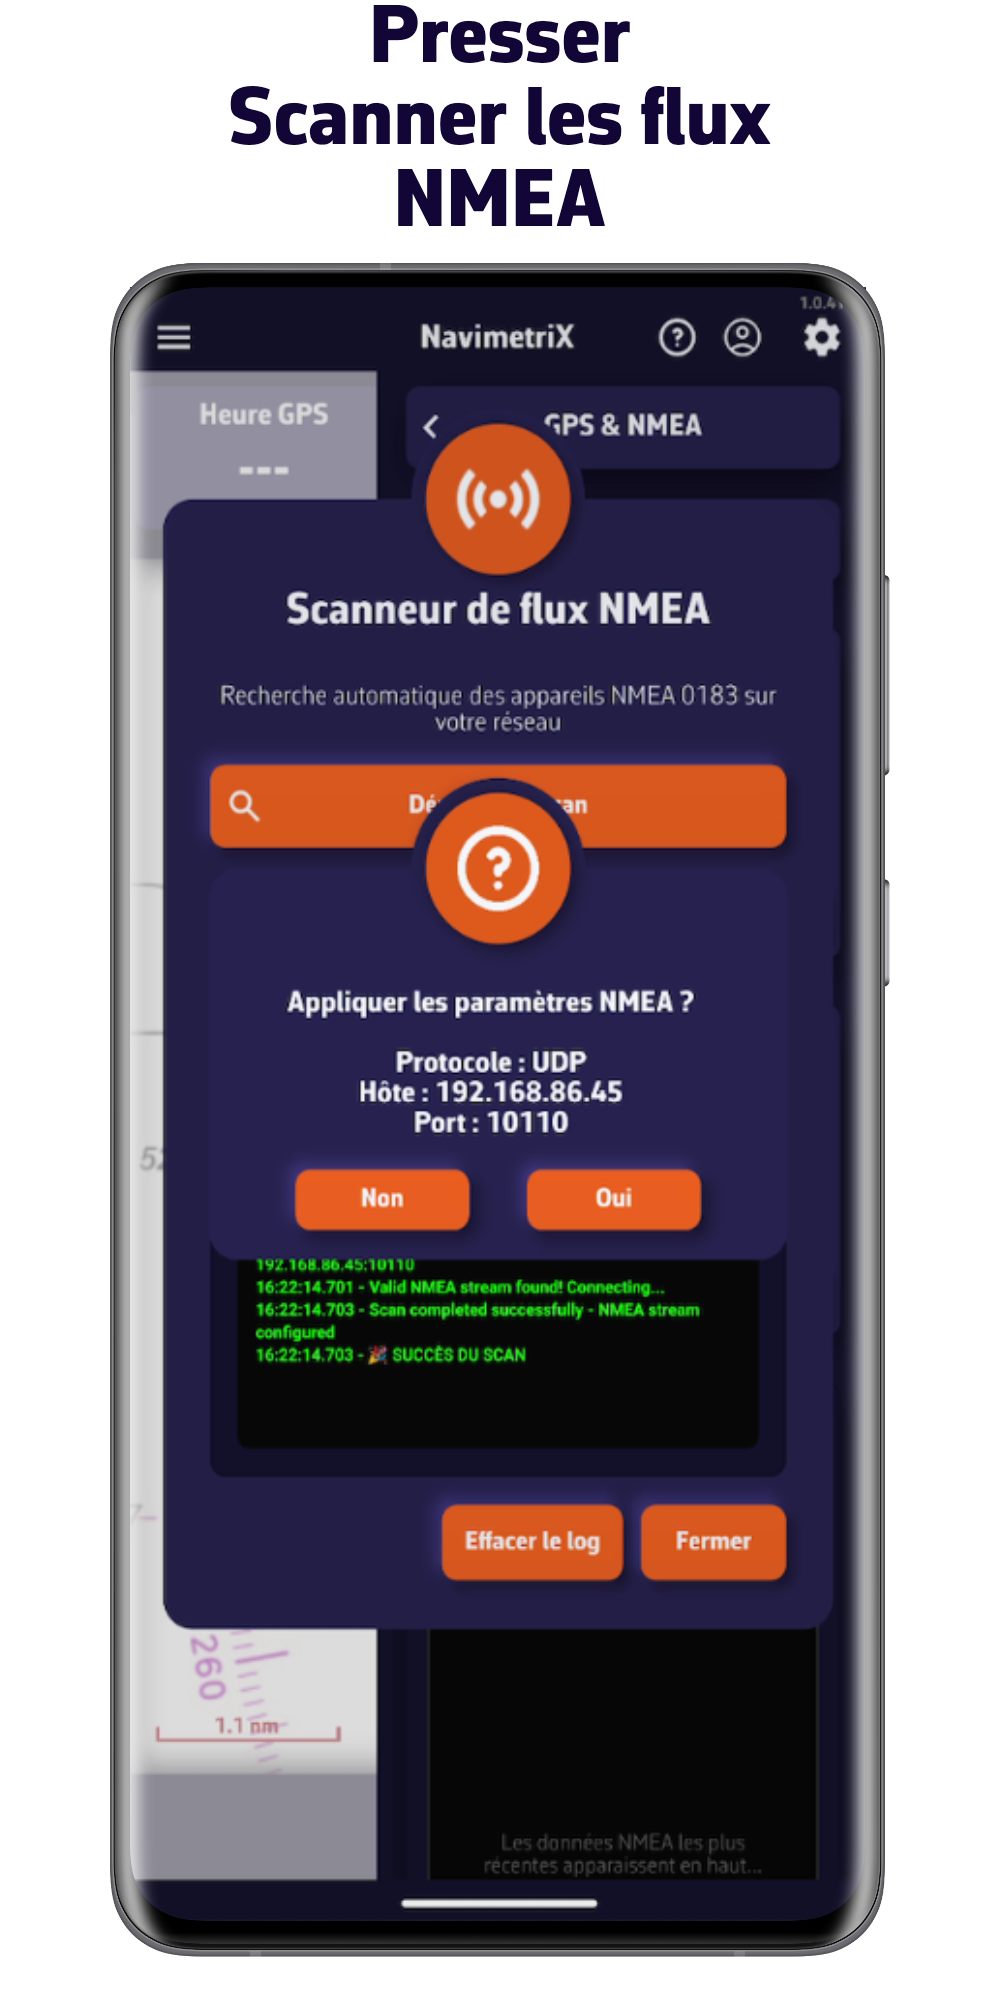
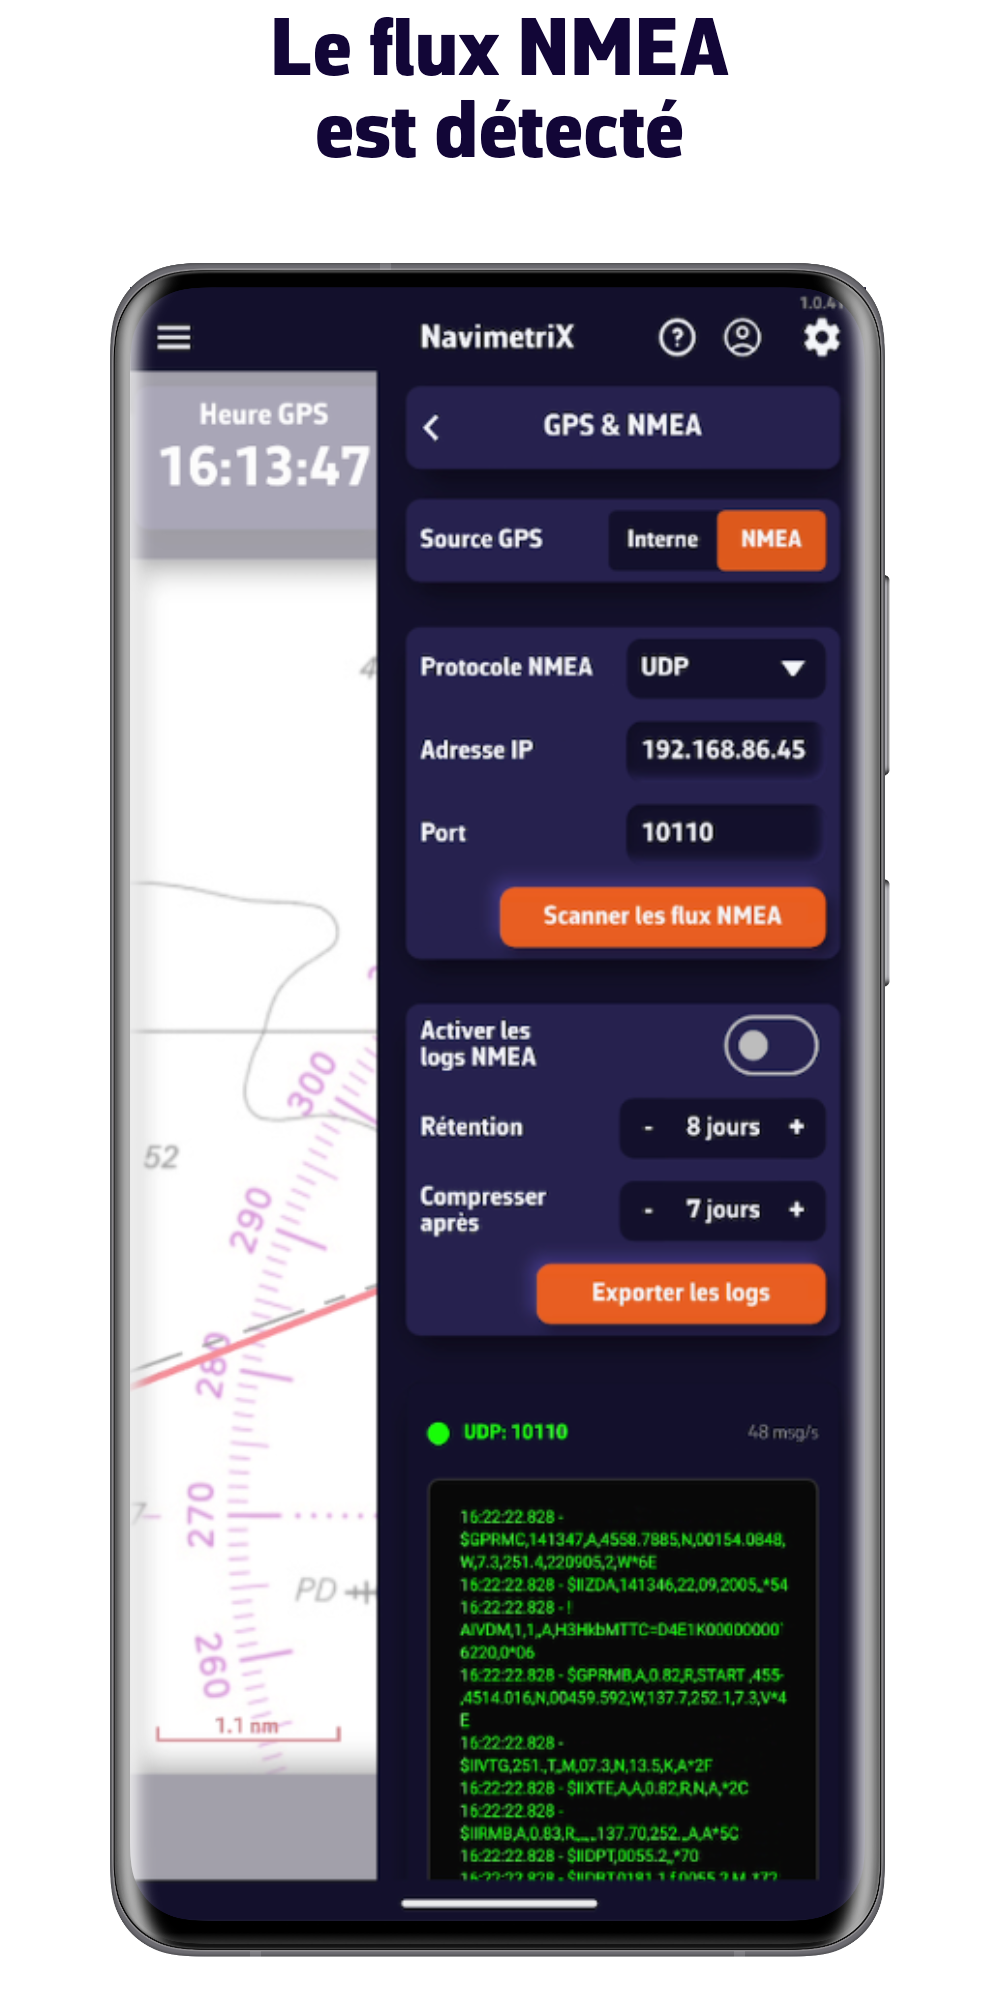
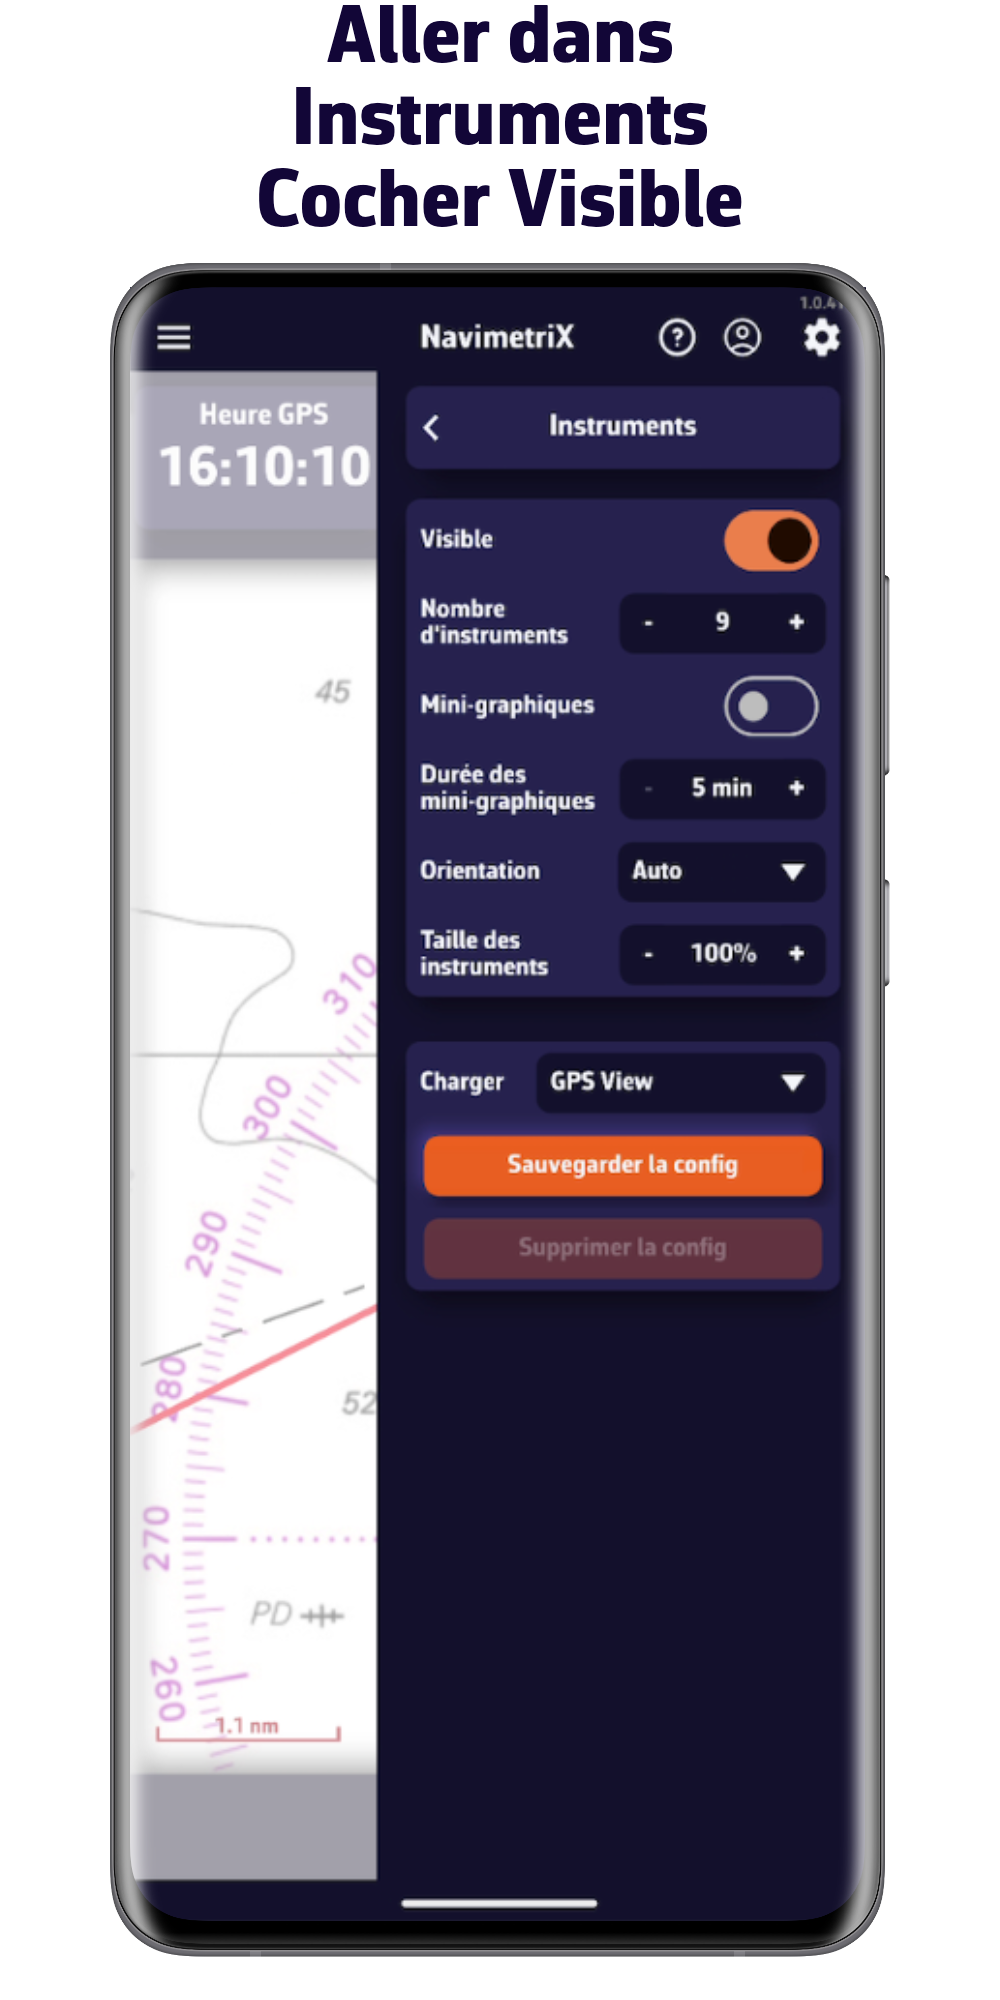
2/ Naviguer avec les données NMEA de la centrale du bord
Important : Assurez-vous d'être connecté au réseau WiFi sur lequel les données NMEA 0183 sont publiées.
Téléchargez l'application

V1.13.91

V1.13.91

V1.13.91

V1.13.91

V1.12.88

V1.12.88