What do the icons displayed on the chart represent?
- Francis
- octobre 17, 2025
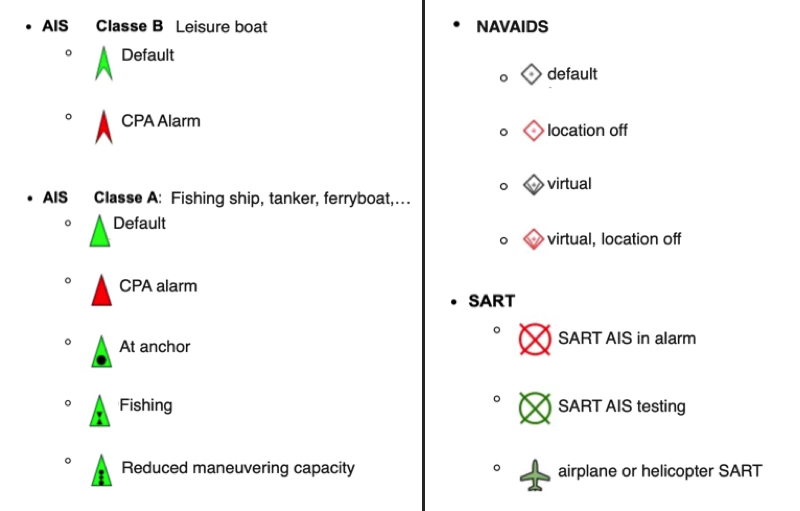
You can display several types of icons on the chart: AIS targets, navigation aids (NavAids), SART (Search And Rescue) distress beacons, AIS targets via the Internet (1st quarter of 2026), and “in-situ” weather data stations.
AIS Targets, NavAids, SART
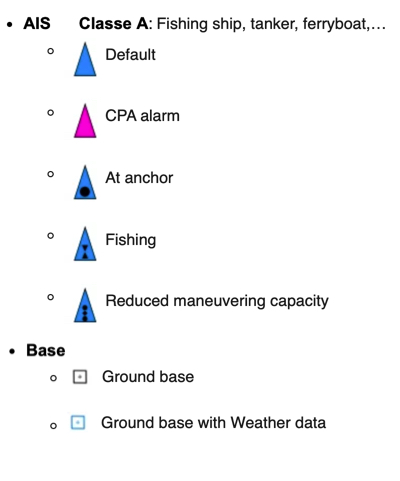
AIS Target from Internet (Q1-2026)
Weather station ‘in-situ’
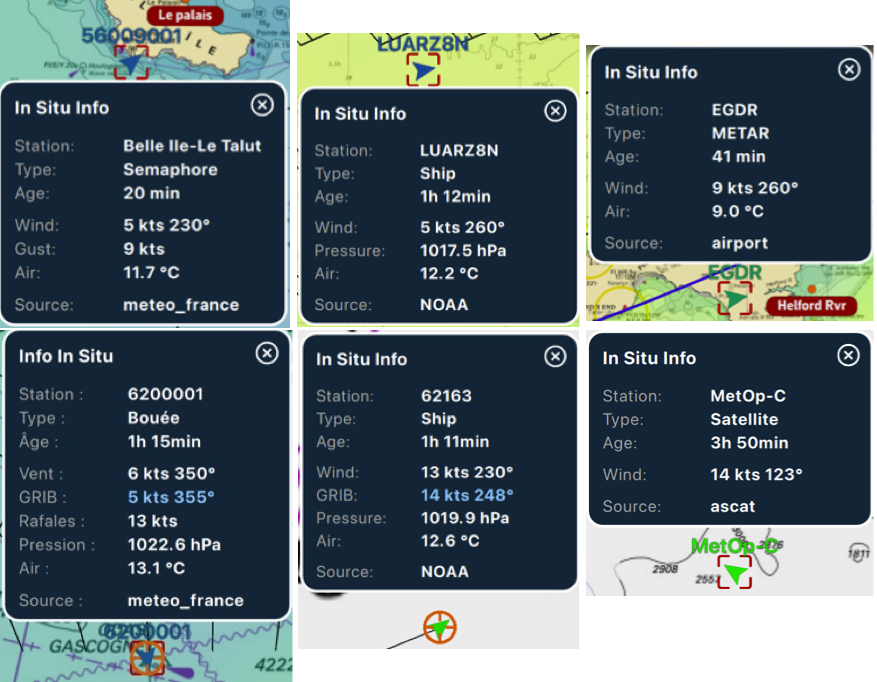
The symbol takes on the orientation and color scheme of the wind display.
If the time of the information falls within the coverage period of the GRIB file displayed, then tapping/clicking in the center of the popup centers the chart on the station’s coordinates and returns the timeline to the exact time of the station, allowing you to compare the data value and the GRIB file forecast.