How to display routing tracking data?
- Francis
- décembre 12, 2025
You can display simulated navigation data all along the routing.
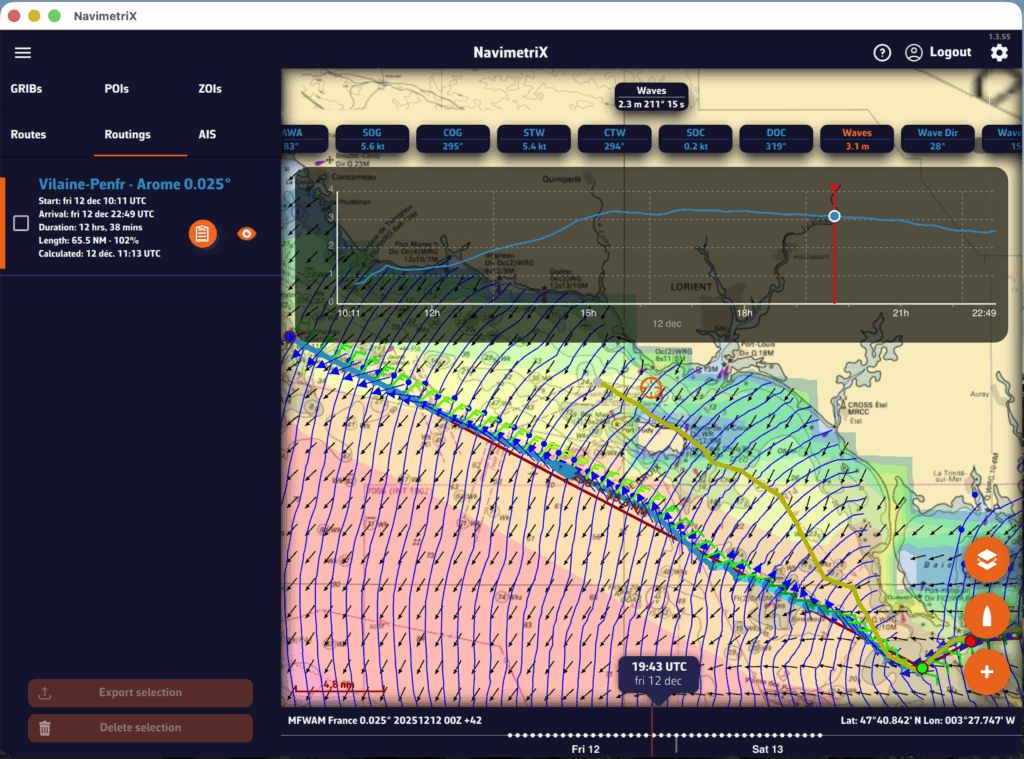
When isochrones are displayed, data labels in the same colour as the routing boat allow you to track progress along the route. In addition, clicking/tapping on each label displays the data graph from the start to the end of the route.
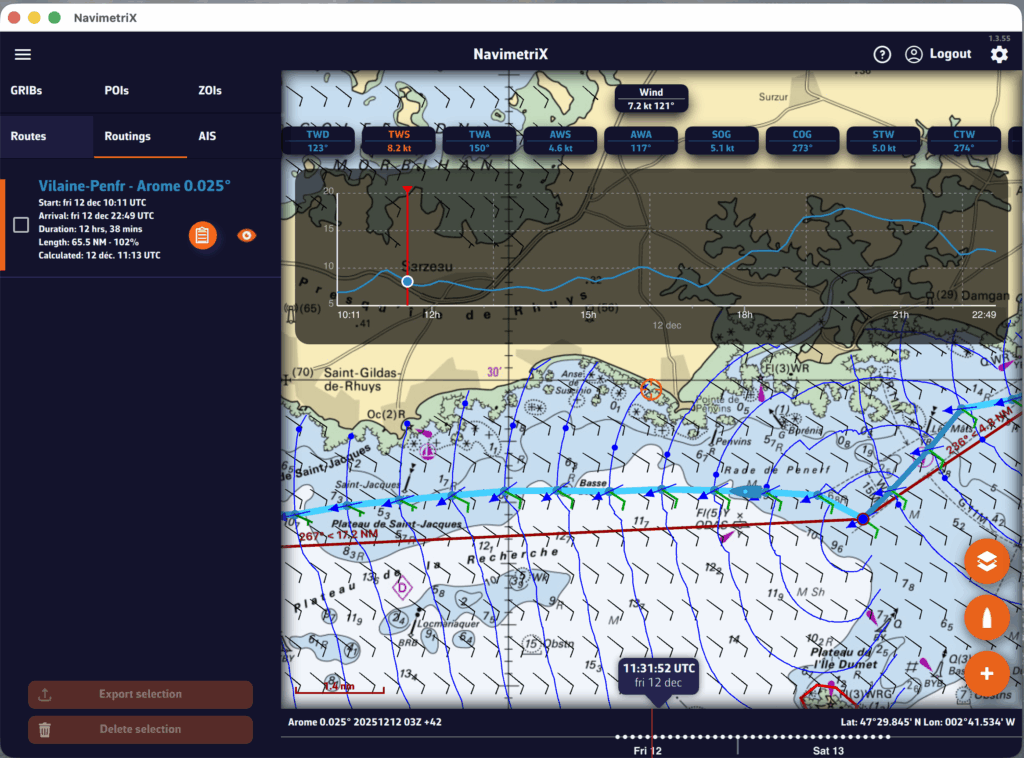
To scroll the boat along the route, a weather model must be displayed to activate the timeline.
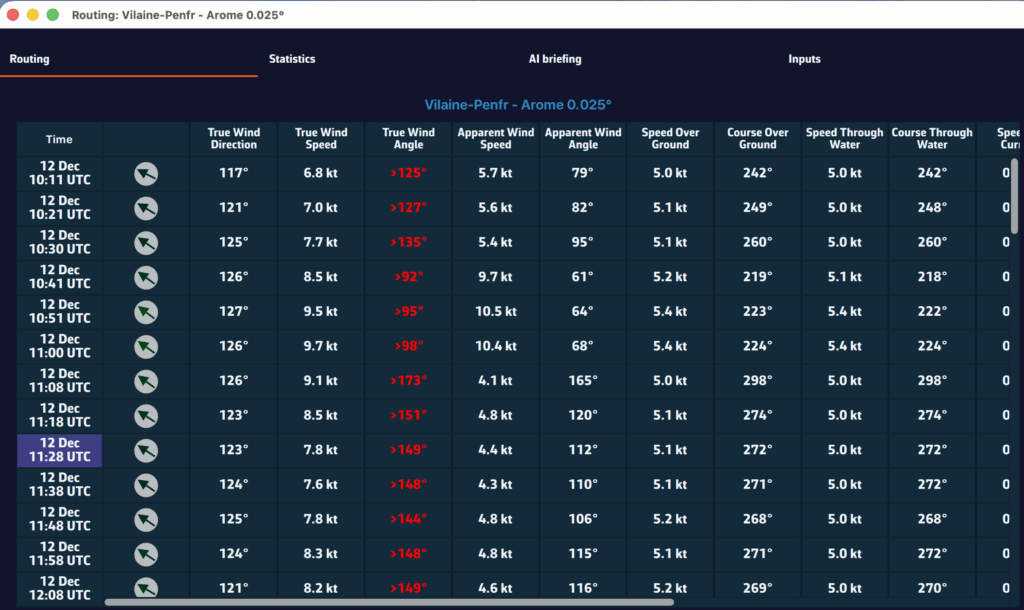
A routing table is generated automatically and appears as an icon next to the route. Simply tap/click on the icon to display it.