Can you describe the user interface?
- Henri
- octobre 15, 2025
The NavimetriX interface has been designed to be clear, intuitive, and quick to use, whether on a computer, tablet, or smartphone. Here is a complete description, section by section:
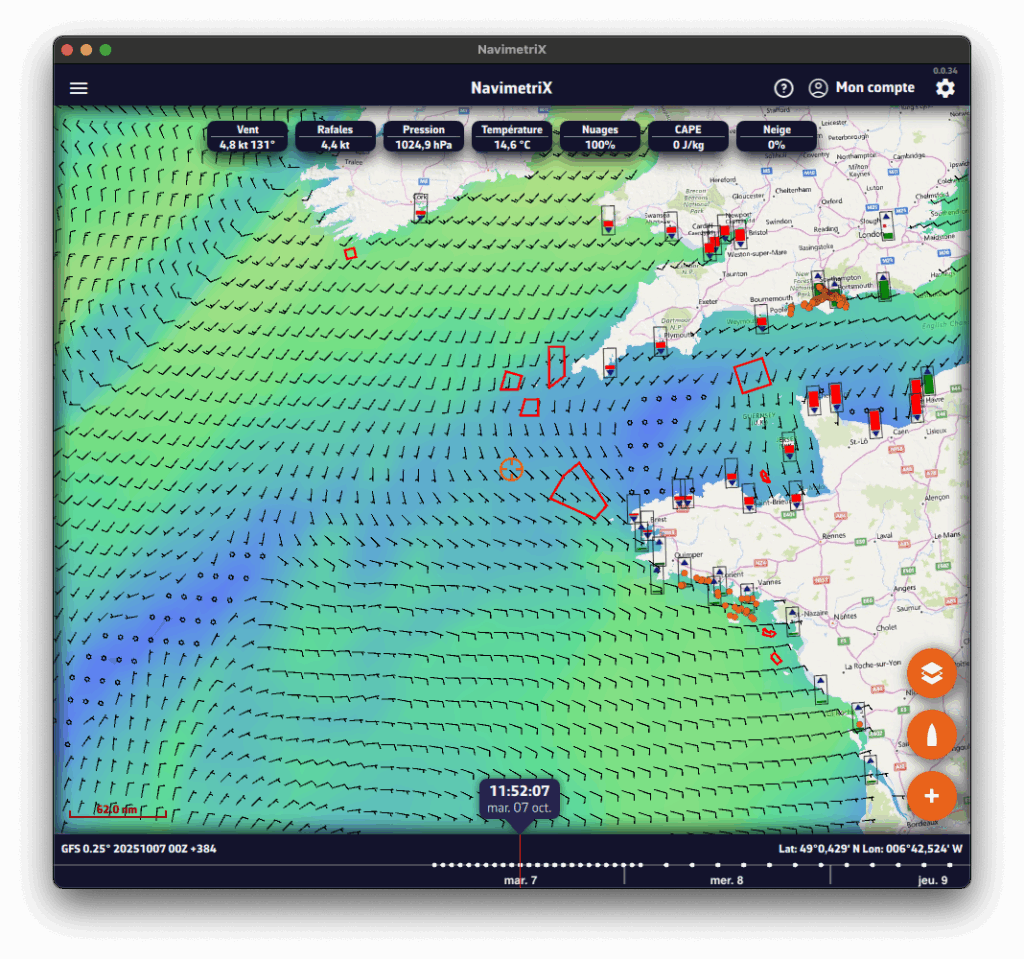
– Top right
-
- ⚙ Settings icon: opens the settings panel
- 👤Account icon: allows you to log in to your NavimetriX account, create an account, or reset your password.
-
- ? Help icon : Open the application’s website, in the Frequently Asked Questions or FAQs tab.
– Top left
☰ Hamburger menu: provides access to the application’s main lists:
-
- GRIB files
-
- Points of Interest (POI)
-
- Routes
-
- Routings
-
- AIS targets
– Bottom left
-
- Map scale
-
- GRIB file loaded, for example :
GFS 0.25° 20251007 00Z +384
-
- GFS model
-
- 0.25° grid, approximately 26 km
-
- published by NOAA on October 7, 2025
-
- Calculated at midnight UTC, we refer to the 0-hour run or 00Z.
-
- containing 384 hours from the 00Z run. If you see +36, this indicates that the first 36 hours of this GRIB file are from the 00Z run, while the following hours are from the previous run, which was the 18Z run on October 6. This gives you access to the latest data from the run without having to wait for the entire run to be calculated. For the GFS, this saves about 3 hours.
-
- GRIB file loaded, for example :
– Below: the Timeline
-
- Displays all hours covered by the currently loaded GRIB file.
-
- Each white dot on the time bar corresponds to a time step in the GRIB file.
-
- The time displayed just above indicates the current position of the Timeline.
-
- If you click/tap on this time, the Timeline will jump to “now” and the seconds will scroll by (letting you know that you are at the current time).
-
- You can:
-
- Slide the Timeline with your finger or mouse,
-
- Click/tap on a location to move directly to a specific time.
-
- You can:
-
- The data in the GRIB file displayed is then that for the selected time.
-
- If a routing is displayed, the boat moves at the selected time along its trajectory.
-
- At the bottom right, the coordinates of the target in the center of the screen are displayed.
– Bottom right: the three orange circular buttons
-
- Action Button (+)
-
- Download a GRIB file,
-
- Add a POI,
-
- Create a route,
-
- Calculate a routing.
-
- Action Button (+)
-
- Boat Button
-
- Centers the map on the boat’s position.
-
- Long press : automatically centers and zooms in for a closer view—ideal for navigation.
-
- Boat Button
-
- Layers button
-
- Chart section :Allows you to choose the type of chart displayed:
-
- OpenStreetMap (par défaut)
-
- Bing Satellite
-
- Nautical charts, if available.
-
- Chart section :Allows you to choose the type of chart displayed:
-
- GRIB Display section
-
- Allows you to choose which weather parameters to display:
-
- Background color,
-
- Wind barbs,
-
- Additional data depending on the loaded model.
-
- Allows you to choose which weather parameters to display:
-
- GRIB Display section
-
- Display Section
-
- Allows you to enable or disable the display of :
-
- POI,
-
- Tracks,
-
- Tides,
-
- AIS targets.
-
- Allows you to enable or disable the display of :
-
- Display Section
-
- Layers button
– On the map
-
- Target in the center of the screen.
-
- Orange if at sea
-
- Blue if on the ground
The target’s coordinates are displayed at the bottom right.
- Blue if on the ground
-
- Target in the center of the screen.
-
- Data from the GRIB file at the target at the time of the time bar
-
- Tide icons around the world
-
- Red : ebb tide.
-
- Green : rising tide.
Clicking on an icon opens the tide details with the times and heights calculated directly in the application.
- Green : rising tide.
-
- Tide icons around the world
-
- No-go zones
-
- red polygons
such as traffic separation schemes or offshore wind farm areas
- red polygons
-
- No-go zones
-
- Points of Interest (POIs)
-
- in orange
-
- Points of Interest (POIs)