Weather charts (Charts tab)
ExpertThe essentials
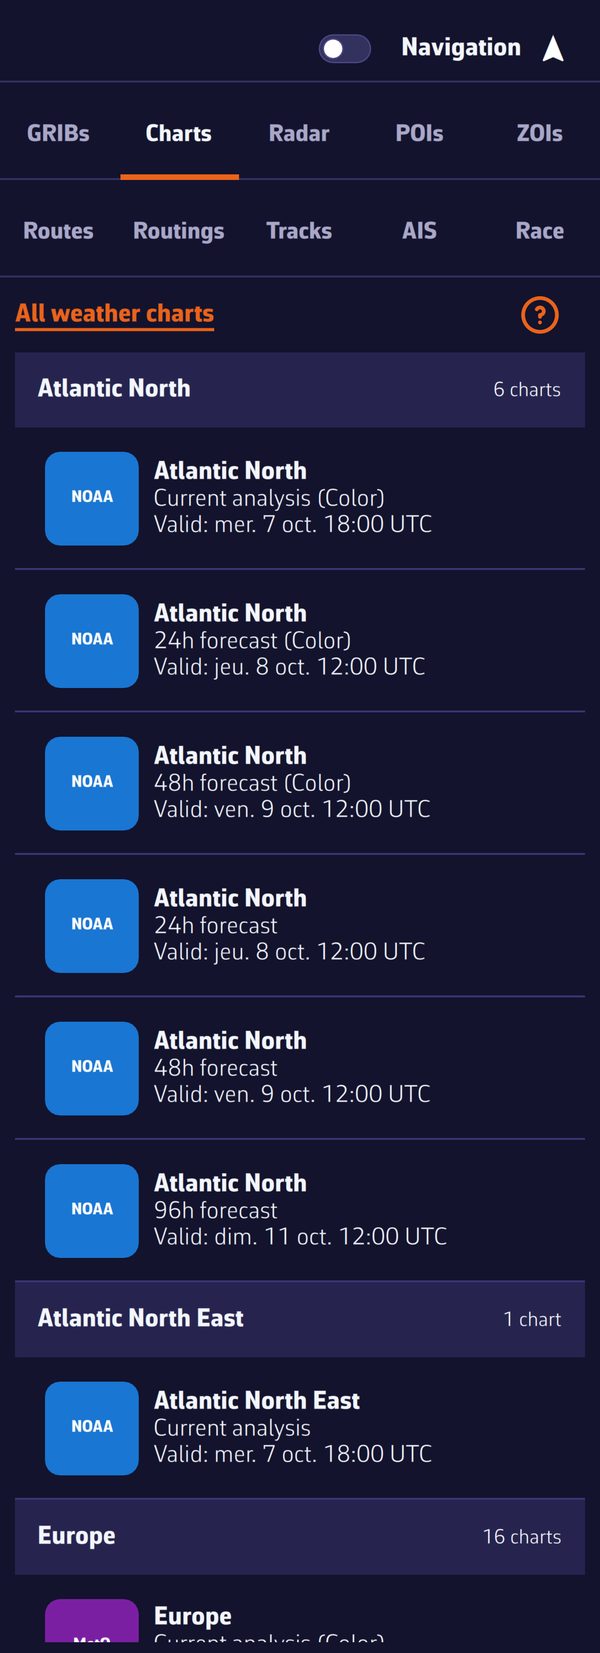 The Charts tab of the left drawer
Surface weather charts (also called isobaric charts or front charts) are drawn by forecasters at the major weather services: pressure centers, isobars, fronts, gale warnings. They complement GRIB files, which are computed without human intervention, and help you understand the situation. NavimetriX gathers them in the “Charts” tab of the left drawer.
- Open the left drawer with the chevron handle (›) at the left edge of the screen, then the “Charts” tab.
- The list only shows the charts that cover the center of the map: move the map to see those of another region.
- Tap a chart: it is laid over the nautical chart, in its place, or opens as an image depending on its format.
- Tap it again to remove it.
Do not confuse the “Charts” tab of the left drawer (weather charts) with the “Maps” section of the layers menu, which chooses the base map.
Going further
The charts offered
The list is served by our servers and updated every hour. In October 2026, it includes charts from NOAA (Atlantic, Pacific, Panama), the Met Office (Europe and North-East Atlantic), the BOM (Australia, Indian Ocean, South Pacific), the Marinha do Brasil (South Atlantic), and a sargassum density chart from USF (tropical Atlantic). The forecast ranges of each series are detailed in the FAQ.
The “All weather charts” link at the top of the tab opens the complete list on our website, and the “?” button the corresponding FAQ page.
The list follows the map
A chart only appears in the list if the center of the view is within its area. The list updates when you move the map, and sorts the charts by area, with their number. If none covers the center of the view, the tab shows “No charts available for current view”.
Each row shows:
- the source, abbreviated, on a colored badge;
- the area, in English;
- “Current analysis” or “24h forecast” (for example), with the mention “(Color)” for color charts;
- “Valid:” followed by the date and time of validity, in UTC. The ⚠ symbol and an alert color flag an outdated chart: an analysis more than 24 hours old, or a forecast whose validity time has been exceeded by more than its lead time (by more than 24 hours for a “24h forecast”).
On the map or as an image
- Charts in Mercator projection (NOAA, Marinha do Brasil, USF sargassum) are laid over the nautical chart, in their place, with the white background made transparent. If the center of the screen is outside their area, the map reframes to show them in full. A colored bar at the edge of the row marks the displayed chart. Only one chart is laid at a time, and the “Weather charts” checkbox in the layers menu (ticked by default) hides or restores them. The laid chart is only drawn at small scales, down to the view of a stretch of coast such as southern Brittany: when you zoom in closer, it fades out, and if you are too close when you choose it, the map zooms out to show it.
- The others (Met Office, BOM) are not overlaid on the nautical chart: they open in the image viewer, in a separate window on a computer, over the map on mobile and in the browser. A chart not yet downloaded opens in your browser.
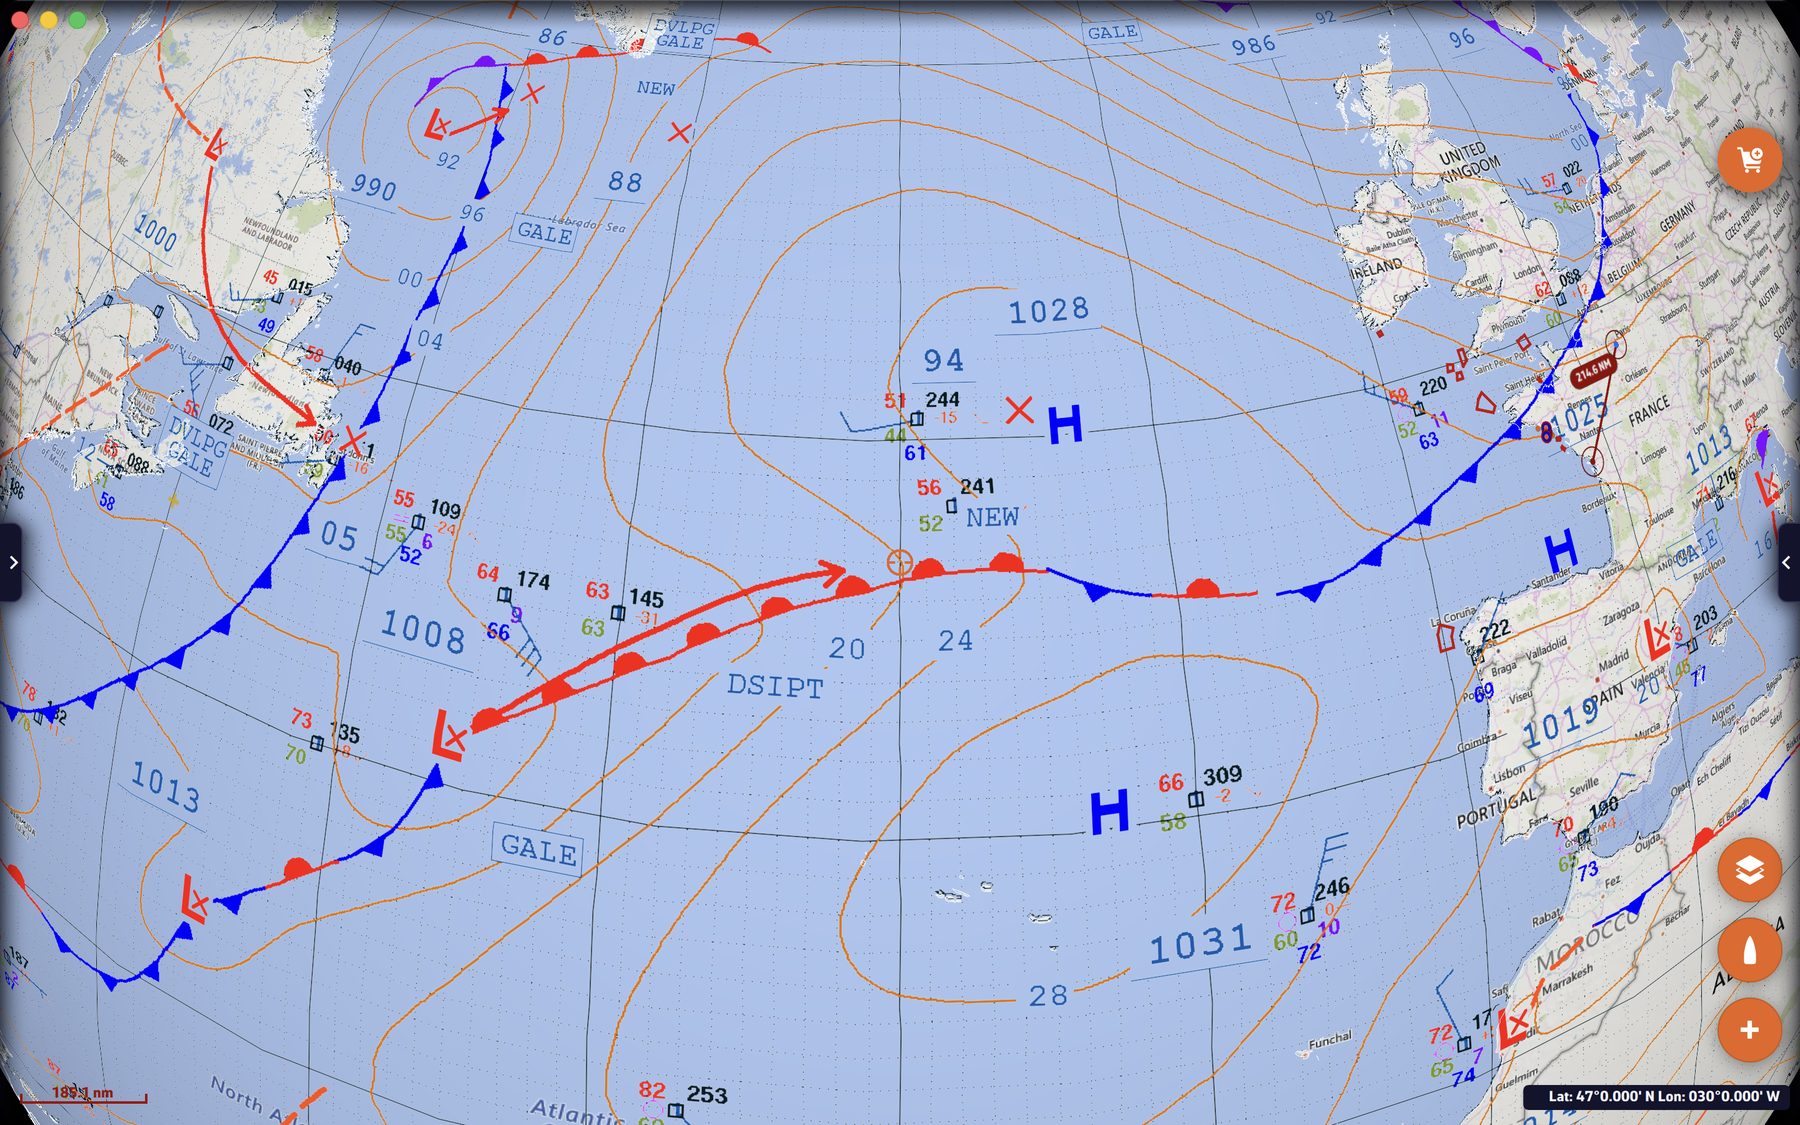 NOAA situation chart (North Atlantic, color analysis) laid over the map: isobars, anticyclones, depressions and fronts
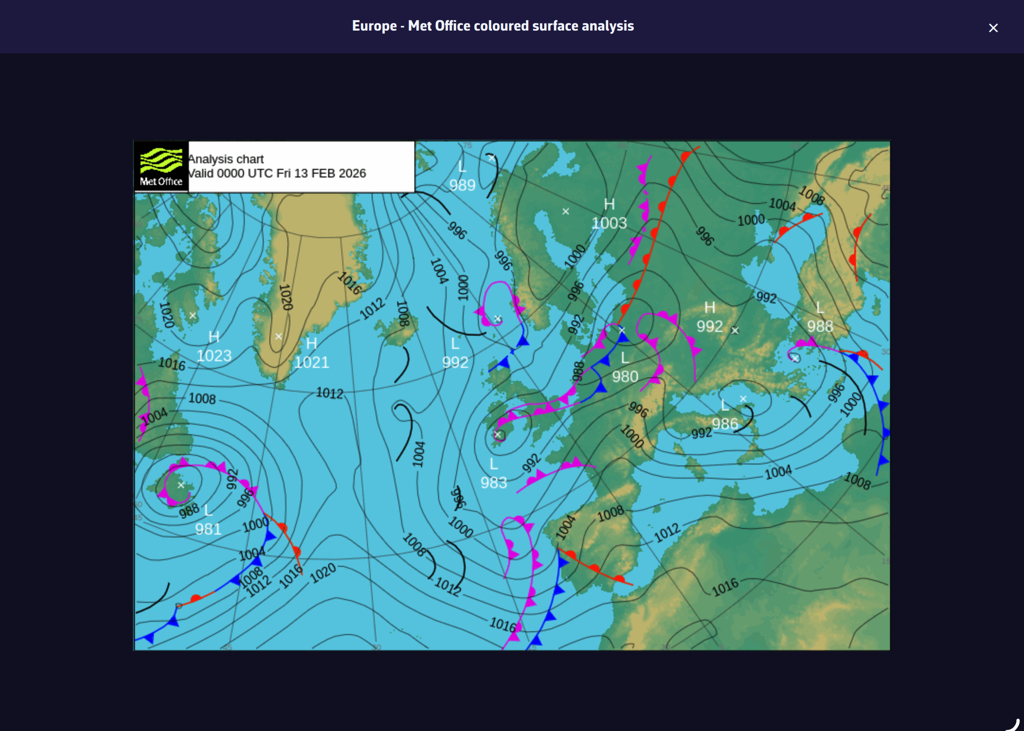 Met Office color surface analysis opened in the image viewer
With a GRIB
If a GRIB is displayed, choosing a chart laid over the nautical chart (NOAA, Marinha do Brasil, USF) sets the timeline to its validity time: you compare at a glance the forecaster’s drawing and the model’s wind at the same time. Charts that open as an image (Met Office, BOM) do not move the timeline. The laid chart, for its part, does not move with the timeline.
Offline
Charts are downloaded in the background shortly after startup, or when the tab is opened, then renewed when their validity time changes. Those already downloaded remain available without a connection. Weather charts do not require a Premium subscription.
Reading a front chart
A few guidelines, detailed in the FAQ How do I read marine weather charts?:
- H (High) marks an anticyclone, L (Low) a depression, with their central pressure.
- Isobars join points of equal pressure. Close together, they announce strong wind; widely spaced, light wind. In the Northern Hemisphere, the wind turns clockwise around an anticyclone and counterclockwise around a depression.
- A cold front is a blue line with triangles, a warm front a red line with semicircles, an occluded front a purple line carrying both, and a stationary front alternates blue triangles and red semicircles on either side.
- A trough (often marked TROF) is a dashed line: a zone of relatively low pressure, often unstable.
- The mentions GALE, STORM and HURRICANE FORCE near a depression announce gale, storm and hurricane-force winds.