Tides
BeginnerThe essentials
NavimetriX computes the tide of nearly 1,200 ports around the world, without a connection. On the chart, one gauge per port shows whether the sea is rising or falling; tapping the gauge opens the port’s tide table: times and heights of high and low waters, coefficient, curve for the day.
- Tide gauges are displayed by default. To hide or restore them, open the layers menu (round orange button at the bottom right) and tick or untick “Tides”, in the “Display” section.
- Zoom in on the coast: a green gauge signals a rising tide, a red gauge a falling tide. Its fill gives the water level between low and high water.
- Tap a gauge to open the port’s tide table. You can also right-click (long press on mobile) near a port and choose “Tide in” followed by the port name.
- Tap the date to choose another day, or drag the tide table left or right to move to the next or previous day.
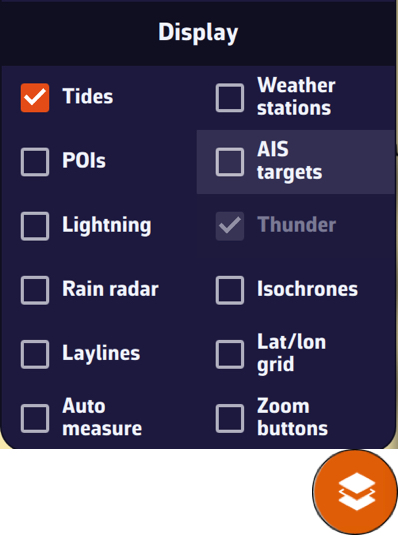 Display section of the layers menu, Tides checkbox ticked
Going further
The gauges on the chart
- Green: rising tide; red: falling tide. In colorblind mode, the rising gauge turns blue. A small arrow pointing up or down confirms the direction.
- The fill of the gauge, in tenths, places the water level between low water and high water. Special icons mark high water and low water.
- Main ports appear from the view of a stretch of coast such as southern Brittany. Secondary ports (computed from a neighboring main port) appear from the view of a bay such as Quiberon Bay.
- The gauges follow the time of the timeline when it is displayed, otherwise the current time: drag the timeline to see the tide at your arrival time.
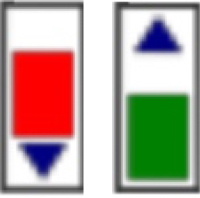 Two tide gauges: red falling and green rising
A port’s tide table
On a computer, it opens in a separate window; on phones, tablets and in the browser, over the chart. It contains, from top to bottom:
- the port name and the date, which opens a calendar;
- the table for the day: “Tide” (“High” or “Low”), “Time”, “Height” (in meters, to the centimeter) and “Coeff” (the coefficient, given at high waters);
- for the current day, the line “Now: … | Height: … m | …”, with the trend: “Ascending”, “Descending”, “High” or “Low”;
- the 24-hour tide curve, with a vertical red line at the current time for the current day;
- the “Height threshold” row;
- the “Dismiss” button.
The times follow your time zone setting (UTC or local time); in UTC, they carry the mention “UTC”. The coefficient is the French tidal coefficient, computed for Brest as in the almanacs: the higher it is, the greater the tidal range and the currents.
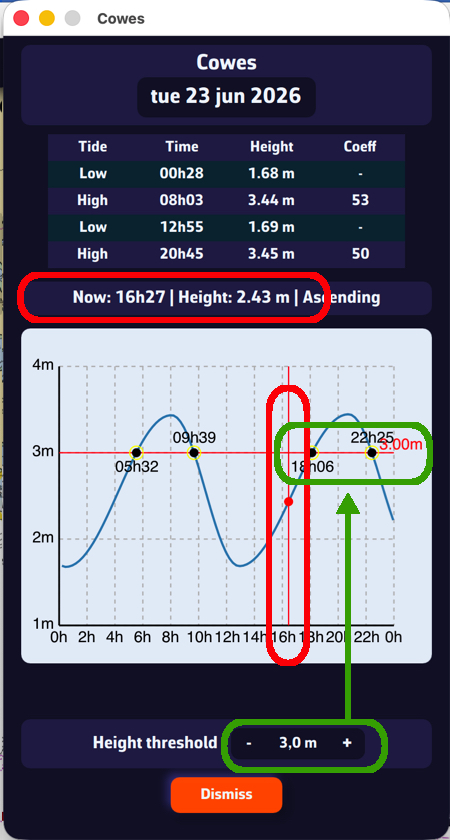 Cowes tide table: table of high and low waters, Now line, curve and height threshold
The height threshold
The height threshold answers two questions: what depth of water at a given time, and at what time the water reaches a given height. Set it with the − and + buttons on the “Height threshold” row, from 0 to 20 m in steps of 10 cm. A horizontal red line is drawn on the curve, and each crossing with the curve is marked with a dot and its time. Handy for knowing when to cross the sill of a tidal harbor or a lock, or when the channel has enough water for your draft. The chosen value is kept and follows your other devices.
Where the tides come from
The port data (889 main ports and 294 secondary ports in the October 2026 version) is downloaded when the application is installed and then updated when a new version is released; in the browser version, it is built into the application. All the computation is then done on the device, without a connection, for any date.
The harmonic constants come from SHOM, adjusted in August 2026 to the measurements of its tide gauges (REFMAR), and the corrections for secondary ports come from its tables. The control source is the book Table des marées des grands ports du monde (SHOM, 1982).
Warning: this is not SHOM’s official calculation. In general, the times of high and low water differ by about 15 minutes, and the heights by about 20 cm. For your safety, always consult the official SHOM tide tables for the place where you are.
The computation was enriched in August and October 2026.
Tides do not require a Premium subscription. They are also used for coastal routing and for the SHOM current atlas. See Currents and Weather routing.