Rain radar
BeginnerThe essentials
The rain radar shows where it is raining right now, and where it will rain in the next few hours. The images come from national and European weather radar networks, and from a nowcast computed by artificial intelligence. They refresh every five minutes. An Internet connection is required.
- Open the layers menu (round orange button at the bottom right) and tick “Rain radar”, in the “Display” section.
- To choose the sources, open the left drawer (chevron handle at the left edge of the screen), “Radar” tab, and tap the eye of each source to show or hide it.
- Drag the timeline at the bottom of the screen: to the left to review the last few hours, to the right for the forecast.
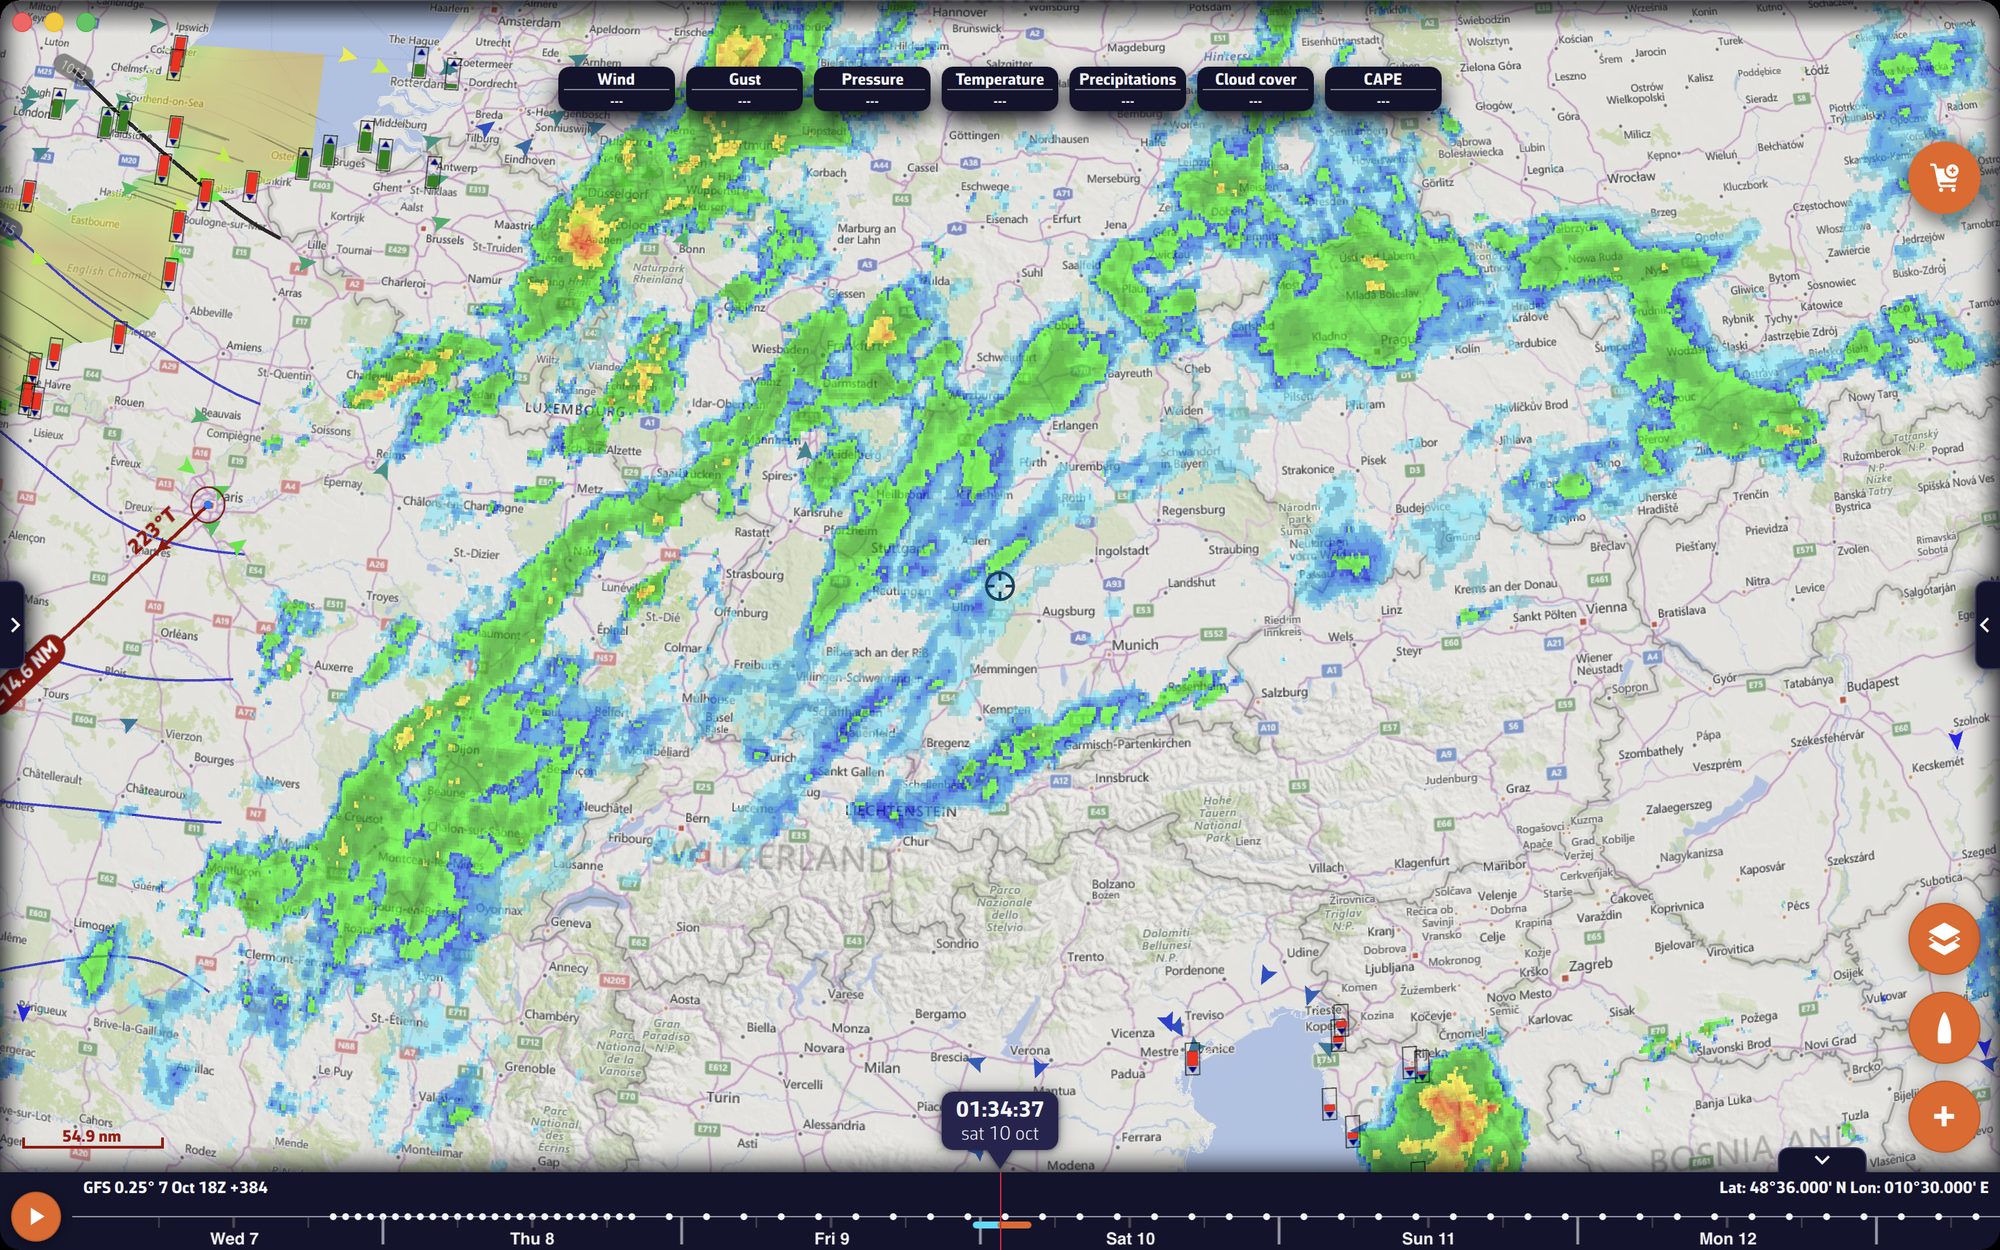 The rain radar over the English Channel, England, Belgium and Germany: showers are colored from light blue to green, then yellow for the strongest
Going further
The sources
The list in the “Radar” tab is served by our servers; it can therefore grow without an application update. In October 2026, it offers:
- “Europe (AI powered by WeatherNCo)”: rain over Europe, with an artificial-intelligence nowcast over three hours. It is the only source displayed by default;
- “Europe - Lightning (AI powered by WeatherNCo)”: forecast lightning from the same artificial intelligence, hidden by default (see Lightning and thunderstorms);
- “Europe (EUMETNET OPERA)”: the composite of European radars, which also covers Spain, Portugal, the United Kingdom, Ireland, the Benelux, Poland, the Baltic and Greece;
- “France (Météo-France)”, “Germany (DWD)”, “Italy (Protezione Civile)”, “Scandinavia (MET Norway)” and “United States (NOAA)”: the national networks.
Source names stay in English. Under the WeatherNCo sources, a link leads to this partner’s website (ai4vigil.com). Your choice of sources is remembered on the device.
A source is only drawn if the map view touches its area. If you tick several sources that overlap, their images are superimposed.
The timeline
Radar images follow the timeline: for each source, NavimetriX displays the image closest to the timeline time. With the radar displayed, the timeline extends from the oldest available image (about two hours back for most sources) to the last forecast time. Its markers distinguish:
- in cyan, observed images;
- in orange, forecast images;
- in the text color, moments observed by one source and forecast by another.
To follow the passage of a shower, drag the timeline. A source is only drawn within the time range covered by its images.
With a historical GRIB that ended more than two days ago, the radar no longer stretches the timeline to today.
The AI nowcast
The “Europe (AI powered by WeatherNCo)” source extends the observation with a forecast in 10-minute steps up to three hours, computed by an artificial intelligence model. Forecast images are read like observed images: only the color of their marker on the timeline distinguishes them.
The colors
The colors go from cyan (drizzle) to blue, green, yellow, orange and red (heavy to extreme rain), then magenta (hail risk) and purple. A light grey covers the areas seen by a radar where it is not raining: you can thus tell “no rain” from “no radar”. The image is displayed at 70% opacity, with no setting, and no legend on the chart. At very large scales, when the chart shows a harbor, the radar fades out.
Data and battery
Images are kept on the device (50 at most) and refreshed every five minutes. On phones and tablets, the radar downloads nothing when the application goes to the background, and updates again as soon as it returns to the foreground.
The rain radar does not require a Premium subscription.
See also
- Lightning and thunderstorms
- Satellite images
- Displaying forecasts on the chart (precipitation of a GRIB)
- FAQ: The timeline has disappeared