Satellite wind observations (ASCAT)
ExpertThe essentials
ASCAT is a scatterometer aboard the European MetOp-B and MetOp-C satellites: a radar that measures the roughness of the sea surface, and from it deduces the strength and direction of the wind at 10 m. NavimetriX offers these measurements as a GRIB, a map of the observed wind over the last 15 hours. It is not a forecast: it is the ideal tool to check that a model matches reality before trusting it. ASCAT requires the Premium subscription and an Internet connection.
- Draw an area and open the download window as for any GRIB (+ button, “Download GRIB”).
- Choose the type “Observations (ASCAT)” and the model “ASCAT 0.125° (MetOp-B/C, 15 h)”, then “Download GRIB”.
- The measured wind is displayed on the chart, in bands: the swaths, that is, the strips of sea seen by the satellite on each pass.
- Place the target on a point: the “Measured at” badge gives the day and time of the measurement.
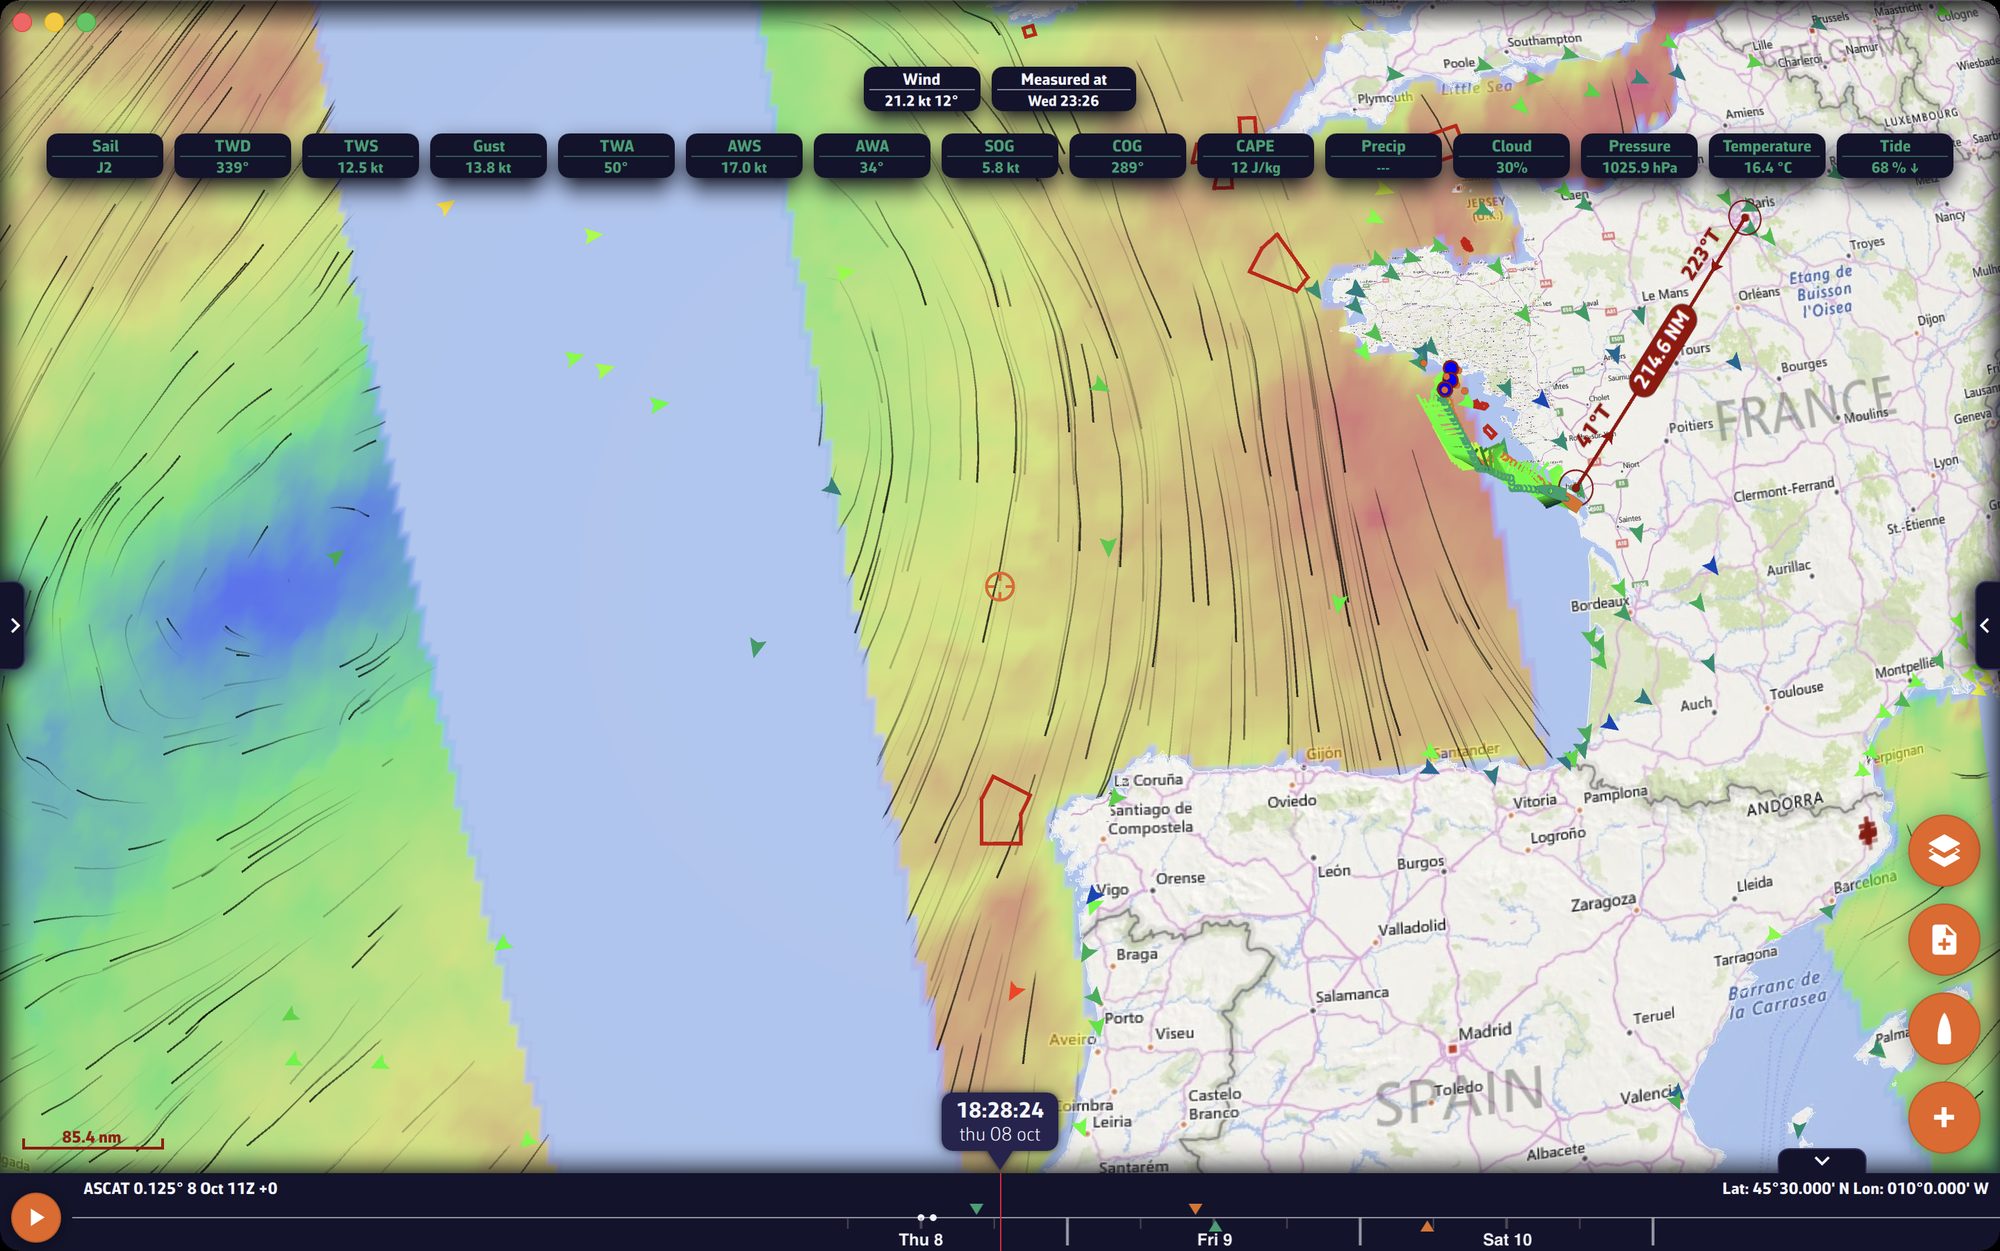 ASCAT GRIB over the Bay of Biscay: two colored swaths and the empty strip between them, “Wind” and “Measured at” badges at the top of the chart, target in a swath
Going further
What the file contains
According to the catalog description (the “Model description and map coverage” button of the download window):
- the surface wind measured by the ASCAT scatterometers of MetOp-B and MetOp-C, coastal product from KNMI and EUMETSAT OSI SAF (12.5 km cells), on a 0.125° grid;
- a single map of the last 15 hours, redone every hour: each point shows the most recent satellite pass, about 2 to 15 hours old;
- the areas between swaths are empty.
The file only contains the wind: no pressure, no gusts. Since it is redone every hour, the update button on its row, in the “GRIBs” tab, lights up with each new map (see Manage the GRIB list).
The display
The measured wind is displayed like the wind of a GRIB: color map, particles or barbs, with the same settings. Between swaths, the chart stays transparent: no value is invented there. The edges of the swaths are not outlined.
The measurement time
Each point was not measured at the same time: depending on the passes, the measurement can date from two hours ago or from the previous evening. The “Measured at” badge, placed right after the “Wind” badge at the top of the chart, gives the day and time of the measurement under the target, for example “Mon 22:26” in local time, or followed by “UTC” if your time zone is set to UTC. The value is that of the nearest grid point, never interpolated. “—” means a point without measurement, between two swaths.
This badge does not open as a curve, and the measurement time does not appear in the “Value at cursor” on computers.
How to use it
- Judge a model: display ASCAT, note the measured wind and its time, then display the model’s GRIB at the same time on the timeline. A model that clearly underestimates the measured wind calls for caution for the coming hours; if several models are available, prefer the one that best matches the measurements.
- Spot a phenomenon: a depression, a front, an area of strong wind are visible in the swaths, with their actual position.
- Not for routing: these are past measurements, not a forecast. The ASCAT file has a single moment, already past: it allows no useful routing. It is used to compare models with reality; to route, use a forecast model.
ASCAT measurements also appear, point by point, among the in-situ stations, with the type “Satellite”. See In-situ stations and weather ships.