Waves and sea state
ExpertThe essentials
Wave models (the “Sea State” type in the download window) describe the sea in a simplified way: its height, period and direction. Many distinguish the wind sea, raised by the local wind, from the swell, which comes from farther away, next to the total sea that combines the two. NavimetriX displays the height in color, the direction as arrows, and all the values in the badges at the top of the chart. Wave models require the Premium subscription.
- Download a “Sea State” GRIB for your area (see Download a GRIB).
- Display it from the “GRIBs” tab of the left drawer. In the layers menu, the displayed parameter is “Waves”.
- Tick “Color map” for the height and “Arrows” for the direction.
- Under the target, read the total sea, the wind sea and the swell: height, direction and period, then the steepness of the sea.
- Tap a badge to open its curve over the whole duration of the file.
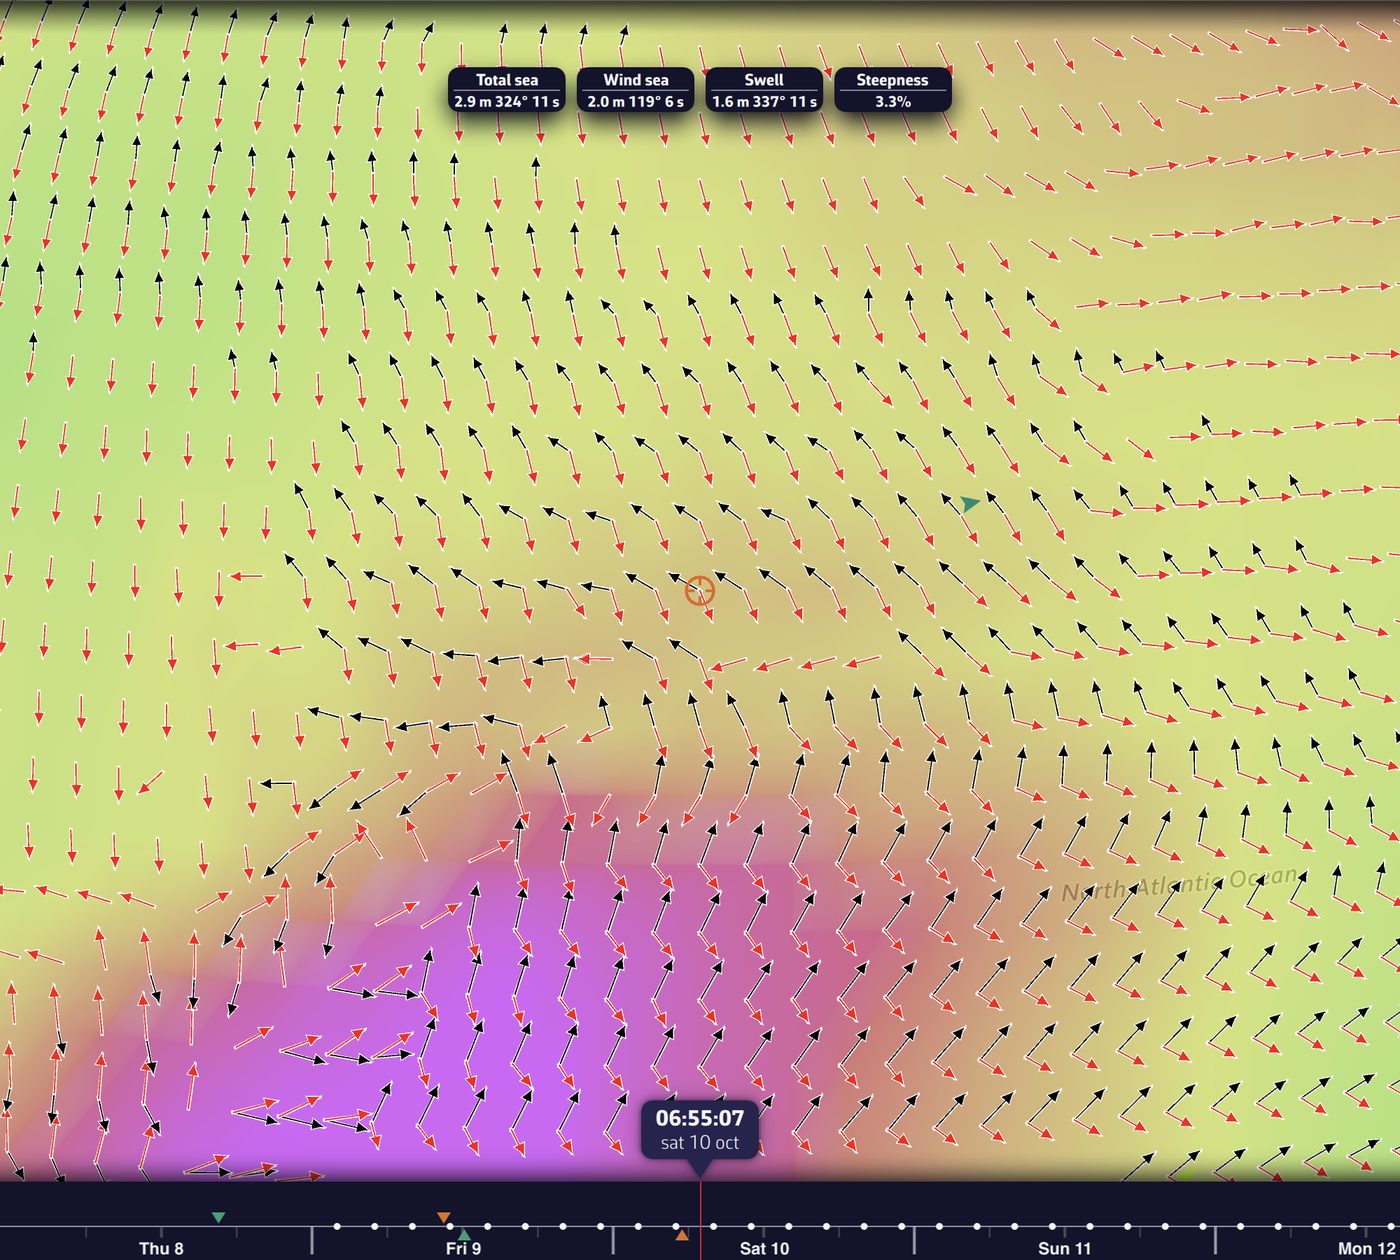 Wind sea and swell on the chart: Total sea, Wind sea, Swell and Steepness badges, black arrows for the wind sea and red arrows for the swell
Going further
Total sea, wind sea and swell
- The height is the significant wave height, the usual measure of sea state: it corresponds roughly to what an observer estimates by eye. Some individual waves are noticeably higher.
- The period is the time, in seconds, between two crests. A long swell (high period) is more comfortable than a short, steep wind sea of the same height.
- The direction is the one the waves come from, as for the wind: a 270° swell arrives from the west.
When the file contains the wind sea or the swell, the “Waves” badge becomes “Total sea”, and two badges are added: “Wind sea” and “Swell”. Each gives the height, direction and period; “—” means a value is missing.
Tap a badge to open its curve at the target point, over the whole duration of the file:
- the height as a solid orange line, on the left axis, in meters;
- the period as light blue dashes, on the right axis, in seconds;
- the direction as arrows, in a row at the top of the graph, and as a large arrow on the curve at the displayed time. As on the chart, the arrows show the direction in which the waves travel.
Tap the curve to move through time; tap the badge again to close the graph.
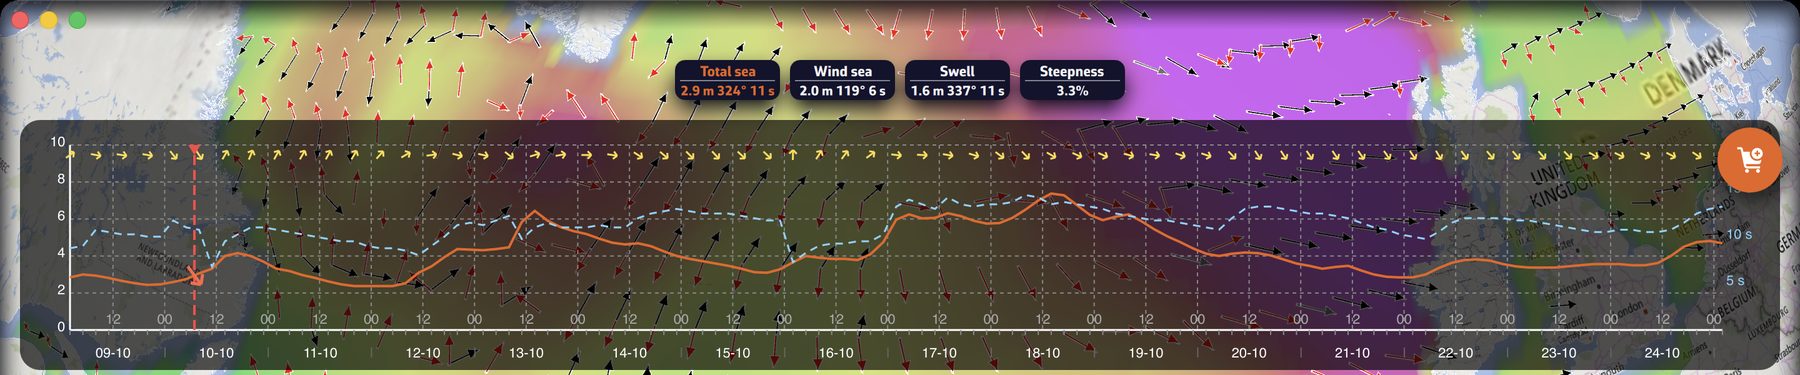 Total sea curve: height in orange, period as light blue dashes on the right axis, direction arrows at the top
The arrows
The “Arrows” checkbox in the layers menu displays the wave direction:
- with a file that distinguishes wind sea and swell, two arrows per grid point: the wind sea in the color of the chart (black, white on the BING background) and the swell in red. The total sea appears in grey, only where the model gives neither of the two;
- with a total-sea-only file, one arrow in the color of the chart.
The arrows start from the grid point and show the direction of travel of the waves, the opposite of the badges, which give the direction they come from. Their length grows with the height. No arrow starts from land.
The color map
The color follows the height of the total sea, from blue (calm sea) to magenta (rough sea), over 0 to 5 m. It is always masked over land, whatever the “Land mask” setting of the wind.
The settings are in the right drawer, “Forecast display”, “Waves” section:
| Setting | Values | Default |
|---|---|---|
| “Color map style” | “Gradient” or “Iso areas” | Gradient |
| “Transparency” | 0 to 100%, in steps of 5 | 50% |
| “Iso areas step” | 0.2 to 2.0 m, in steps of 0.2 | 0.2 m |
In “Iso areas”, the sea is painted in bands of the chosen height, and the band under the first step stays transparent. There is no setting for the arrows.
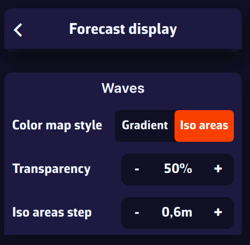 Forecast display drawer, Waves section: color map style, transparency and iso areas step
Steepness
Steepness is the ratio between the wave height and the wavelength, expressed as a percentage. At equal height, a short sea is steeper, more hollow and harder on the boat than a long swell: 2 m of swell at 12 s gives a steepness of 0.9%, 2 m of wind sea at 5 s gives 5.1%.
NavimetriX computes it with the deep-water wavelength, from the height and period in the GRIB, for the total sea and for the wind sea, and keeps the higher of the two. The swell, long by nature, is not part of the calculation. Seas under 0.5 m are ignored: a chop of a few centimeters would give a high steepness that means nothing for a boat.
| Steepness | What is generally observed |
|---|---|
| Around 2% | Long swell, gentle sea |
| 3 to 4% | Well-developed wind sea, a few whitecaps |
| 4 to 5% | Whitecaps everywhere, frequent breaking |
| Beyond 5 to 6% | Young, short sea (strengthening wind, wind against current): crests often break |
These guidelines apply to the mean steepness of the sea state. An isolated wave breaks at about 14% (1/7), but the largest waves of a sea reach about twice the significant height: they approach that limit when the mean steepness exceeds 6 to 7%. Offshore, such values remain rare: on a 16-day global GFS Wave, fewer than one point in a thousand exceeds 5%. This calculation takes neither depth nor current into account, which steepen the sea over shoals and in wind against current.
Steepness can be read:
- in the “Steepness” badge, next to the wave badges; tap it to open its curve, graduated in %;
- as a color map: in the layers menu, choose “Steepness” instead of “Waves”. The sea stays transparent below 1.5%, then goes from green (2%) to yellow (3%), orange (4%), red (5%) and dark red from 6%. The direction arrows remain displayed, and the color map is never more transparent than 25%, even if the wave transparency is set higher;
- in “Value at cursor”, on a computer, when “Steepness” is the displayed parameter;
- along a routing, in the “Max Steepness” column of the passage table and in the “Steepness” badge of the routing bar;
- in the meteogram, “Wave Steepness” column, when the file only gives the total sea.
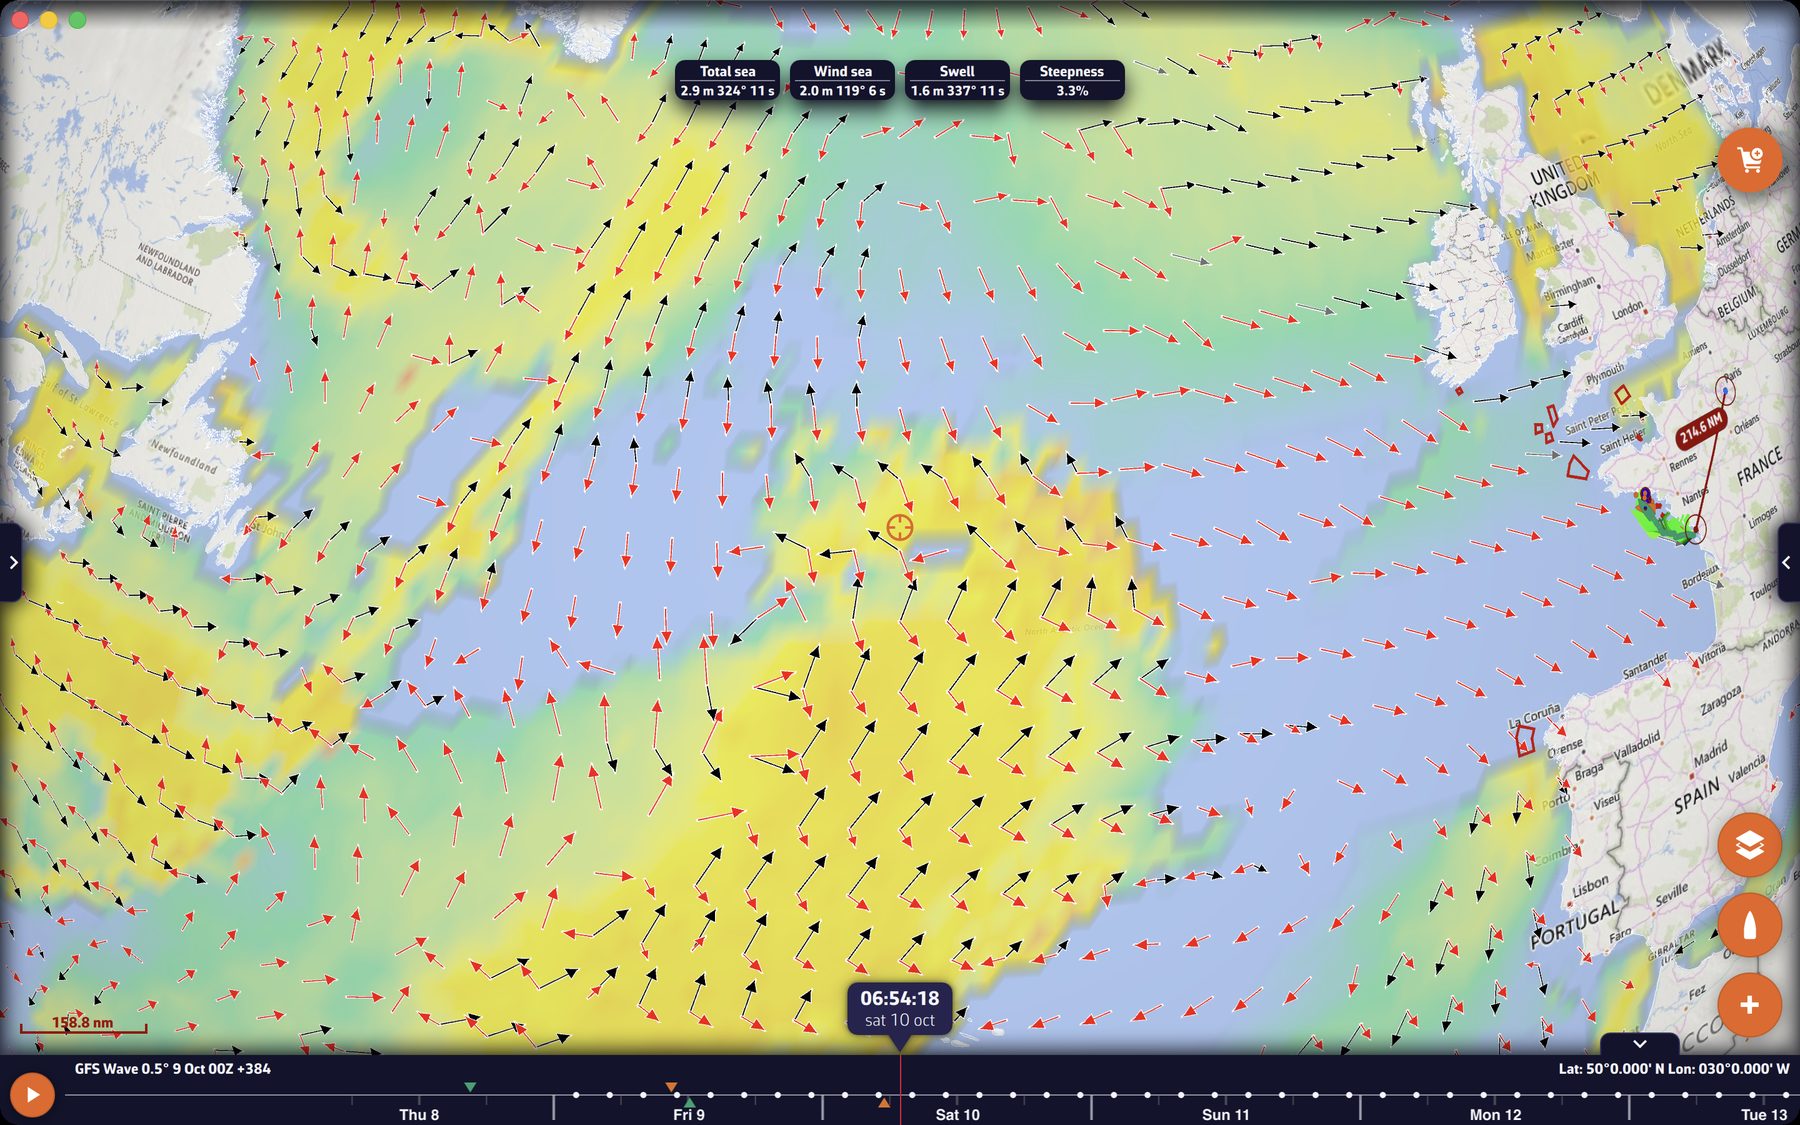 “Steepness” color map over the North Atlantic with the wind sea and swell arrows, and the “Steepness” badge
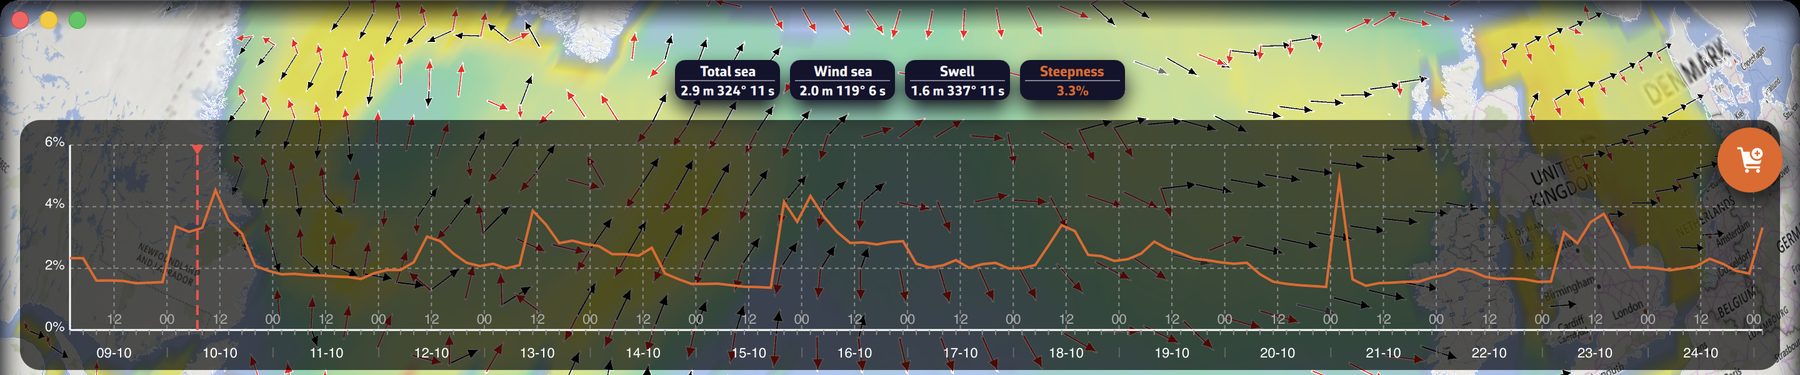 Steepness curve at the target point, graduated in %
In the October 2026 catalog, GFS Wave, MFWAM (global and France), Copernicus (global and Mediterranean) and DMI WAM give the wind sea and the swell. ECMWF Wave and the IFREMER WW3 models only give the total sea.
IFREMER WW3 files: waves and currents
Most IFREMER WW3 models also contain the current (all except Guadeloupe-Martinique 1 km, Martinique and Réunion). When one of these files is displayed, the layers menu list offers “Currents” before “Waves”: choose “Waves” to see the sea state.
Other ways to read the waves
- The meteogram gives, forecast time by forecast time, the height, direction and period of the total sea, and its steepness when the file has no wind sea.
- On a computer, “Value at cursor” displays the height, the direction the waves come from and their period under the mouse pointer.
- On export, a wave file is rewritten so that other navigation software can read it (see Manage the GRIB list).
- Routing can take waves into account: the wave GRIB is chosen in the routing window, or by default with the “Suggested models”. See Weather routing.