Meteogram
ExpertThe essentials
The meteogram presents, as a table, the whole forecast of a GRIB at a single point: one row per forecast time, one column per parameter. You see at a glance when the wind picks up, when the pressure drops or when the rain arrives, without scrolling the timeline.
- Display the GRIB you want on the chart (tap its row in the “GRIBs” tab of the left drawer).
- Center the chart on the point you are interested in: your anchorage, a cape to round, the starting point.
- On the row of the displayed GRIB, tap the table-shaped button, to the left of the ⋮ menu. It only appears if the center of the chart is within the GRIB area.
- The table opens on the row for the time shown by the timeline, highlighted.
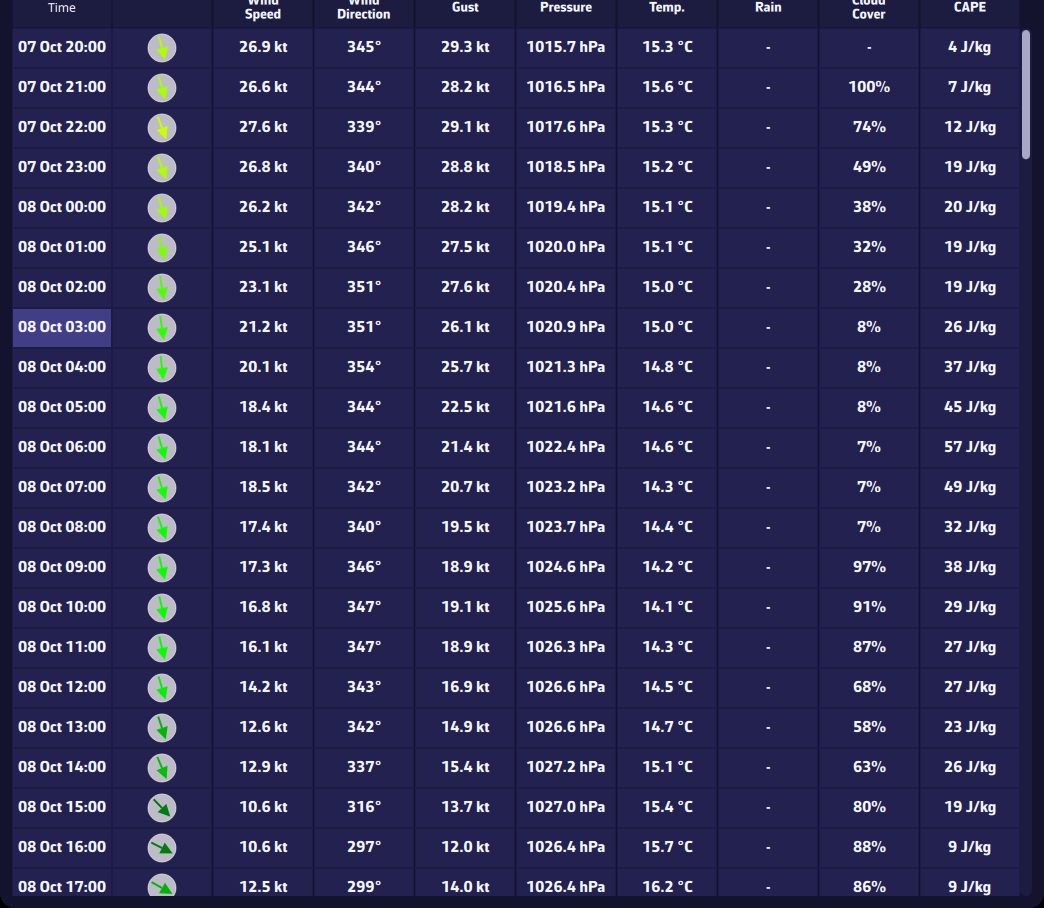 The meteogram of a GRIB: one row per hour, the current hour highlighted
Going further
The point and the file read
The meteogram reads the displayed GRIB, and only that one: to compare two models, open the meteogram of one, then display the other and open its meteogram. It gives the values at the center of the chart at the moment you open it; moving the chart afterwards does not change the table. For another point, recenter the chart and reopen it.
Its title shows the model name and its run, not the name you may have given the file.
The columns
The first column, “Time”, stays fixed when you scroll the table. The times follow your time zone setting (UTC or local time); in UTC, they carry the mention “UTC”. The table covers the whole duration of the GRIB, at its step.
On computer and tablet, the columns are, in order:
- a wind arrow, colored according to the wind strength (the colors follow the colorblind mode if it is on);
- “Wind Speed”, “Wind Direction” and “Gust”;
- “Pressure” and “Temp.” (air temperature);
- “Rain”, in mm/h (a dash below 0.1 mm/h);
- “Cloud Cover”, in %;
- “CAPE”, in J/kg (a dash below 1 J/kg). CAPE measures the energy available for thunderstorms: the higher it is, the greater the risk of storms;
- “Snow”, in %;
- “Current Speed” and “Current Dir.”;
- “Wave Height” (in m), “Wave Dir.” and “Wave Period” (in s).
Only the columns present in the GRIB are displayed: a wave file only shows waves, an atmospheric file without precipitation has no “Rain” column. Wind, gusts, pressure, temperature and current follow your unit settings, and the table updates if you change them. Directions follow the “Angle” unit setting (degrees or cardinal points).
On a phone, the headers are abbreviated to fit the width: SPD (wind speed), DIR (direction), GUST (gusts), PRES (pressure), TEMP (temperature), RAIN (rain), CLOUD (clouds), CAPE, SNOW (snow), CUR (current), WAV (wave height), PER (period).
Moving around the table
Scroll the table vertically and horizontally, with the mouse wheel or your finger. The row for the time shown by the timeline stays highlighted and follows the timeline if you move it: a simple way to find in the table the moment you are looking at on the chart.
A curve rather than a table
To follow a single parameter as a curve, tap its badge in the row at the top of the chart: the curve of that parameter over the whole duration of the GRIB, at the target point, appears under the badges. See Displaying forecasts on the chart.
Computer, mobile and browser
On a computer (macOS, Windows, Linux), the meteogram opens in a separate window, titled “Meteogram:” followed by the model name; close it like an ordinary window. On phones, tablets and in the browser version, it opens full screen, with a “Dismiss” button.
See also
- Manage the GRIB list
- Displaying forecasts on the chart (value at cursor)
- Waves and sea state
- Settings (units and time zone)