Replay
BeginnerThe essentials
Replay replays a recorded trip: the boat sails its course again on the chart, the dials show the values measured on board, the AIS targets you passed reappear, the logbook entries mark the track and, if the trip allows it, that day’s weather loads by itself.
- Open the left drawer, Tracks tab.
- Tap the trip’s ⋮ button, then Replay. You can also tap the track on the chart and choose Replay in the menu that opens.
- A playback banner replaces the timeline at the bottom of the screen. Tap the play button to start or pause.
- Drag the timeline, or tap it, to go to another moment. Tapping the track on the chart also takes playback to that spot.
- To return to the present, tap the × cross on the banner.
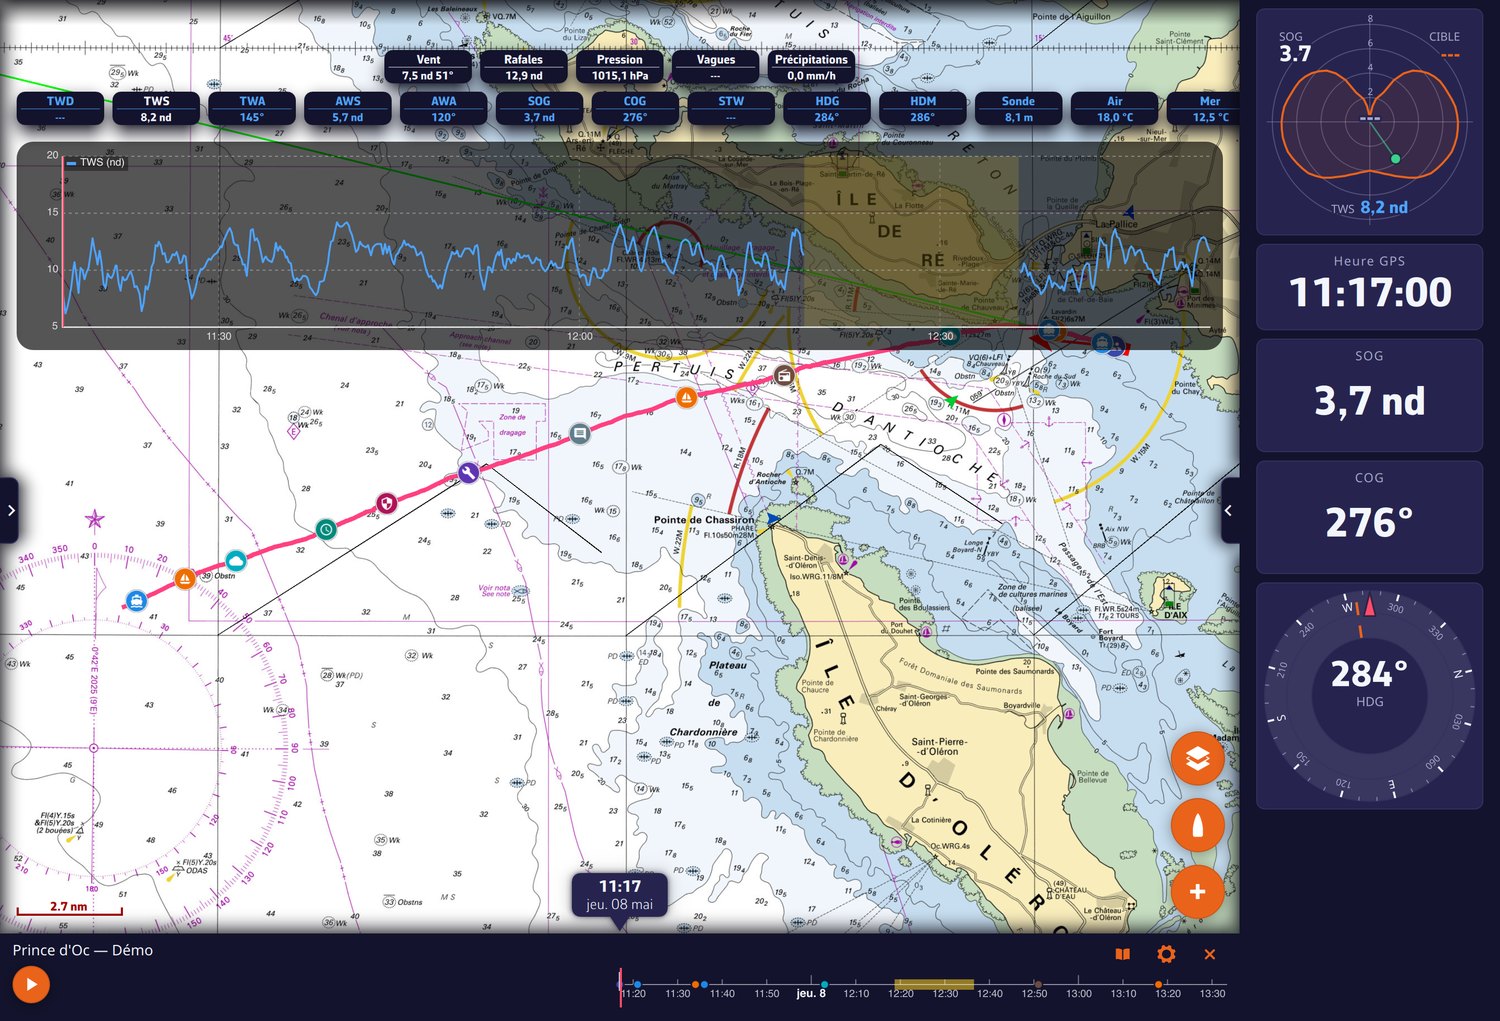 Replay of a trip: recorded values, wind curve, logbook pictograms on the track and playback banner
Going further
Which tracks can be replayed
Replay needs the data recorded during the trip, not only the track’s points. The menu tells you:
- Replay: the trip can be replayed;
- “Replay (not recorded)”, greyed out: the track has no Replay data (for example an old track, or a GPX imported without a Premium account);
- “Replay (no longer on this device)”, greyed out: the data has left the device and no account is connected to retrieve it.
Once uploaded to your account, the Replay data is erased from the device after 7 days. With a connected account, the trip remains replayable: “Fetching this track from your account…” is displayed during the download, which requires an Internet connection.
The track being recorded cannot be replayed. If you start the Replay of another trip while Navigation mode is active, the app warns you: recording is suspended while you watch (the track and the logbook carry a declared gap), and so are the navigation alarms and live AIS targets.
In the Tracks tab, the replayed trip is recognised by a stripe on the left edge of its line and by a play triangle that pulses above its eye.
The playback banner
- The timeline scrolls under a central cursor, with midnight separators and day labels. A box under the cursor gives the time and date of the moment being played. It shows at most one day at a time; a shorter trip spreads over the full width. Its scale follows the “Timeline scale” setting in the general settings.
- When touched, the timeline enlarges to be easier to aim at, then folds back by itself.
- A tap on the timeline jumps to the chosen moment while travelling along the path, so that you see where you are going. A drag follows your finger.
- Acquisition gaps (moments without data) are painted on the timeline. The status line announces them with a countdown, and playback crosses them by itself.
- Logbook entries appear as coloured badges on the timeline.
- At the right of the banner: the logbook button, the cogwheel for the track’s display settings, and the cross that closes the Replay.
On a phone in landscape, the timeline becomes a column at the side of the screen, with the play button at the bottom.
Playback speed follows the zoom
There is no multiplier to choose. The speed is calculated so that the boat crosses the screen in about one minute, whatever the scale: zoom in to slow down and watch a manoeuvre, zoom out to scroll through a crossing. It does not go below real time and is capped at 20,000 times real time.
To play faster or slower at the same zoom, set “Playback speed” (×½, ×1, ×2 or ×4) in the banner’s cogwheel. This setting is remembered for each track, like the other settings in the “Track display” window: see Record and display the track. “Follow boat during replay” is off by default there: the chart stays where you leave it.
The recorded values and their curves
During Replay, a row of pills at the top of the chart shows the values measured on board at the moment being played: TWD, TWS, TWA (true wind direction, speed and angle), AWS and AWA (apparent wind), SOG and COG (speed and course over ground), STW (speed through water), HDG (heading), VMG, depth, heel, rudder angle, pressure, temperatures… depending on what the boat was recording.
Tap a pill to open that value’s curve: it scrolls with playback, with the cursor at two thirds of the frame. This is where you find the night’s lull or the wind shift without replaying the whole trip. If the weather of the time is loaded and you also choose a weather pill, the two curves overlap: what the forecast announced and what the boat measured.
The weather of the time
For a trip after 29 February 2024, NavimetriX automatically asks the server for the weather of those days over the area travelled: archive of the ECMWF IFS model (the European Centre’s model), with wind, gusts, pressure, cloud cover, precipitation and waves. An Internet connection is required.
- The grid is 0.25°, 0.5° or 1° depending on the extent of the trip. If the file exceeds 12 MB even at 1°, the weather of the time is not loaded.
- A banner tracks the request: “Asking for the weather of that day…”, then, if the server has to build the archive, the number of days remaining, then the download. “No archived weather for this navigation” indicates that there is nothing to display.
- The weather loads like a GRIB file. Its values, at the top of the chart, give the weather at the moment being played.
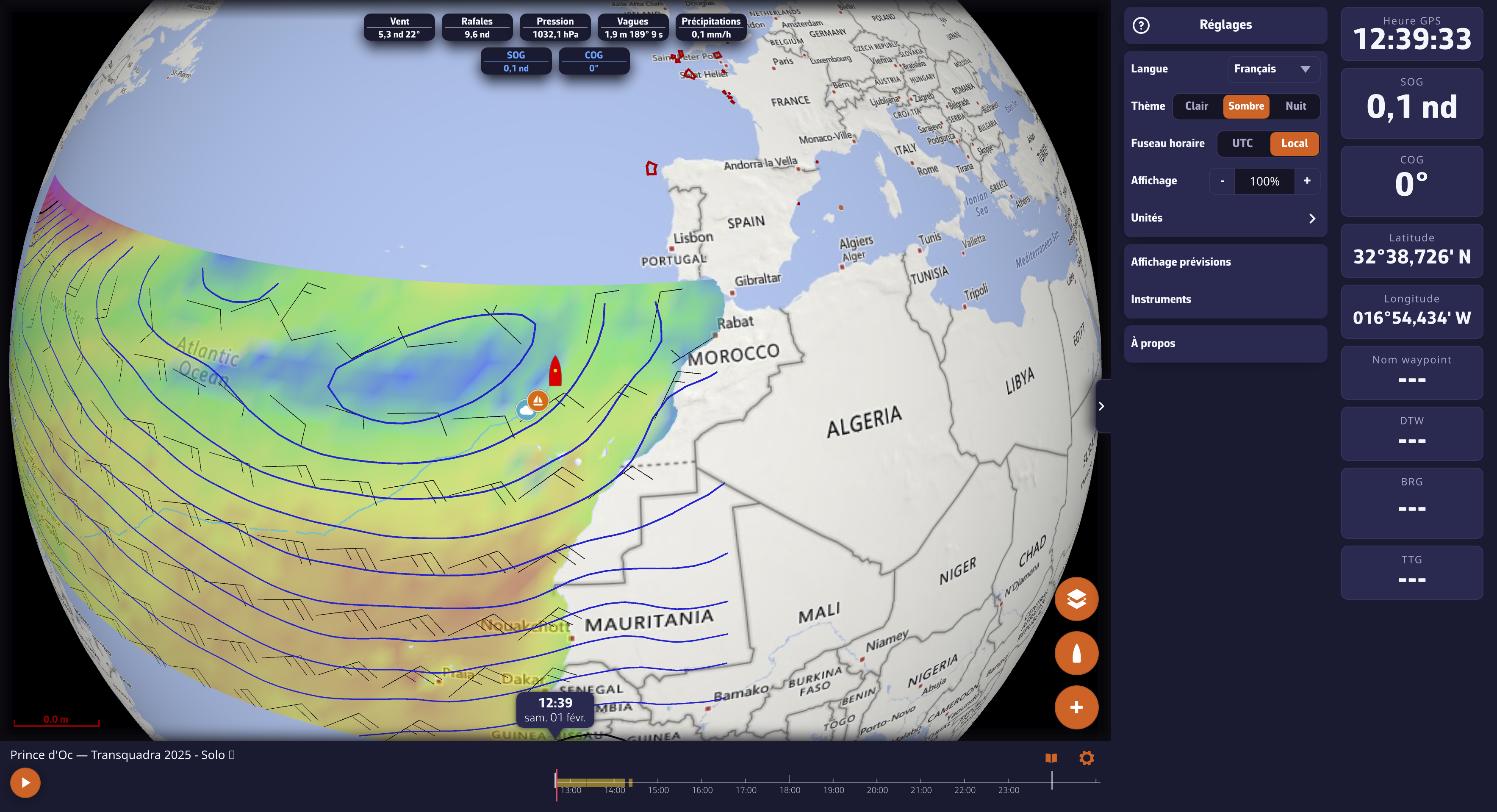 Replay of a crossing with the weather of the time
The logbook during Replay
- Tap a logbook pictogram on the track: a menu offers “Go to this moment”, “Details”, “Edit”, “Open logbook” and “Delete”.
- The logbook button, in the banner, opens the full table; “Go to this moment” takes playback to the time of an entry.
- To complete the logbook afterwards, chart + menu > “Add a logbook entry”: the entry is dated at the moment being played and placed on the track. This entry only exists for your own trips, not for a shared link.
See also
- Logbook
- Share a track: Replay in a browser, without an account.
- Track sync: follow live a trip recorded on another device.
- Weather: GRIB files and forecasts
- FAQ: How do I replay a track (Replay)?