Read a routing
BeginnerThe essentials
A finished routing is displayed on the chart, in its colour, and is found in the “Routings” tab of the left drawer.
- Select it by tapping it in the “Routings” tab: an orange bar appears on its left.
- Follow the boat along the route by dragging the timeline, or tap the route directly where you want: the timeline moves to the time when the boat passes there. The play button, at the start of the timeline, makes time run by itself.
- Read the values bar, at the top of the chart: wind, boat speed and heading at the timeline’s time, in the routing’s colour.
- Tap a value in the bar to display its graph over the whole duration of the routing; tap it again to close it.
- To see everything, open the routing’s ⋮ menu in the “Routings” tab, then “Details”.
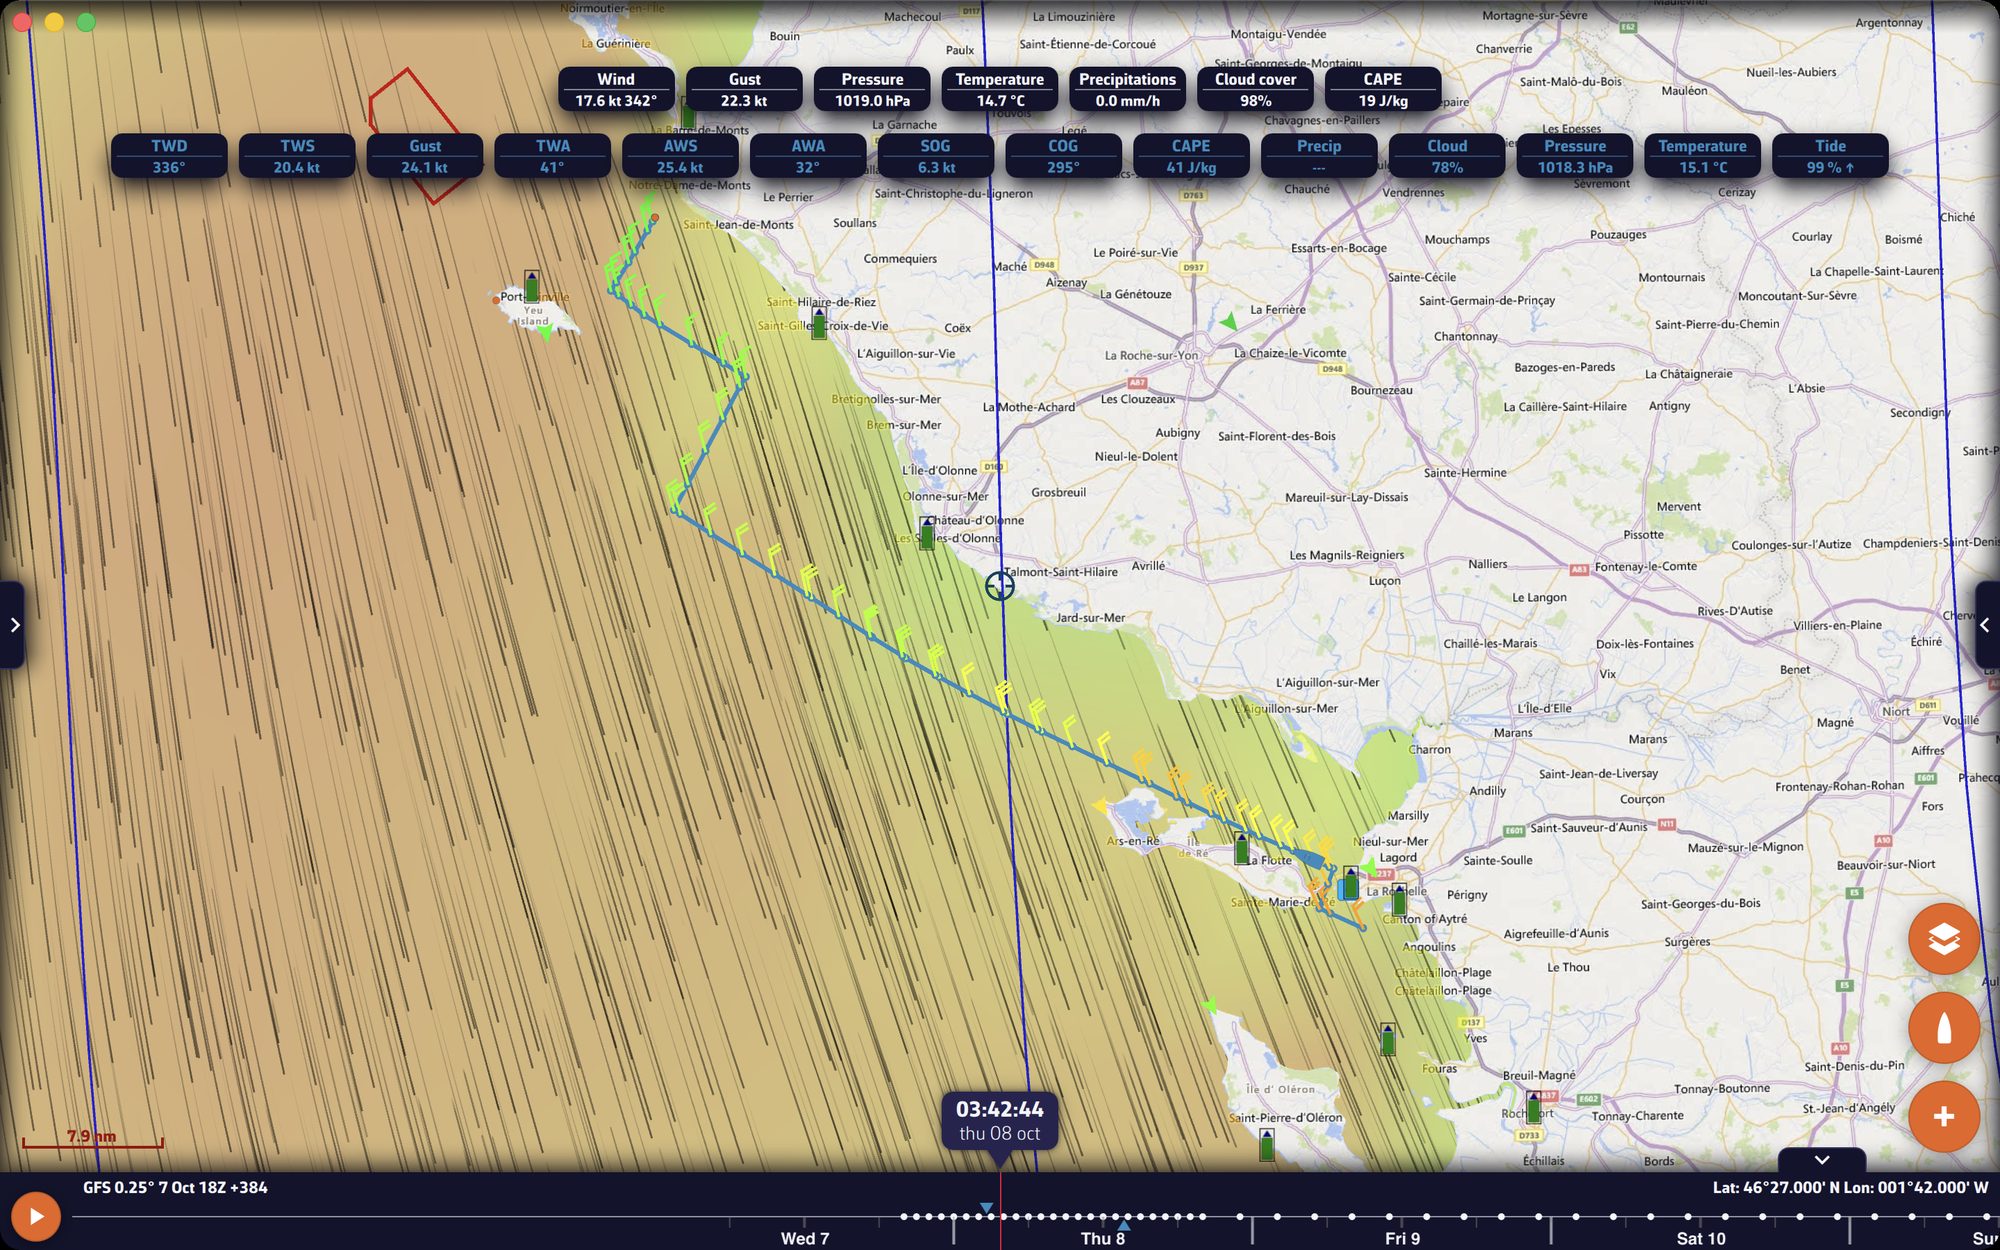 A routing displayed on the chart, with the routing values bar at the top
Going further
On the chart
- The optimal route is drawn in the routing’s colour.
- Where it crosses an isochrone, and at the start, the finish, the waypoints and the tacks and gybes, a dot and a wind barb of the same colour mark it. The barb gives the wind used by the calculation on the leg that follows: its strength and direction, averaged over the isochrone step. If the routing takes current into account, a black arrow also gives the current. With no isochrones displayed, all the points of the route are marked.
- Legs made under engine are dotted.
- The eye, to the right of each routing in the “Routings” tab, shows or hides it on the chart.
Colours: by routing, by sail, by speed
At the top of the “Routings” tab, the “Colour” selector offers three readings, valid for all routings:
- “Routing”: each routing in its own colour, that of its name in the list (default);
- “Sail”: each leg in the colour of the sail carried. A legend recalls the code of each sail, with a grey gear-shaped dot for the engine. The routing’s polar must have a Sailchart; otherwise the legend says “No Sailchart on the selected polar”;
- “Speed”: a gradient from blue (“slow”) to yellow (“fast”), on the scale specific to each routing.
The choice is shared between your devices. The sail set is saved with each routing: if you later change polar or Sailchart, an older routing keeps the sails of its calculation.
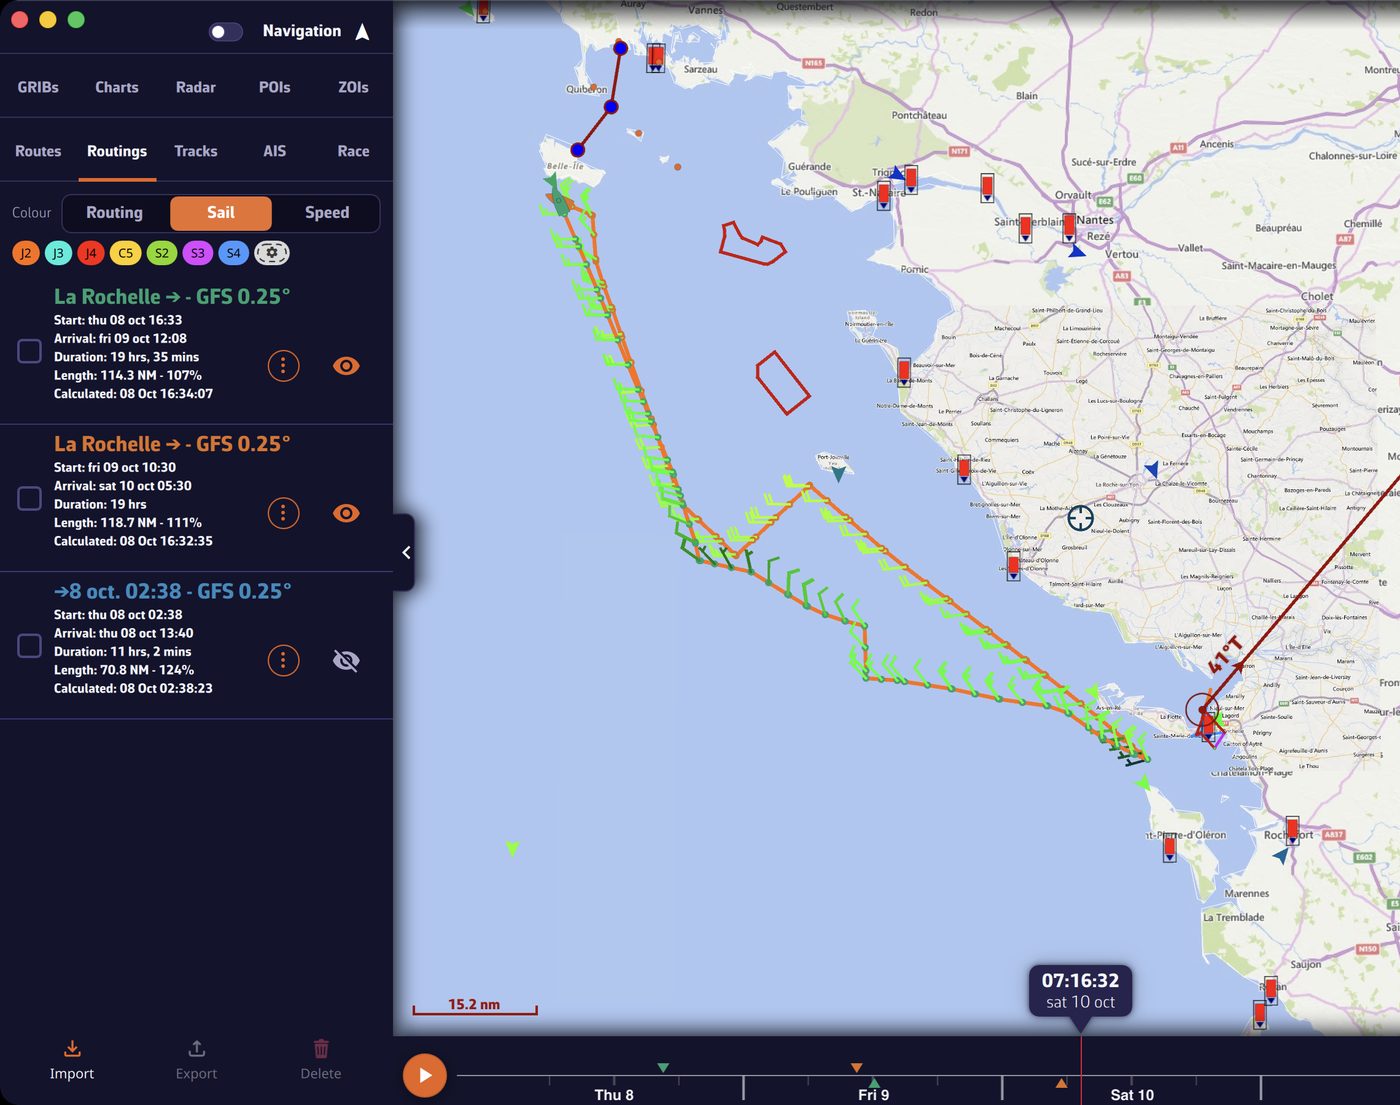 The “Colour” selector on “Sail”, its legend and a routing coloured by sail
The values bar and its graph
The bar shows the values of the leg the boat is sailing at the timeline’s time. It shows only what the routing contains:
| Values | When they appear |
|---|---|
| “Sail” | the polar has a Sailchart |
| TWD, TWS, TWA, AWS, AWA, SOG, COG | always (true wind, apparent wind, speed and course over ground) |
| “Gust” | the wind GRIB provides gusts |
| STW, CTW, SOC, DOC | the routing takes current into account (speed and heading through the water, speed and direction of the current) |
| “Waves”, “Wave Dir”, “Wave Per” | a wave GRIB is used |
| CAPE, “Precip”, “Cloud”, “Pressure”, “Temperature” | the wind GRIB contains these parameters |
| “Under keel” | coastal routing with a C-MAP chart |
| “Tide” | a tide station is close to the route and “Use the tide for the depth” is on |
| “Engine” | a leg under engine exists |
- “Tide” shows where the tide stands, as a percentage between low water (0%) and high water (100%), with a rising or falling arrow; failing that, the water height.
- “Under keel” gives the water under the keel at its tightest on the leg (lowest sounding, lowest tide during the passage), preceded by “≥”. The value turns yellow when this water is less than the under-keel clearance, and red if the boat would touch the bottom.
Tapping a value opens its graph under the bar: the curve over the whole duration of the routing, and a red cursor at the timeline’s time. Tap or drag your finger on the graph to move the time.
The tidal coefficient is not in the bar: it is in the routing table.
The routing details
“Details”, in the routing’s ⋮ menu, opens a window (a separate window on computer, a full-screen panel on phone, tablet and browser). It has four tabs, five for an ensemble routing: “Routing”, “Statistics”, “Ensemble”, “AI briefing” and “Inputs”. “Details” is unavailable during a calculation.
Routing tab: the table
One row per leg of the route, with the “Time” frozen on the left, and one column per data item. Columns with no data are removed (engine never used, no waves, a single wind model…). On phone, the headers are abbreviated to acronyms (TWS, TWD…).
Depending on the routing, the table gives: true and apparent wind, speed and heading over ground and through the water, current, distance to the finish and to the waypoint, the sail configuration, the engine (⚙), total sea, wind sea and swell, “Crossed Sea” (⚠️ when there is some), gusts, pressure, air temperature, precipitation, CAPE, cloud cover, and the “Wind Model” when several GRIBs were used.
A few reading tips:
- the wind angle (TWA) is followed or preceded by a chevron that indicates the tack, in red or green (orange or teal in colour-blind mode);
- wave, pressure or rain values missing from the GRIB are shown as “-”.
The coastal route report. The table can add, leg by leg, the columns below. “Water Depth”, “Under keel” and “Nearest Danger” require a C-MAP chart and “Avoid shallow waters (C-MAP)” on. “Distance to Coast” is also shown without C-MAP. The three tide columns are shown, with or without C-MAP, as soon as a tide station is close to the route and “Use the tide for the depth” is on (yes by default):
| Column | Content |
|---|---|
| “Water Depth” | the lowest sounding on the leg, tide included (“≥”), “Land or rock” if the leg touches land |
| “Under keel” | the water remaining under the keel |
| “Nearest Danger” | the distance to the nearest danger |
| “Distance to Coast” | the distance to land |
| “Tide height” | the tide height, with the trend (↑ ↓) and the position between low and high water in % |
| “Tide Harbour” | the tide station used |
| “Tidal Coefficient” | the coefficient |
A coloured value flags the leg to watch: water under the keel less than the under-keel clearance (yellow), boat that would touch the bottom (red), danger closer than the set minimum distance (yellow). See Coastal routing with C-MAP charts.
Statistics tab
- Start and finish, length of the routing and of the route, “Lengthening” (the ratio of the two), engine time and “Wave model”.
- “Sail usage” (with a Sailchart): for each sail, the share of time, the duration and the distance covered.
- “Wind Speed/Angle Distribution”: a cross table of wind strengths (in 5-knot bands) and wind angles, as a percentage of time. It shows at a glance whether the passage will be mostly upwind or downwind, and in what wind.
Ensemble tab
Reserved for ensemble routings: see Ensemble routing.
AI briefing tab
A weather analysis of the routing written by an artificial intelligence: see AI briefing.
Inputs tab
All the calculation parameters: polar and efficiencies, angles, isochrone steps, wind, current and wave GRIBs with their run, percentages, start, route, penalties, engine, zones, limits, sail set. For a routing restarted with “Recalculate”, a header says “Recalculation of the routing of …” and the number of changed inputs, and each changed value shows the old one in brackets (“(was … )”).
In the “Routings” tab, each row also summarises the routing: start, finish, duration, length of the optimal route and its ratio, as a percentage, to the plotted route, date of the calculation.