Ensemble routing
ExpertThe essentials
Ensemble routing starts from an ensemble model, which provides several weather scenarios calculated from slightly different starting conditions. NavimetriX calculates one optimal route per scenario and overlays them: when the routes tighten, the forecast is reliable; when they spread apart, it is uncertain.
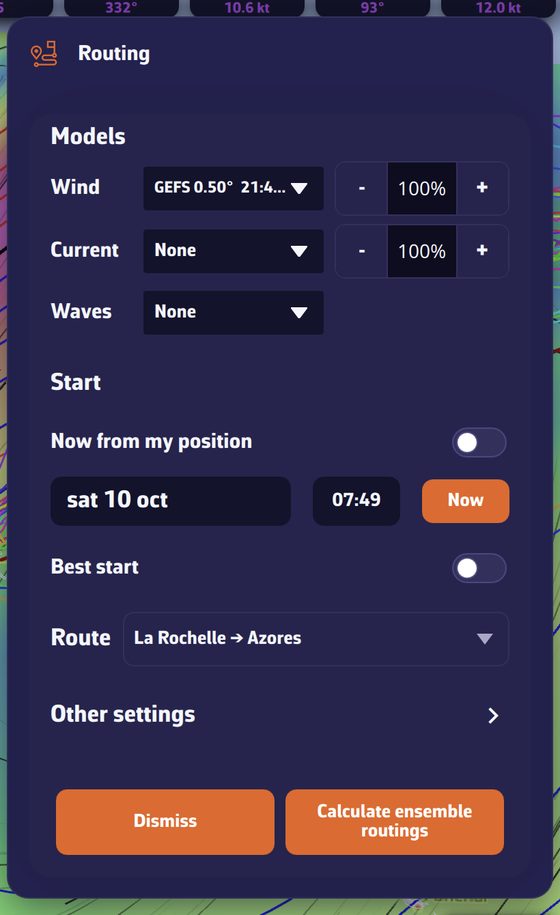 “Routing” window with a GEFS 0.50° GRIB chosen as wind: the bottom button becomes “Calculate ensemble routings”
For an ensemble routing:
- Download a GRIB from an ensemble model: GEFS 0.50° (a control run and 30 members) or ECMWF IFS ENS 0.25° (a control run and 50 members). These models require the Premium subscription.
- Open the “Routing” window and choose this GRIB as the wind. The bottom button becomes “Calculate ensemble routings”.
- Set the start and the route as usual, then start the calculation. An Internet connection is required: each member is downloaded during the calculation.
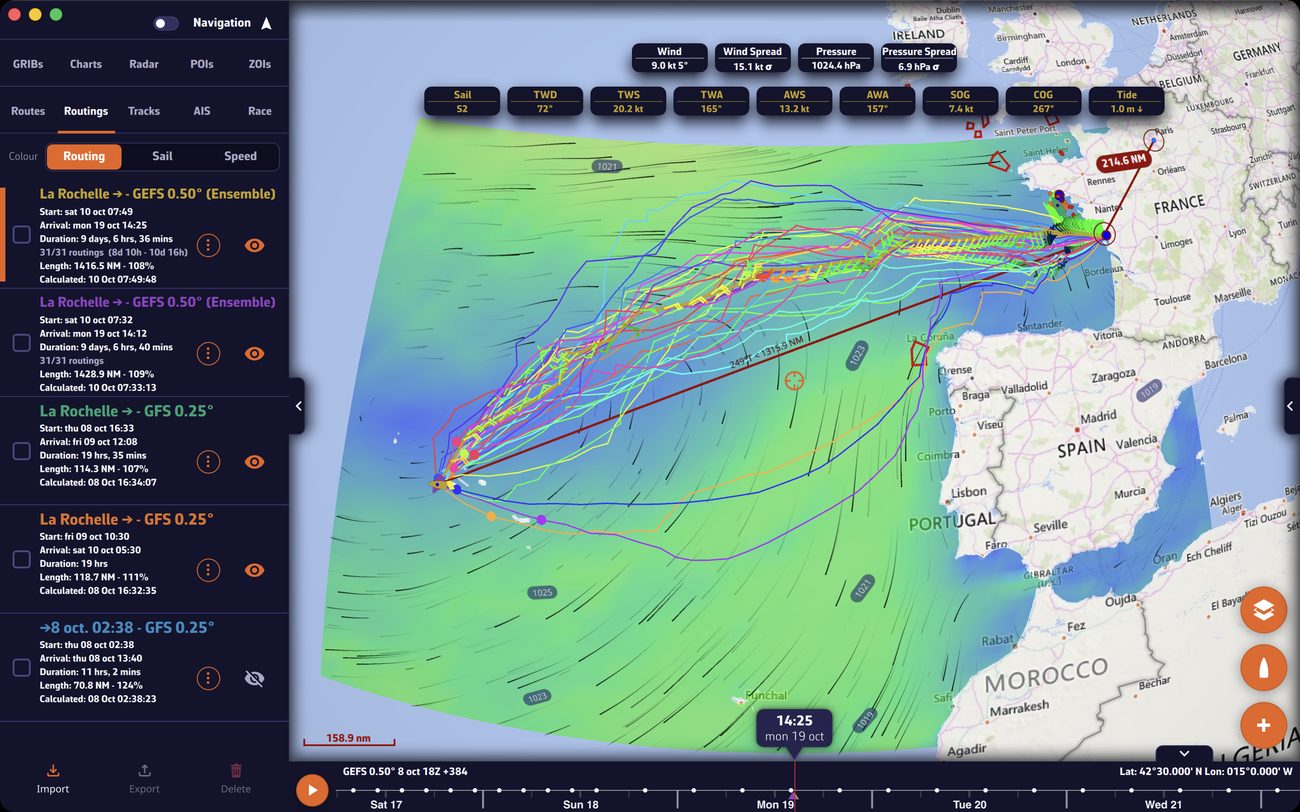 Completed GEFS ensemble routing on a passage from La Rochelle to the Azores: the routes of the 31 members in colour, the members’ dots at the timeline’s time, and the green confidence corridor, and the Routings tab with the “(Ensemble)” row and “31/31 routings”
Going further
How an ensemble routing proceeds
- The app downloads the control run over the area and forecast times of your GRIB, then calculates its optimal route. This is the main routing.
- It downloads then calculates each member, one by one.
- The routes appear on the chart as they are done.
A panel, at the bottom right, tracks progress: “Control run” or “Member 12/30”, the two steps “Download” and “Calculate” with their progress, an overall bar and the number of members “completed”. At the end, a message gives the number of routes calculated.
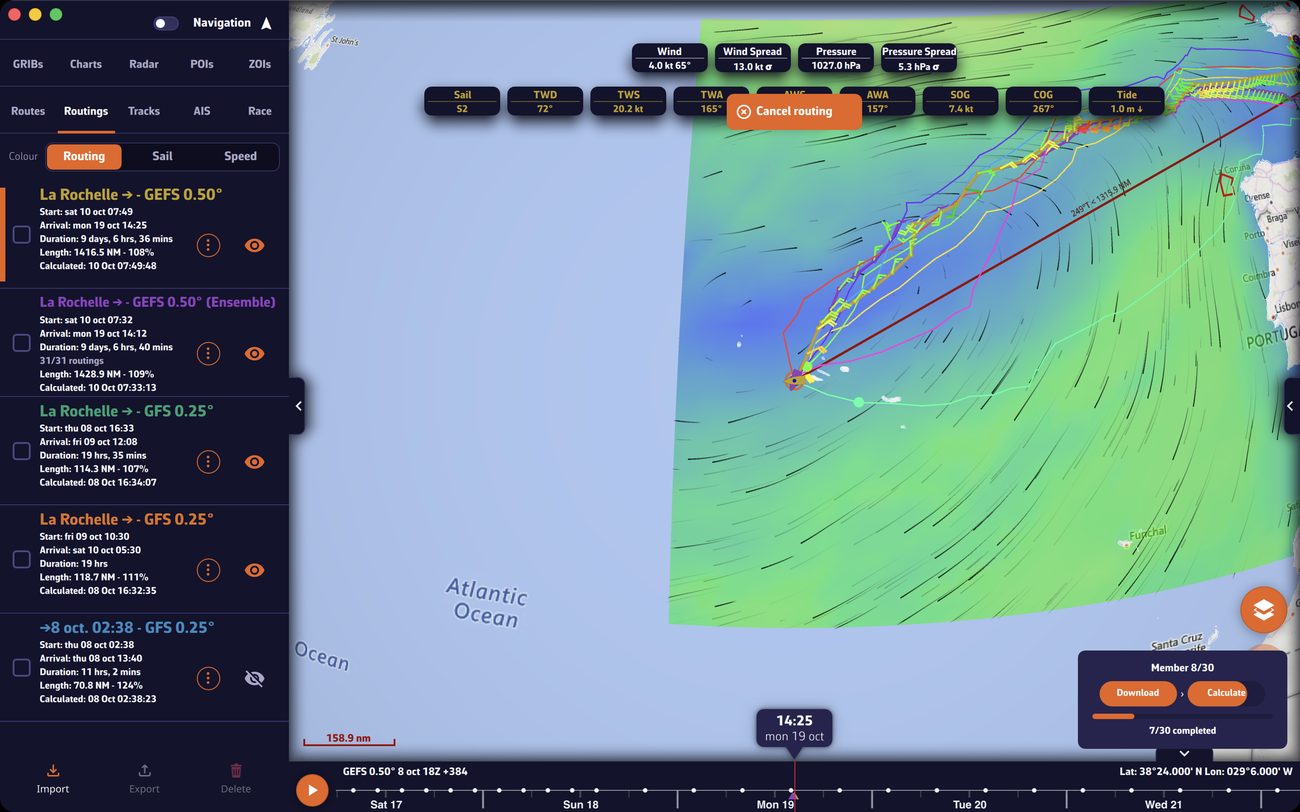 Ensemble routing in progress: the routes of the first members overlay on the chart, and the bottom right panel shows “Member 16/30” with the “Download” and “Calculate” steps
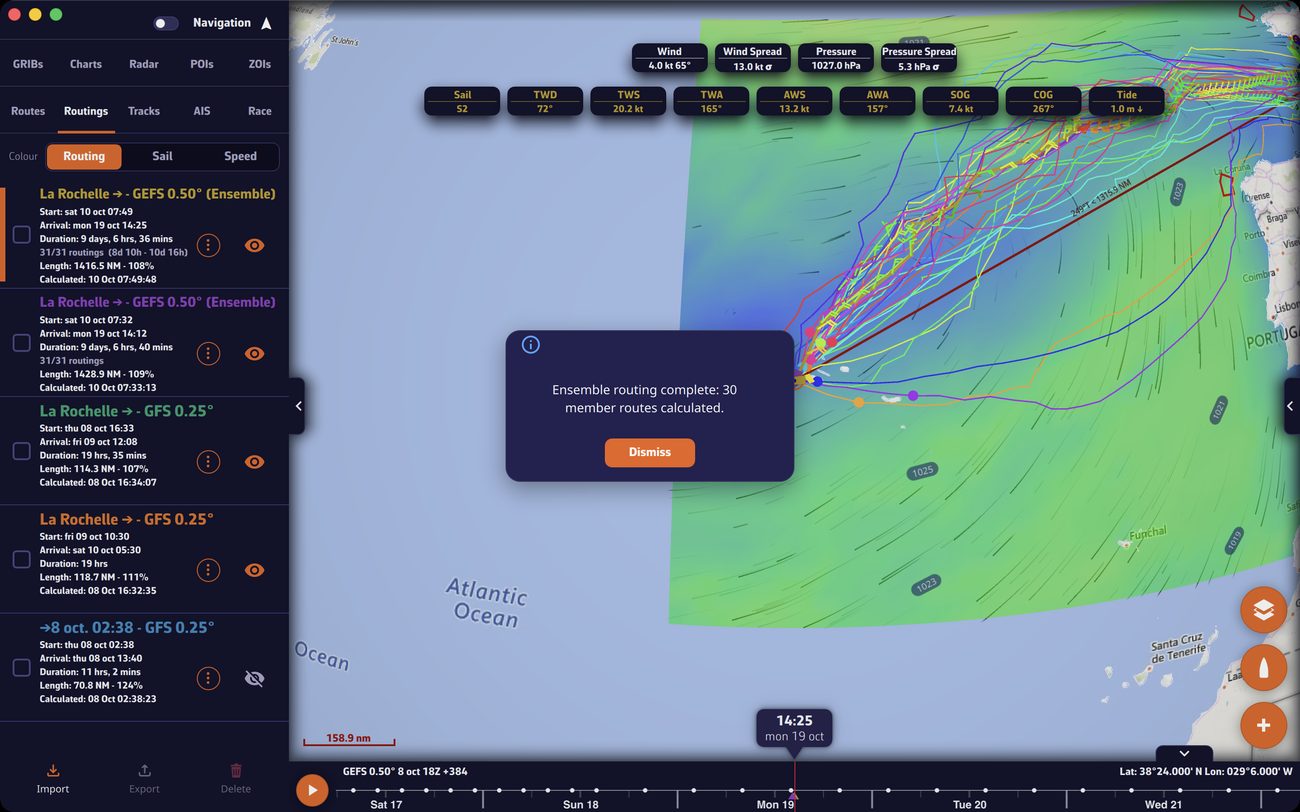 Ensemble routing finished: the members’ routes cover the passage, and a message announces “Ensemble routing complete: 30 member routes calculated.”; the Routings tab shows the “(Ensemble)” row with “31/31 routings”
The “Cancel routing” button, at the top of the chart, stops everything and deletes the ensemble routing in progress (“Ensemble routing cancelled.”).
During the calculation, the app unticks the “Isochrones” checkbox in the layers menu to lighten the display: tick it again afterwards if you want to see isochrones again.
Particularities of the ensemble calculation:
- it does not read the C-MAP chart, even if the coastal routing options are on;
- the route is not polished (see Routing principles and isochrones);
- only one wind row is possible: no multi-GRIB with an ensemble model (see Multi-GRIB routing);
- an ensemble routing cannot be recalculated with “Recalculate”.
Read the result on the chart
- The “spaghetti”: each member is drawn in its own colour, the colours being spread around the whole colour wheel. Tight routes: the optimal route passes through the same place whatever the scenario. Spread routes: it depends strongly on how the weather actually evolves. Two distinct bundles: two scenarios, two strategies.
- The positions: a dot in each member’s colour shows where the boat would be at the timeline’s time. Scroll through time to see the routes diverge.
- The confidence corridor: a semi-transparent green band covers the standard deviation on either side of the mean route (about two routes in three pass through it). Before this calculation, the 20% of members furthest from the mean are discarded, so that an extreme scenario does not distort the corridor. The corridor appears only once the calculation is finished, with at least three members. Over a GRIB displayed in colour, its transparency makes it hard to see: untick “Color map” in the layers menu to make it stand out.
In the “Routings” tab, the routing’s name is followed by “(Ensemble)”, and a row gives the number of routings (for example “31/31 routings”) with the shortest and longest durations.
The Ensemble tab of the details
The routing’s ⋮ menu, “Details”, opens the routing’s details, with an “Ensemble” tab reserved for this type of routing:
- “Ensemble Summary”: the number of “Members”, the share that reached the finish (“Reached Finish”) and the state of the “Control Run” (“Finished”, or its distance to the finish).
- A histogram: the “Sailing Duration Distribution” when more than half of the members arrive, with the earliest and latest arrival times; otherwise the “Distance to Finish Distribution”.
- “Key Statistics”: distance covered (DFS), mean speed over ground (SOG), duration (min, max, mean, median, standard deviation), earliest and latest ETA, duration of the control run against the ensemble mean, remaining distance to the finish (DTF).
- “Wind Conditions”: mean wind, maximum wind, and mean of the members’ maximum winds.
If the control run is clearly faster than the ensemble mean, the “ideal” forecast is probably optimistic. If a good share of the members do not arrive, it is a warning sign.