Instrument types
BeginnerThe essentials
NavimetriX offers 19 instruments. The simplest display a value, the others draw a dial, a curve or a table. Each can be added as many times as you like, in the bar or on the chart (see Instrument bar and instruments on the chart).
- For a specific value (speed, heading, depth…), take a “Numeric value” and choose its data.
- For two related values (wind strength and direction, waypoint distance and bearing…), take a “Dual tile”.
- To read the wind at a glance, take the “Wind dial”, the “Close-hauled wind” or the “Wind plot”.
- To follow a trend, take a “Chart (history)” on the data of your choice.
- To set an instrument, right-click or long-press it.
Many instruments need the data from the boat’s instruments, received over an NMEA connection (Premium subscription). Those that compare your speed with a target also need a polar, the file that gives the boat’s expected speed for each wind strength and angle.
Going further
A few acronyms come up everywhere. TWA, TWS and TWD: true wind angle, speed and direction. AWA and AWS: apparent wind angle and speed, the wind you feel on board. STW: speed through water, measured by the log. SOG and COG: speed and course over ground, given by the GPS. HDG: heading. VMG: velocity made good, the speed of approach along the wind axis. XTE: cross-track error, the lateral distance from the planned route.
Values
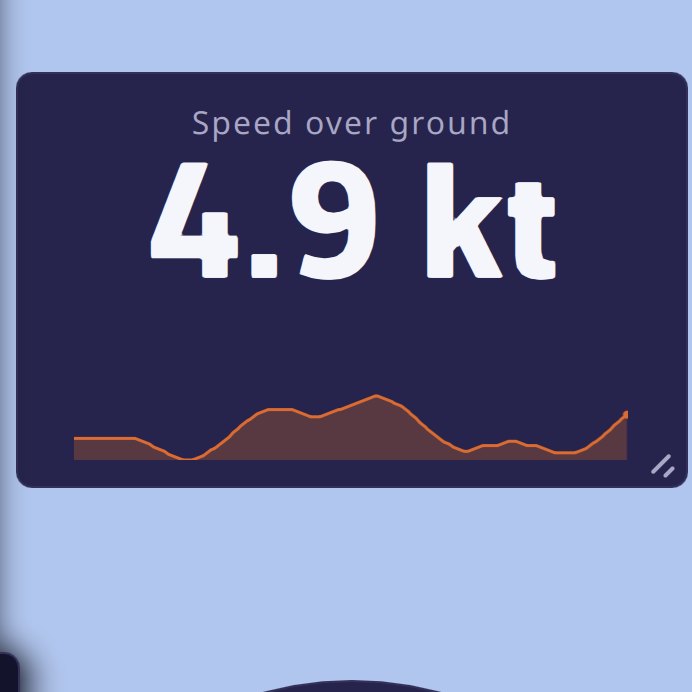 A Numeric value on speed over ground: title, large figure, unit and trend sparkline
Numeric value. A title, a large figure, its unit and, optionally, a trend sparkline. Settings:
- “Displayed data”: one of 47 pieces of data, grouped in families: GPS position and time, route and waypoint (active route, distance, bearing, time, arrival time, VMC, cross-track error), satellites and accuracy, speeds over ground averaged over 5 and 20 minutes, onboard measurements (speed through water, heading, true and apparent wind, VMG, current, depth, rudder angle, water and air temperatures, pressure), performance (target speed and VMG, efficiencies, target upwind and downwind angles and VMG), “Sail” (see Which sail to carry), distance and time to the layline;
- “Mini-graph”: the small curve under the figure, whose duration is set in Settings > Instruments.
Dual tile. Two values in a single tile. The “Contents” setting offers ten pairs: “True wind”, “True wind angle”, “Apparent wind”, “Speed and course over ground”, “Speed through water and heading”, “Current”, “Waypoint”, “Waypoint arrival”, “Layline”, “Depth and water temperature”. It also offers three comparisons with the polar’s target: “STW % of target”, “VMG % of target” and “TWA error to VMG target”. A bar then shows the gap; it turns green when you are within 10% of the target (or 5° for the TWA error), orange beyond.
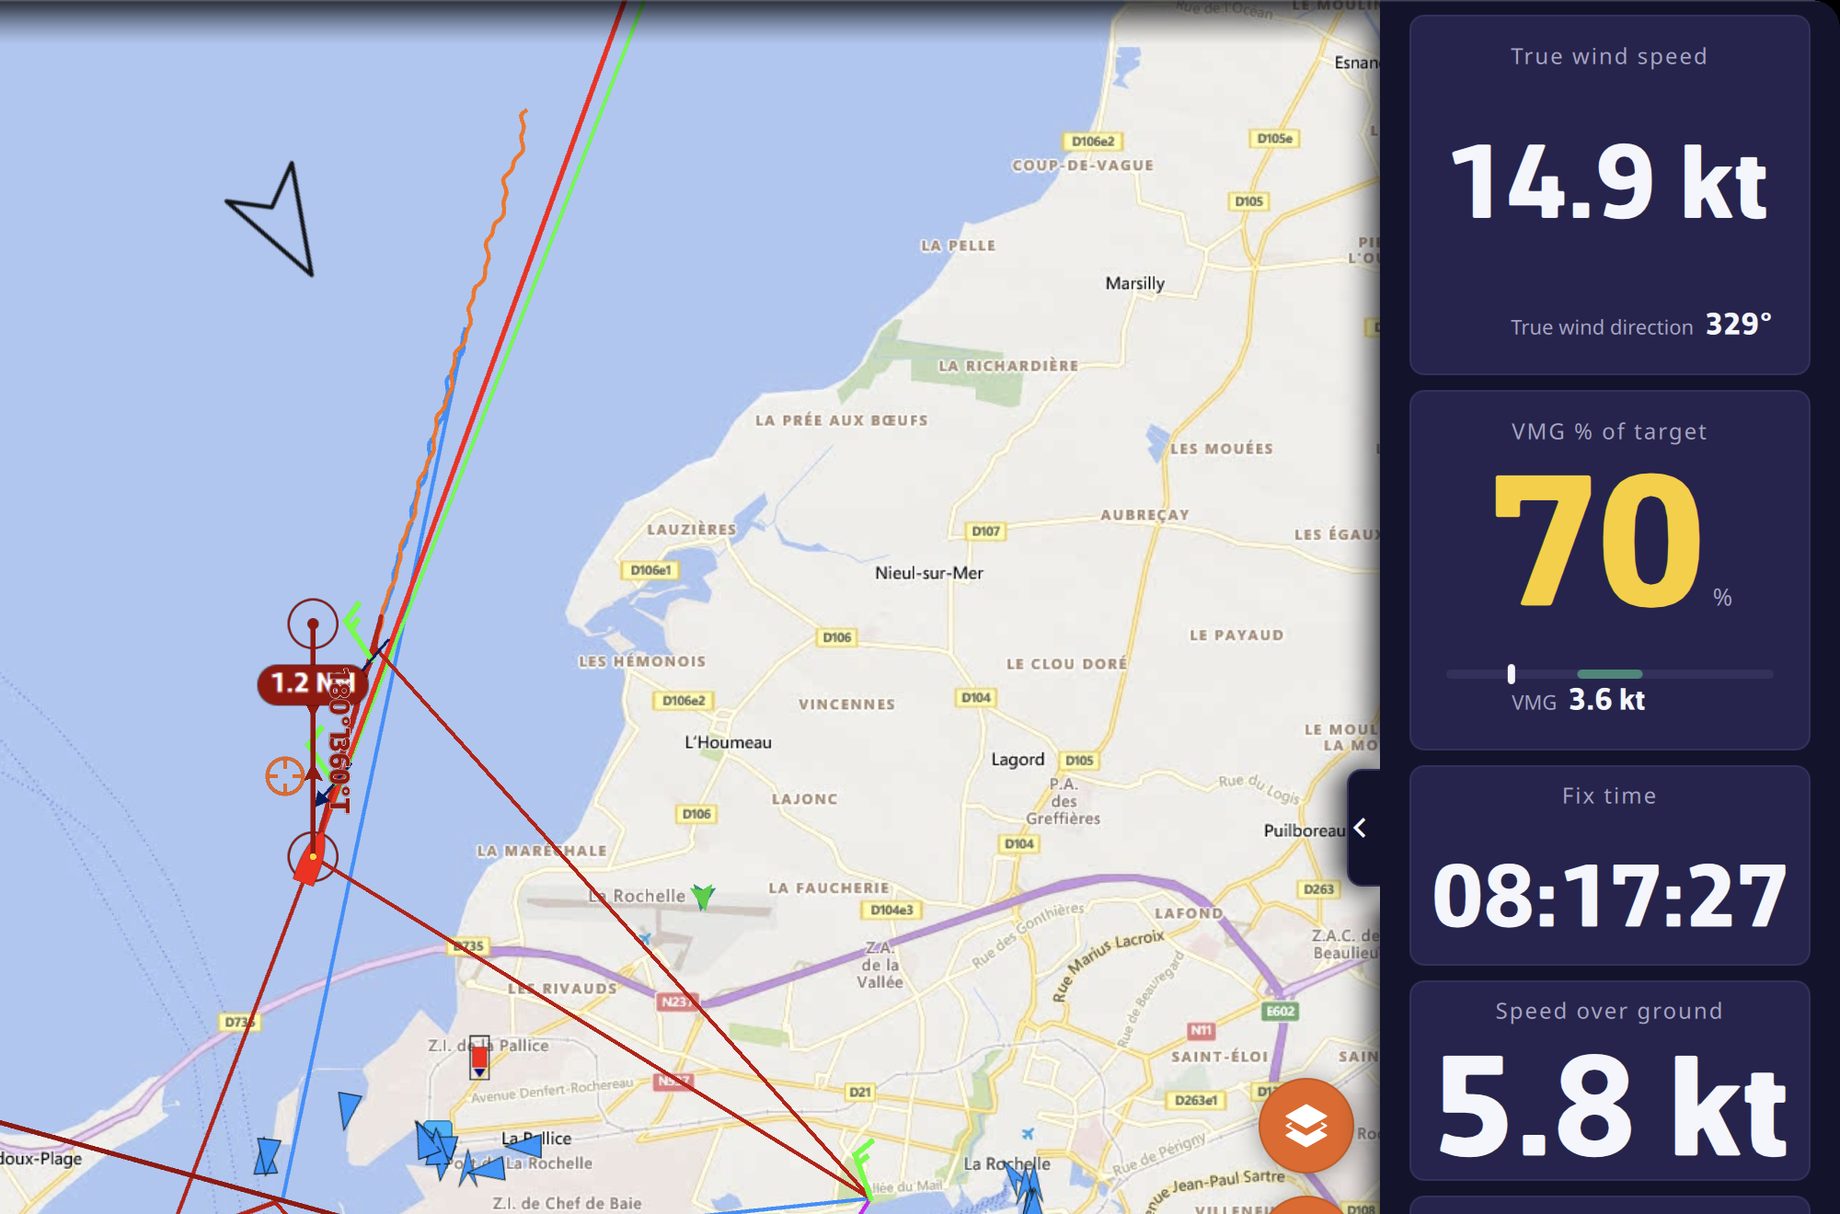 Two Dual tiles at the head of the instrument bar
Wind and heading
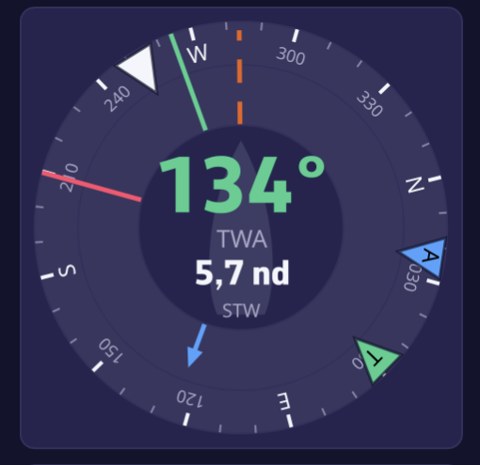 The Wind dial
Wind dial. A compass rose that turns with the boat’s heading. At the center, the true wind angle and the boat speed. On the rose: the true wind arrow, green or red depending on the tack, the apparent wind arrow in blue, the course over ground dotted, the bearing to the waypoint, the current arrow, and the starboard (green) and port (red) laylines when a waypoint is active. Settings: “Wind angle” (TWA or AWA at the center) and “Boat speed” (STW or SOG).
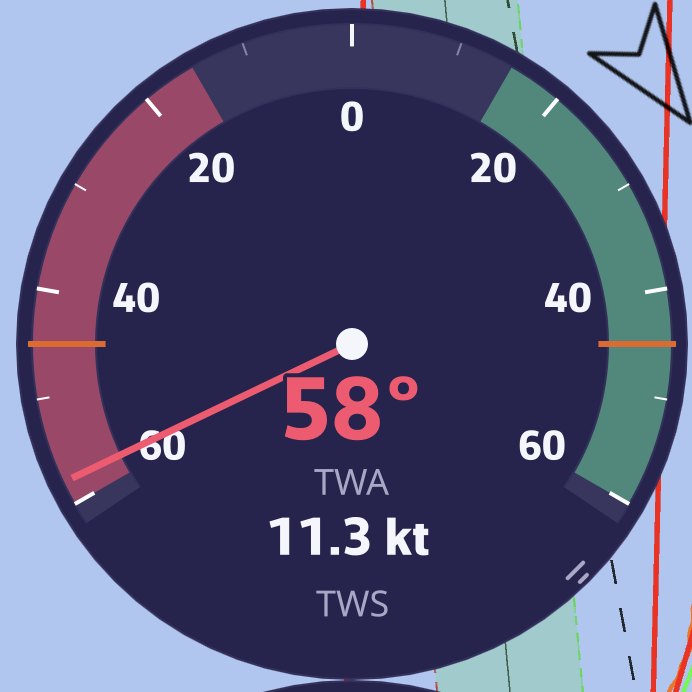 The Close-hauled wind: the wind angle needle on the expanded fan, with the wind angle and speed at the bottom
Close-hauled wind. A ±60° fan on an expanded scale, for steering upwind. The wind angle needle takes the color of the tack; two markers show the optimal upwind angle taken from the polar. At the bottom, the wind angle and speed. Setting: “Wind angle” (TWA or AWA).
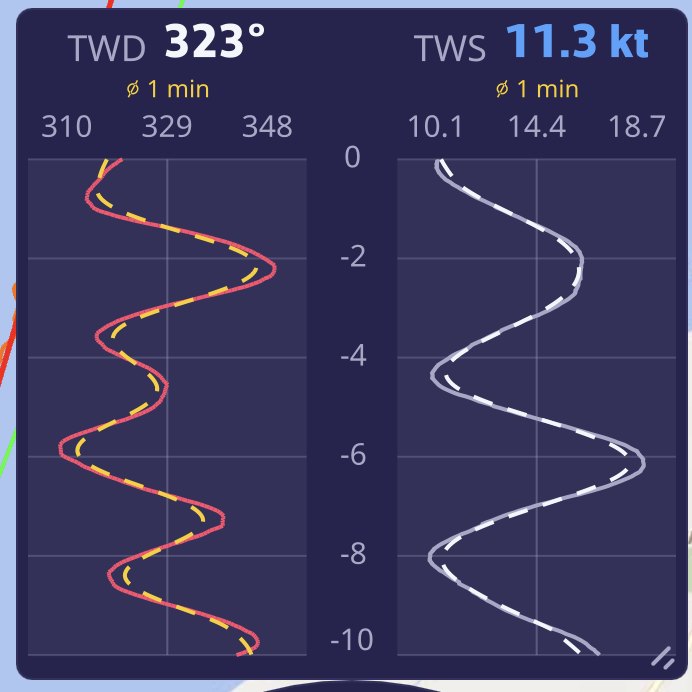 The Wind plot: true wind direction (TWD) and speed (TWS) side by side, with their dotted trend
Wind plot. The histories of the true wind direction (TWD) and speed (TWS), side by side, with their smoothed trend dotted. The direction curve is red when you are on port tack, green on starboard tack. The tile is drawn in columns when it is tall, in stacked strips when it is wide. Settings: “Time window” (5 min, 10 min, 30 min, 1 h or 3 h; 10 min by default) and “Moving average” of the trend (Off, 30 s, 1 min, 5 min or 15 min; 1 min by default). The history is kept when you move or recreate the instrument.
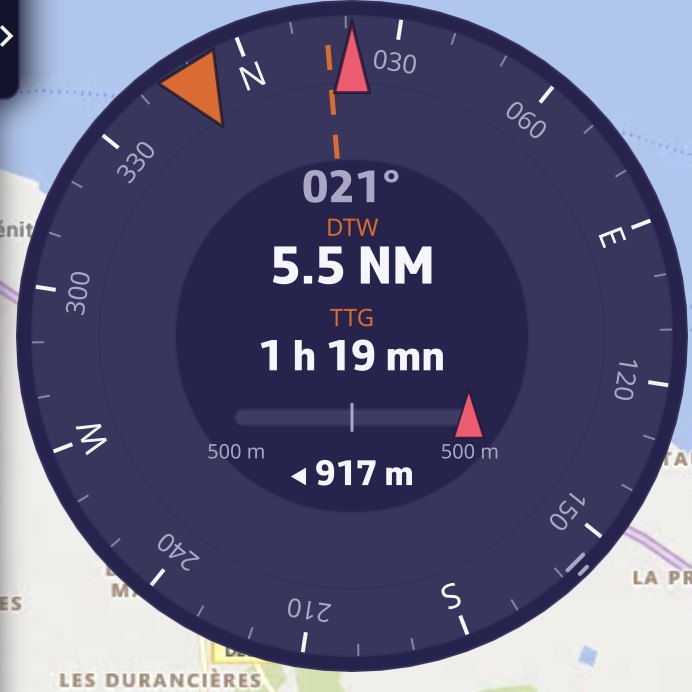 The Steering compass toward a POI: bearing to the waypoint, distance, time remaining and cross-track error bar
Steering compass. A heading-up rose at the top, with a bow marker, the course over ground dotted, the bearing to the waypoint and the laylines. At the center, the heading. When you are heading to a POI or following a route, it also displays the distance (DTW) and time (TTG) to the waypoint, and a cross-track error bar. The scale of this bar is the corridor of the cross-track alarm (500 m if that alarm is not set).
Performance
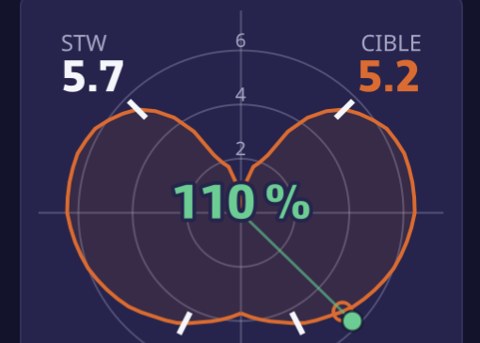 The Polar performance
Polar performance. The curve of your polar for the current wind strength, a dot for your speed and angle (colored by tack), the target on the curve, and at the center the percentage of the target achieved. A polar is required; during a Replay, the curve is that of the polar of the boat that recorded the track, when the track contains it.
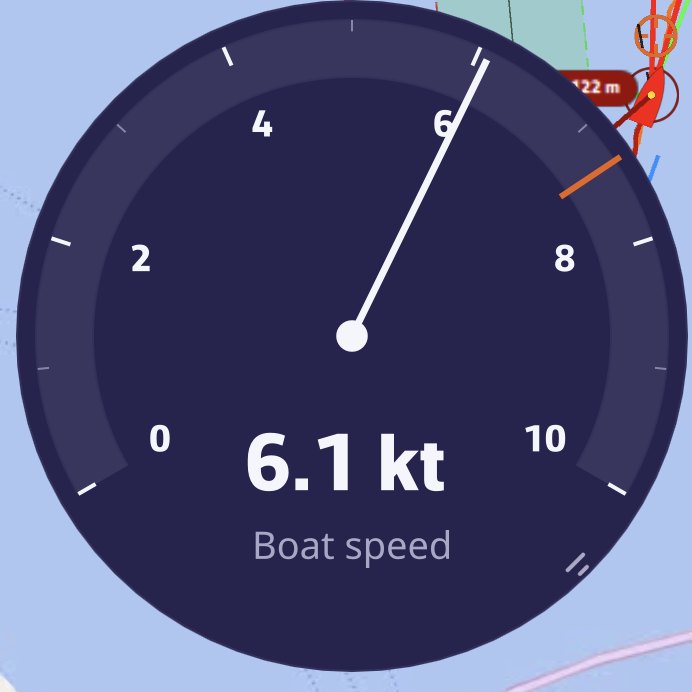 The Needle gauge on boat speed, with the polar’s target speed marker
Needle gauge. A 240° needle meter for a speed of your choice (“Displayed data”: speeds over ground, speed through water, true and apparent winds, VMG, current, VMC, targets). Its scale grows in steps of 5 and never shrinks, to stay steady to the eye. On boat speed, the default value, it takes the speed over ground if the log says nothing, and marks the polar’s target speed.
Sailchart. Your position on the polar’s Sailchart, with the track of the last few minutes. See Which sail to carry.
Course tracking. What remains to be sailed, mark by mark. See Course tracking.
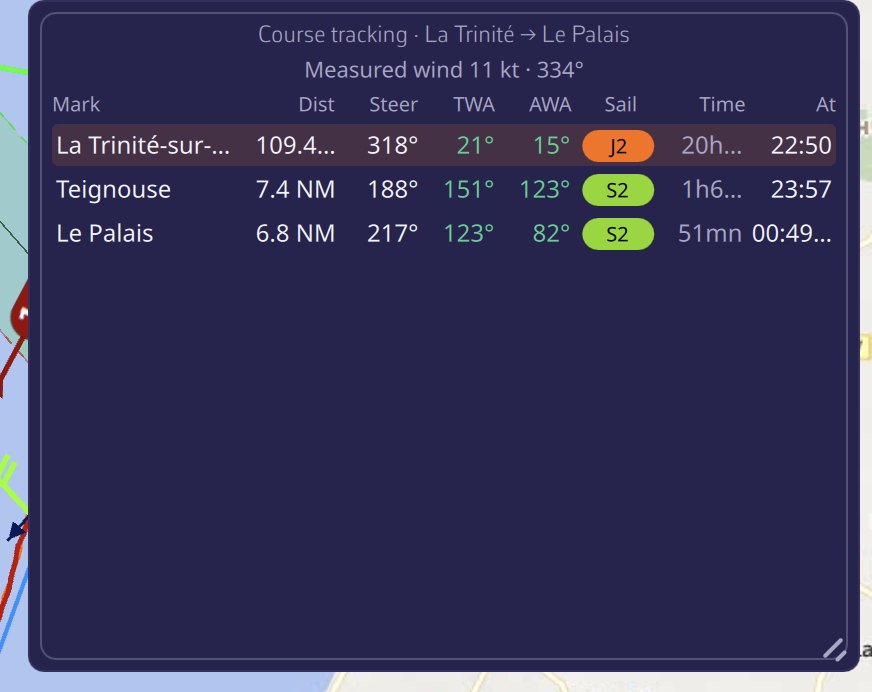 Course tracking: for each mark, the distance, heading, wind angles, sail, duration and time of passage
On board
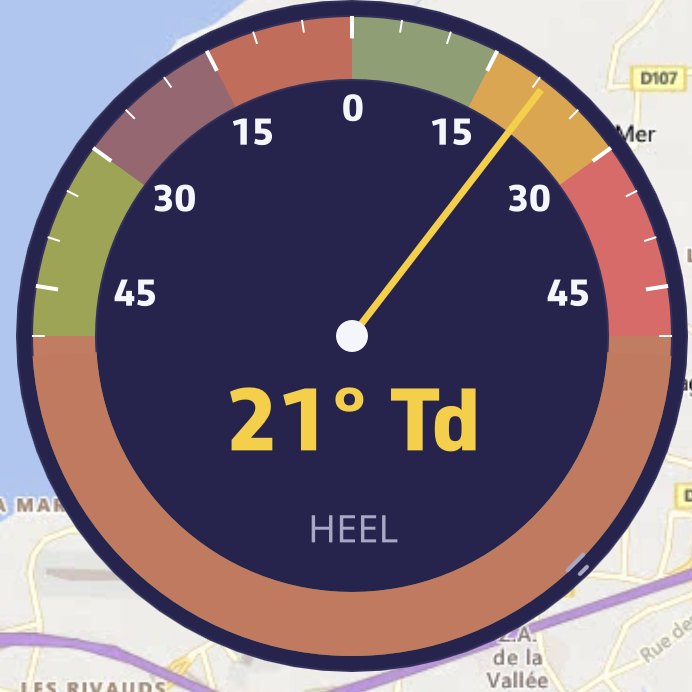 The Clinometer: heel on the ±50° arc and its side, here on starboard tack
Clinometer. Heel on a ±50° arc, with three zones: green up to 15°, orange from 15 to 30°, red beyond. The value is followed by the side. It reads the heel sent by the instruments, or failing that the roll.
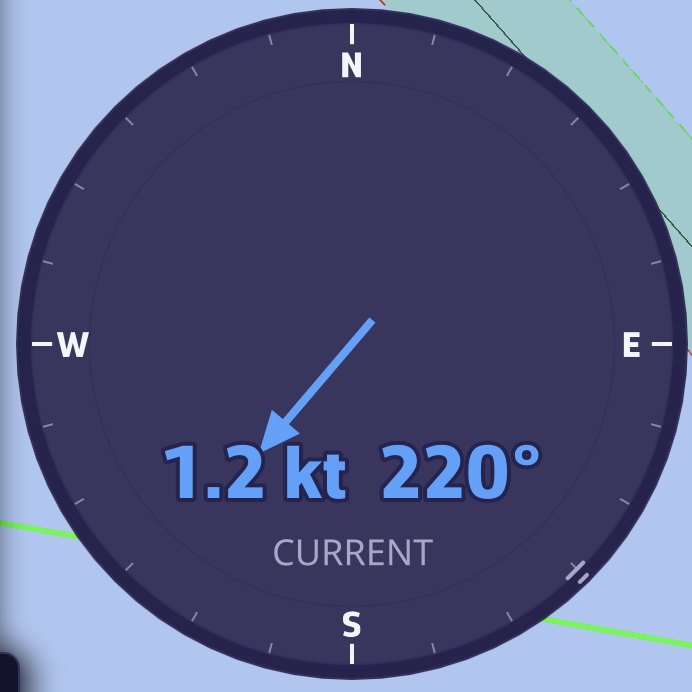 The Current rose: 1.2 kt at 220°, the arrow shows where the current is setting
Current rose. A north-up rose; the arrow shows where the current is setting, its length follows its speed. Speed and direction are written at the center.
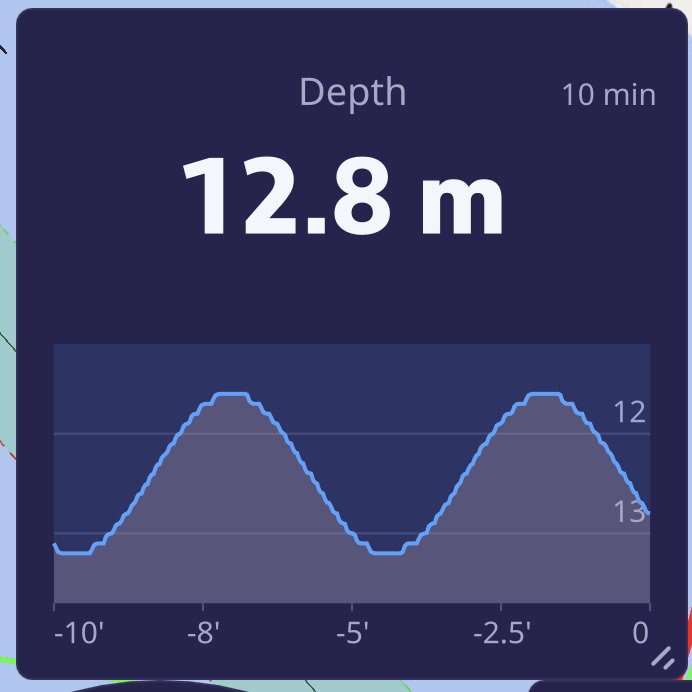 The Chart on depth, in depth sounder style: 13.1 m and the curve of the last 10 minutes
Chart (history). The curve over time of any numeric data. Settings:
- “Displayed data”: depth by default, with then a depth sounder rendering (bottom, water column, draft);
- “Time window”: 5 min, 10 min (default), 30 min, 1 h or 3 h;
- “Moving average”: Off (default), 30 s, 1 min, 5 min or 15 min;
- “Marker”: a horizontal reference line. “Auto” chooses it according to the data (draft for depth, alarm threshold for wind, 1013 hPa for pressure, 100% for efficiencies); “Manual” lets you enter the value;
- “Curve color”: remembered for each data and shared by all your devices.
The history, taken every 2 seconds over 3 hours, survives restarts. The tile is laid out according to its shape: horizontal plot when it is wide or square, vertical when it is tall.
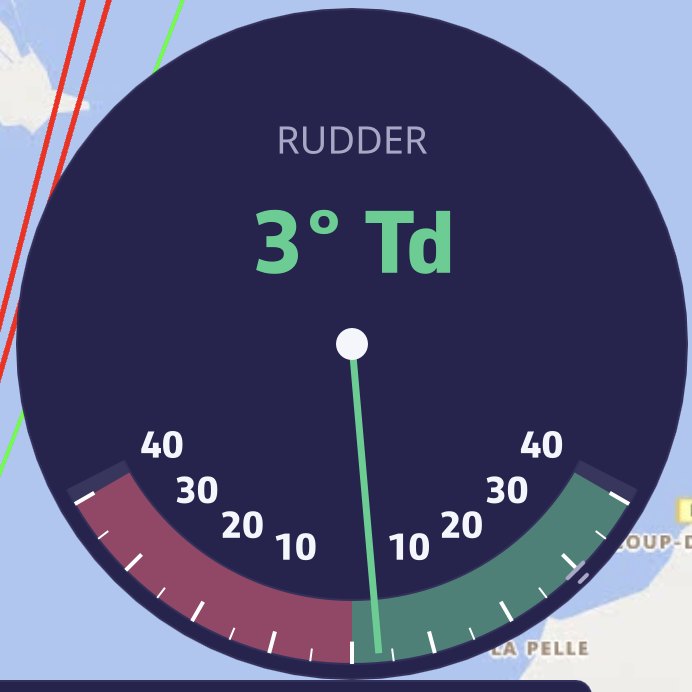 The Rudder angle: 1° to starboard on the ±40° arc
Rudder angle. A ±40° arc, port in red on the left, starboard in green on the right. It needs a rudder angle sensor (NMEA RSA or XDR sentence).
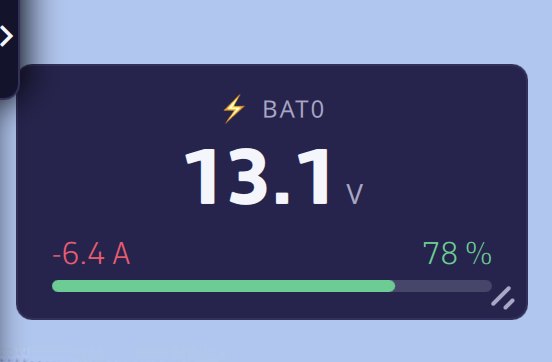 The Energy tile: voltage, discharge current and state of charge of the bank
Energy (battery). The voltage, current (negative when discharging) and state of charge of a battery bank, received through NMEA XDR sentences. “Battery bank” setting: “Automatic” (the first bank received) or a specific bank.
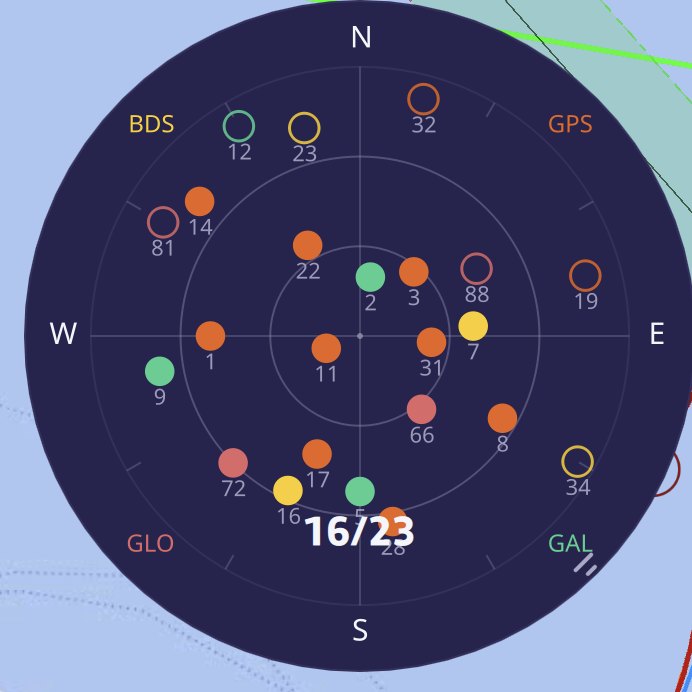 The GNSS satellites: 16 satellites used out of 23 in view, GPS, GLONASS, Galileo and BeiDou
GNSS satellites. The sky map of visible satellites, zenith at the center, horizon at the edge. Each dot takes the color of its constellation (GPS, GLONASS, Galileo, BeiDou, QZSS); it is solid if it is used to compute the position. Satellites come from an NMEA GPS, or from the internal GPS on Android. iOS does not publish them, and a computer has no receiver.
Barometer and Barograph. Pressure and how it changes, see Barometer and barograph.
AIS fleet. The scale of the fleet you follow in the AIS tab. See AIS fleets.
When an instrument stays empty
A dash or an empty dial means the data is not arriving: no NMEA connection, sensor missing, or Navigation mode off. Comparisons with the target stay empty without a polar. To check what the app is receiving, see Navigation: GPS, NMEA and AIS.