The Layers Menu
BeginnerThe essentials
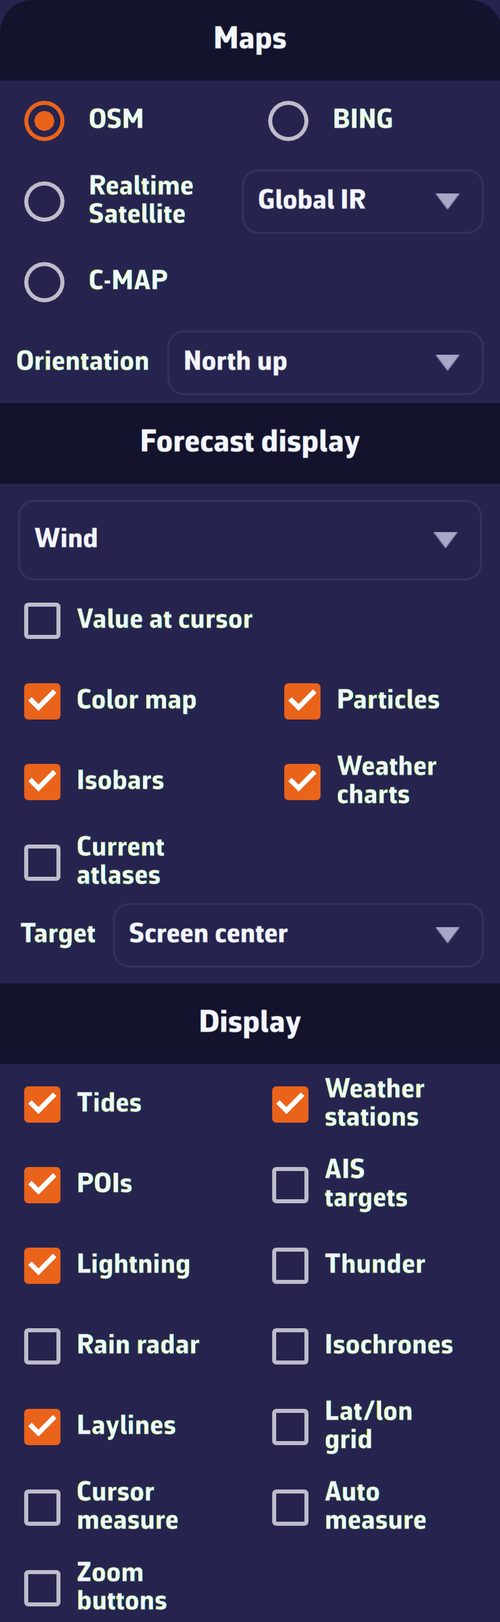 The layers menu with a wind GRIB loaded
The round layers button  , at the bottom right of the chart, opens a menu in three parts: “Maps” (the chart background and orientation), “Forecast display” (the displayed weather parameter and its drawing mode, the weather charts, the current atlases and the target) and “Display” (the layers placed on the chart).
- Press the layers button.
- Choose the chart background, then tick the layers to display.
- Press the button again, or tap the chart, to close the menu.
Going further
Maps
- OSM (default): map of land and coastline; BING: satellite imagery (aerial photographs).
- Realtime Satellite: recent infrared images from weather satellites, showing cloud cover. The neighbouring list chooses the source: “Global IR”, “High Res IR” (default) or “NOAA IR”. The choice is remembered.
- Geogarage: the nautical charts of your Geogarage subscription. The line only appears once you are signed in to a Geogarage account; the neighbouring list chooses the layer.
- C-MAP: the C-MAP DISCOVER X and REVEAL X nautical charts purchased on your C-MAP account. When the C-MAP chart is displayed, three icon buttons appear on its line: satellite imagery, shaded relief and high-resolution bathymetry. Satellite and relief exclude each other and only work with REVEAL X charts; the menu says so when your charts do not have them.
The chosen chart background is specific to each device. Details of the nautical charts are in the chapter Charts.
Orientation
The “Orientation” list chooses what is at the top of the screen:
- “North up” (default);
- “Course up (COG)”: the course over ground, the real direction of travel over the ground;
- “Heading up (HDG)”: the heading, the direction the bow is pointing;
- “Waypoint up (BTW)”: the bearing to the target waypoint.
Without a valid value (no position, no heading, no active waypoint), the chart returns to north up. This setting is specific to each device.
Forecast display
The first lines concern the displayed GRIB: without a GRIB, they are greyed out or absent. “Weather charts”, “Current atlases” and “Target” remain available without a GRIB.
- The parameter list: wind, gusts, pressure, waves… depending on the file’s content. It chooses the parameter drawn on the chart.
- Value at cursor (computer only): shows the parameter’s value under the mouse.
- Color map: colours the chart according to the parameter’s value.
- Particles or Barbs for wind and gusts, Arrows for currents, waves and pressure: the box shows the mode actually drawn. The choice between particles and barbs is made in Settings > “Forecast display”. In power saving, the chart always draws barbs (and arrows for currents).
- Isobars: the lines of equal pressure, if the GRIB contains pressure.
- Weather charts: the charts from the weather services chosen in the Charts tab of the left drawer (isobars and fronts drawn).
- Current atlases: the tidal currents from the atlases.
The target
The “Target” line chooses the point whose weather the pills at the top of the screen give, and which “Route to the target” and the coordinates shown in the timeline aim at:
- “Disabled”: no target, and no value pills;
- “Screen center” (default): the centre of the chart;
- “GPS position”: the boat’s position;
- then your visible POIs, in alphabetical order: the target stays on that POI when you move the chart.
A reticle marks the target on the chart. The target does not depend on the GRIB: the line stays active even with no weather loaded.
Display
| Box | What it displays |
|---|---|
| Tides | the tidal ports and their water height at the timeline’s time |
| Weather stations | observations from weather stations ashore and at sea |
| POIs | your points of interest |
| AIS targets | the vessels received by AIS (Premium subscription, or DEMO mode) |
| Lightning | recent lightning strikes |
| Thunder | a thunder sound when a strike lands in the visible part of the chart (box active if “Lightning” is ticked) |
| Rain radar | precipitation measured by weather radars |
| Isochrones | the isochrones of the displayed routings: the lines the boat can reach after the same time |
| Laylines | the laylines: the courses at the polar’s optimal angle, upwind or downwind depending on the boat’s point of sail, port and starboard tack, that lead to the waypoint |
| Lat/lon grid | the grid of latitudes and longitudes |
| Cursor measure | (computer) the boat’s distance, bearing and time to the point under the mouse |
| Auto measure | on each tap on the chart, a ruler from the boat to the centre of the screen, with distance, bearing and time to get there; it disappears after two seconds without a gesture |
| Zoom buttons | the “−” and “+” buttons at the bottom left of the chart |
The time given by the measures is calculated from the speed of approach to the point, derived from the damped speed and course over ground (30 s by default, “Laylines and waypoint” damping setting); it is not displayed if the boat closes on the point at less than 0.3 knot (boat stopped, abeam or moving away) nor if it would take more than 99 h.
Each layer has its chapter: Weather: observations, charts and tides, Weather routing, Navigation: GPS, NMEA and AIS.
See also
- The main screen
- Chart backgrounds and orientation
- Display forecasts on the chart
- Observation layers: tides, weather stations, lightning, rain radar, weather charts, satellite images
- FAQ: How do I choose the weather parameter to display on the chart?
- FAQ: How do I set the target position?
- FAQ: Could you describe the user interface?