User Guide
NavimetriX Guide
The complete NavimetriX guide, feature by feature: weather, charts, routing, navigation, instruments, tracks. Each page starts with the essentials and then goes further.
Version 2.0.165 · October 30, 2026
navimetrix.com

Table of Contents

1 Installation, Account and Subscription
2 Getting Started and Interface
3 Settings
4 Weather: GRIB files and forecasts
5 Weather: observations, charts and tides
6 Charts and maps
7 POIs, Routes and ZOIs
8 Polars and Sailchart
9 Weather routing
10 Navigation: GPS, NMEA and AIS
11 Instruments
12 Safety: alarms, man overboard, anchoring
13 Tracks, Replay and Logbook
14 Racing, Fleets and Remote Tracking
15 Help and troubleshooting

↑ Contents

1 Installation, Account and Subscription

This chapter covers everything that comes before your first passage: the devices NavimetriX runs on, installation and updates, the Premium subscription and what it adds to the free version, the NavimetriX account that links your devices and what it synchronizes, and finally the version that opens in a browser.

1.1 Platforms and Installation

Beginner

The essentials

NavimetriX runs on phones, tablets and computers: iPhone and iPad, Android, Mac, Windows and Linux PCs. There is also a version that opens in a web browser. The same NavimetriX account works on all these devices.

  1. Download the app from the site’s home page: App Store (iPhone, iPad and Mac), Google Play (Android), Windows installer or Linux AppImage (a single file that runs without installation).
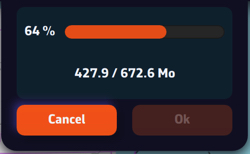
  2. At first launch, the “Welcome to NavimetriX” window announces the download of the base data, about 400 MB. Press “Get Started”.
  3. Keep NavimetriX open during this download: switching to another app or letting the device go to sleep can interrupt it.
  4. At the end, press “Start Using NavimetriX”. The “View Quick Start Guide” button opens the Quick Start.

“Setting up NavimetriX” window during the base data download: progress bar and downloaded volume“Setting up NavimetriX” window during the base data download: progress bar and downloaded volume

Going further

Minimum versions

PlatformMinimum versionNotes
macOS13 (Ventura)Intel Macs and Apple silicon Macs
WindowsWindows 10 version 1809 (build 17763)Windows 11 included
LinuxAppImagetwo versions: x86_64 (PC) and aarch64 (64-bit ARM)
Android9 (API 28)64-bit ARM processor devices only
iOS and iPadOS16iPhone and iPad

These versions are a minimum. They do not guarantee that the app runs well on an old device: memory and graphics processor also matter.

First launch

  • The app’s language follows the system’s if it is French, English, German or Spanish; otherwise, the app starts in English. It can then be changed in the General settings.
  • The base data (about 400 MB) requires an Internet connection. The window shows the file in progress and the total downloaded.
  • In case of an error, the “Installation Error” window shows the reason and offers “Retry” or “Abort”.

Updates

  • At launch, NavimetriX compares its version with the latest published for your platform. If a more recent one exists, it displays “A new version is available. Would you like to update your version?” Accepting opens the site’s download page.
  • After an update, the “What’s new” window lists what changes in the installed version. It is not displayed at the very first launch. The full history is in Settings > “About” > “Version history”.

Windows

  • On the site’s home page, the “Get it from Microsoft” badge directly downloads the NavimetrixSetup_<version>.exe installer from navimetrix.com. There is no need to go through the Microsoft Store app.
  • To update, download the new installer and run it.
  • The installer is signed. If Windows SmartScreen or an antivirus still blocks the installation, or if Windows 11 displays error 4551 (Smart App Control), follow the FAQ pages listed below.
  • The installer opens in the Windows firewall the ports used to receive NMEA data over the network (NMEA: the format of onboard instrument data). Uninstalling removes these rules.

Uninstall completely

  • Windows: uninstall NavimetriX from Settings > Apps > Installed apps. The uninstaller also deletes the data folder %LOCALAPPDATA%\Soft4Sail\NavimetriX, the C-MAP data, the app’s registry key and its firewall rules.
  • macOS: the app stores its data in its container, ~/Library/Containers/navimetrix.soft4sail.com (the Finder shows it under the name “NavimetriX”). Moving the app to the trash does not delete this folder: delete it too for a complete uninstall.
  • What is synchronized with your NavimetriX account is not lost: you get it back by signing in again. See Sync between devices.

See also

↑ Contents

1.2 Premium Subscription

Beginner

The essentials

NavimetriX can be used without a subscription, with limits: forecasts from the GFS model only, routing limited to 2 days, no Navigation mode and no onboard data. The Premium subscription opens the whole app and the NavimetriX account that synchronizes your devices. It is annual, with automatic renewal.

  1. Press the round orange button with the shopping cart Subscription button, at the top right of the chart. It only appears as long as the device is not subscribed. Another way in: Settings > “Premium Subscription”.
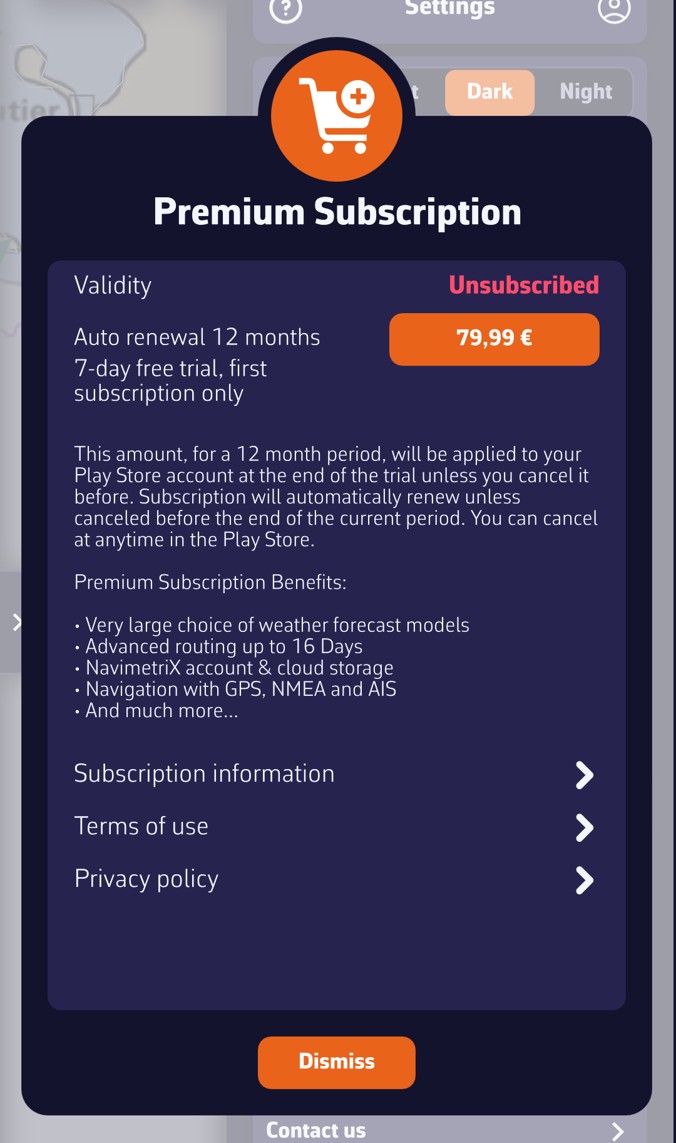
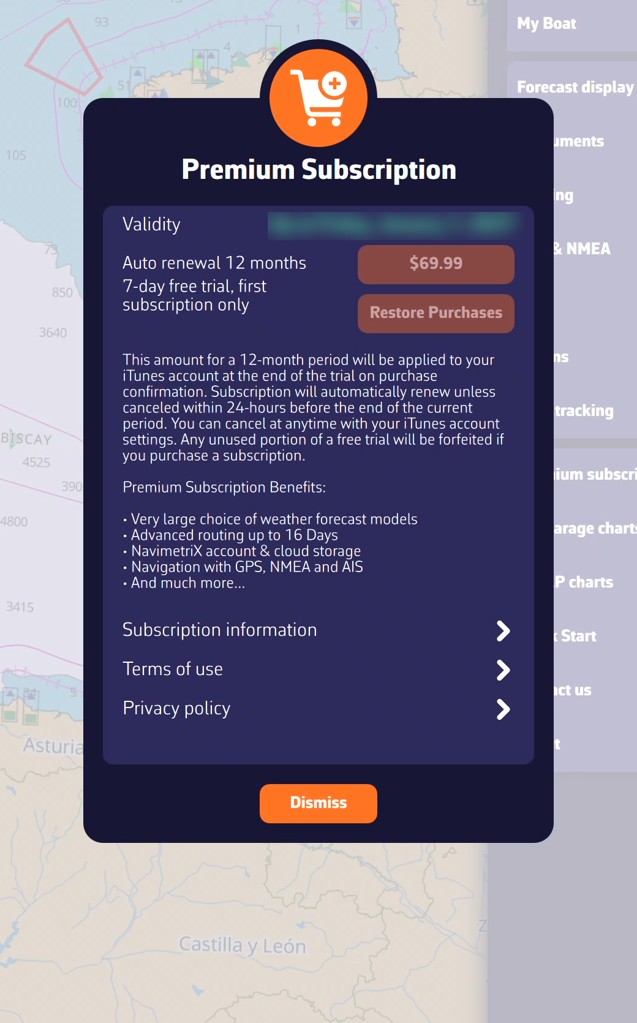
  2. In the “Premium Subscription” window, press the button that shows the price. The purchase goes through the App Store (iPhone, iPad, Mac) or Google Play (Android). The price comes from that store and is displayed in the currency of your store’s country (for example €79.99 in France on Google Play, at the time of the screenshot below). On Windows, Linux and in the browser, the purchase is made from the mobile apps.
  3. Then create your NavimetriX account on that same device and sign in to it, then sign in to that account on your other devices: the subscription is recognised there. See NavimetriX account.

“Premium Subscription” window on Android, device not subscribed: validity “Unsubscribed”, price button (€79.99 in this example), 7-day free trial, subscription information“Premium Subscription” window on Android, device not subscribed: validity “Unsubscribed”, price button (€79.99 in this example), 7-day free trial, subscription information

“Premium Subscription” window on iPad, active subscription: the validity shows the subscription end date (blurred here), the price button is greyed out and “Restore Purchases” remains available; here the price is in dollars, because the device’s store is American“Premium Subscription” window on iPad, active subscription: the validity shows the subscription end date (blurred here), the price button is greyed out and “Restore Purchases” remains available; here the price is in dollars, because the device’s store is American

Going further

Free version and Premium version

Without a subscription, you keep in particular the chart and its layers, POIs (points of interest), routes and ZOIs (zones of interest), atmospheric GFS model GRIBs, worldwide (a GRIB is a weather forecast file) and weather routing up to 2 days. Beyond that, the calculation stops with the message “Routing calculation stopped as we reached the routing max duration of 2 days for non Premium users”.

The following are reserved for the Premium subscription:

  • weather: all models other than GFS, regional models, wave and current GRIBs, and historical weather (“Load historical GRIB”);
  • routing beyond 2 days: the maximum duration can then be set from 1 to 30 days (Settings > “Routing” > “Maximum duration”), within the limit of the GRIB’s duration;
  • the AI briefing of a routing, which also requires an Internet connection and a signed-in account;
  • Navigation mode: track recording and alarms (see Operating modes);
  • onboard data: NMEA reception (the format of instrument data), DEMO mode included;
  • AIS (the automatic identification system for vessels): display of targets, AIS over the Internet, sharing your position;
  • the settings pages “Instruments” and “AIS”;
  • the anchor alarm (“Drop anchor”) and its SMS alert;
  • the NavimetriX account: creating it, synchronization between devices and uploading tracks to the account.

Without a subscription, Navigation mode, turning on NMEA reception (DEMO mode included), “Drop anchor” and the “Instruments” and “AIS” settings pages open the “Premium Feature” window: “This function requires a valid Premium subscription.” The “Subscribe” button leads to the subscription window. Elsewhere, the app reacts differently: reserved models do not appear in the list, the AI briefing button stays greyed out, and historical weather and routing beyond 2 days stop with a message.

The subscription does not include nautical charts: Geogarage charts and C-MAP charts are purchased separately (see the chapter Charts).

The “Premium Subscription” window

  • Validity: “Unsubscribed” without a subscription, “Until” followed by the expiry date, or “Expired”. The date used is the furthest between the purchase made on the device and the subscription held by your account.
  • The price button: the price comes from your device’s store (App Store or Google Play), in the currency of that store’s country. It is greyed out when the subscription is valid.
  • Restore Purchases (iPhone, iPad, Mac): retrieves a subscription already taken with the same Apple ID, after a reinstall for example.
  • Automatic 12-month renewal.
  • 7-day free trial, on first subscription only. The trial is only granted once: per Google account on Android, per Apple ID on iPhone, iPad and Mac. If you have already had it, the subscription is charged from the moment you subscribe.

Subscribe from a Windows or Linux PC or a browser

In-app purchase only exists on iPhone, iPad, Mac and Android. On Windows, Linux and in the browser, the subscription window explains this: take the subscription on a phone, a tablet or a Mac, create your account on that device, then sign in to that account on the PC. The subscription is then shared.

The device that made the purchase passes the expiry date to the server once the account is signed in on that device. After a renewal, launch the app on that device so that your other devices see the new expiry date.

Cancel

Cancellation is done outside the app, in the store that collected the subscription: your Apple account settings (iPhone, iPad, Mac) or Google Play (Android). For a first subscription, cancel before the end of the 7-day trial if you do not want to be charged.

Share the subscription

The NavimetriX account shares the subscription between all your devices, whatever their platform. Family sharing between different Apple IDs or Google accounts is set up in the store: see the two FAQ pages below.

See also

↑ Contents

1.3 NavimetriX Account

Beginner

The essentials

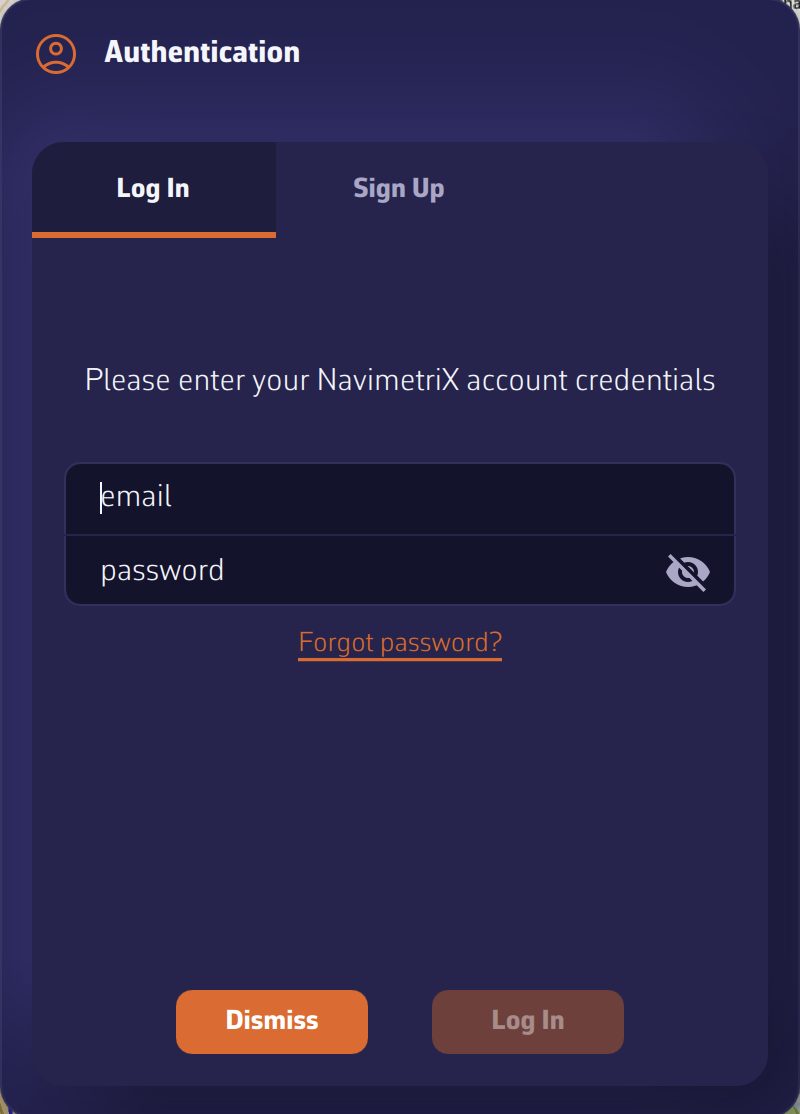
The “Authentication” window, “Log In” tab, with the “Forgot password?” linkThe “Authentication” window, “Log In” tab, with the “Forgot password?” link

The NavimetriX account links your devices: it carries your Premium subscription and synchronizes your settings, routes, POIs (points of interest), routings and tracks. Creating it is reserved for Premium subscribers and is done on the device that took the subscription. Signing in, however, works on all devices.

  1. Open the Settings with the chevron handle on the right edge of the screen.
  2. Press the person icon Account icon, to the right of the “Settings” title. The “Authentication” window opens.
  3. To create the account: “Sign Up” tab, enter your email address and a password twice, press “Request Code”, enter the code received by email, then press “Sign Up”.
  4. To sign in: “Log In” tab, enter the account’s email address and password, then press “Log In”.

Going further

Create the account

  • On a device without a valid subscription, the “Sign Up” tab shows “Premium Required” and “Account creation is available for Premium subscribers only.” The “Upgrade to Premium” button opens the subscription window. See Premium subscription.
  • “Request Code” only becomes active once the address is valid and the two passwords are identical. The code arrives by email; if you do not see it, check your junk mail (spam). Enter it in the “# code” field.
  • Once the account is created, sign in in the “Log In” tab. Creating the account does not open the session by itself.

Sign in

  • If the address or password do not match any account, the app says so and offers to create an account or try again.
  • The message “Unable to reach the server” signals a network problem: check the Internet connection or firewall, or try from another network (a phone hotspot, for example).
  • Once signed in, the person icon opens a small menu: “Logout” and “Delete Account”. On a computer, its tooltip reads “My account” or “Logout”.

Forgot password

  1. In the “Log In” tab, press “Forgot password?”, under the password field. The “Reset password” tab opens.
  2. Enter your email address and press “Request Reset”. The message “If an account exists for this email, you will receive instructions to reset your password.” is displayed, whether or not the address exists.
  3. Enter the code received by email in “reset code”, then the new password twice, and press “Reset”.

Resetting does not require a subscription: it works from any device.

Session expired

If the account’s password has been changed on another device, the server rejects the one the device had kept. At launch, the app then displays “Your session has expired: the password of your account was probably changed on another device. Sign in again to resume syncing your tracks, routes and settings.” Press “Sign in” and enter the new password. What you have created on the device in the meantime is kept. “Not now” asks again at the next launch.

Sign out, switch account

  • “Logout” shows the account’s address and asks for confirmation.
  • Signing back in to the same account keeps what you created on the device. Signing in to another account loads that account’s data instead: a “Syncing your account…” banner shows the progress. The previous account’s tracks leave the device, but stay on their account. See Sync between devices.
  • In the browser version, an account is mandatory: signing out immediately reopens the sign-in window.

Delete the account

“Delete Account” requires an Internet connection. The app asks for confirmation (“Are you sure you want to delete your account? This action cannot be undone.”) and has you type the phrase “delete my account” before erasing the account. A subscription taken in a store does not stop for all that: cancel it in the App Store or Google Play (see Premium subscription).

See also

↑ Contents

1.4 Sync Between Devices

Beginner

The essentials

Connect all your devices to the same NavimetriX account: a route created on the phone appears on the computer, a setting changed on the tablet follows on the other devices. Synchronization happens by itself, as soon as the device has Internet.

  1. Take the Premium subscription and create your account (see NavimetriX account).
  2. Connect each device to this account: Settings, person icon, “Log In” tab.
  3. Let the devices connect to the Internet (Wi-Fi, mobile network or satellite). Without a network, everything keeps being recorded on the device, and synchronization resumes when the connection returns.

Going further

What follows the account

  • POIs (points of interest), routes, ZOIs (zones of interest) and routings.
  • Most settings: units, time zone, colourblind-friendly colours, MOB button (man overboard), My Boat, Routing, Forecast display, Alarms.
  • The GRIB list (weather forecast files). Each device downloads the content itself: a GRIB missing from the device carries the mention “Missing” and a download icon Download icon. Press it to fetch it.
  • The tracks of your passages and their logbook: they go up to the account as soon as the device has Internet, if the subscription is valid, then appear in the Tracks tab of the other devices. See the chapter Tracks, Replay and Logbook.
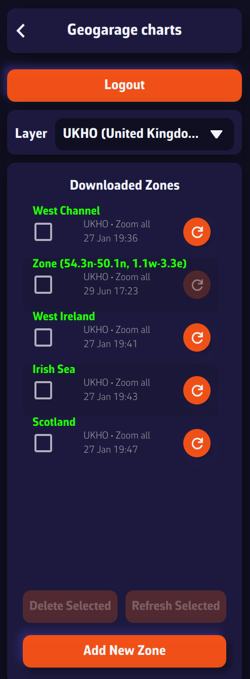
  • The Geogarage account, used by all your devices. Chart zones downloaded for offline use, however, stay on the device that downloaded them.

What stays specific to each device

Some settings depend on the screen or on where the device is used. They do not leave the device:

  • the Theme (light in the cockpit, night at the chart table);
  • in Settings > “General”: the Language, the Starry sky, the Display scale, the Font (Windows), the Timeline scale size and Energy saving;
  • the instrument configuration, adapted to each screen’s size;
  • the chart background chosen in the Layers menu and the chart’s orientation;
  • the settings of the GPS & NMEA page: connections to onboard instruments, GPS source, AIS source (the vessels received by the Automatic Identification System);
  • the alarm voice (Settings > “Alarms”), which depends on the voices installed on each device: you cannot have the same voice on a Windows computer and on an iPad, for example;
  • the C-MAP charts: each device registers on your C-MAP account and downloads its own zones.

The synchronization banner

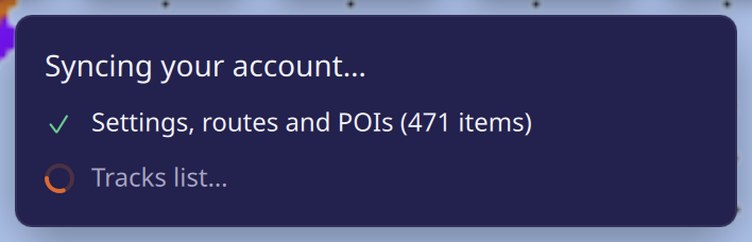
When you sign in to a different account from the one the device was using, everything realigns: settings, track list, account tracks, sending of pending track chunks. A “Syncing your account…” banner shows each step:

  • “Settings, routes and POIs” with the number of items received;
  • “Tracks list”;
  • “Fetching tracks: x of y…”, then “Tracks fetched: n”;
  • “Sending n chunks…”.

Without a network, a line says “waiting”. The banner shows “Account synced” when everything is finished, then withdraws. A startup or a reconnection to the same account does not display it.

“Syncing your account…” banner just after signing in: settings, routes and POIs, track list, then track fetching in progress“Syncing your account…” banner just after signing in: settings, routes and POIs, track list, then track fetching in progress

Good to know

  • The navigation log only goes up to the account if the subscription is valid. Without account credentials on the device, nothing is sent.
  • After a password change on another device, synchronization stops until you sign in again (see “Session expired” in NavimetriX account).

See also

↑ Contents

1.5 NavimetriX in a Browser

Expert

The essentials

NavimetriX also opens in a web browser, in two ways:

  • a share link received from another browser (a crew member, a friend ashore): it opens without an account and without installing anything, to replay a passage or follow it live;
  • the full app, at nav.navimetrix.com, reserved for NavimetriX accounts with a valid subscription.
  1. To open a share link, simply tap it: the shared passage appears on the chart, with its playback bar.
  2. For the full app, open nav.navimetrix.com and sign in with your NavimetriX account.
  3. On a phone or tablet, prefer the installed app: it alone offers background GPS, alarms and offline use.

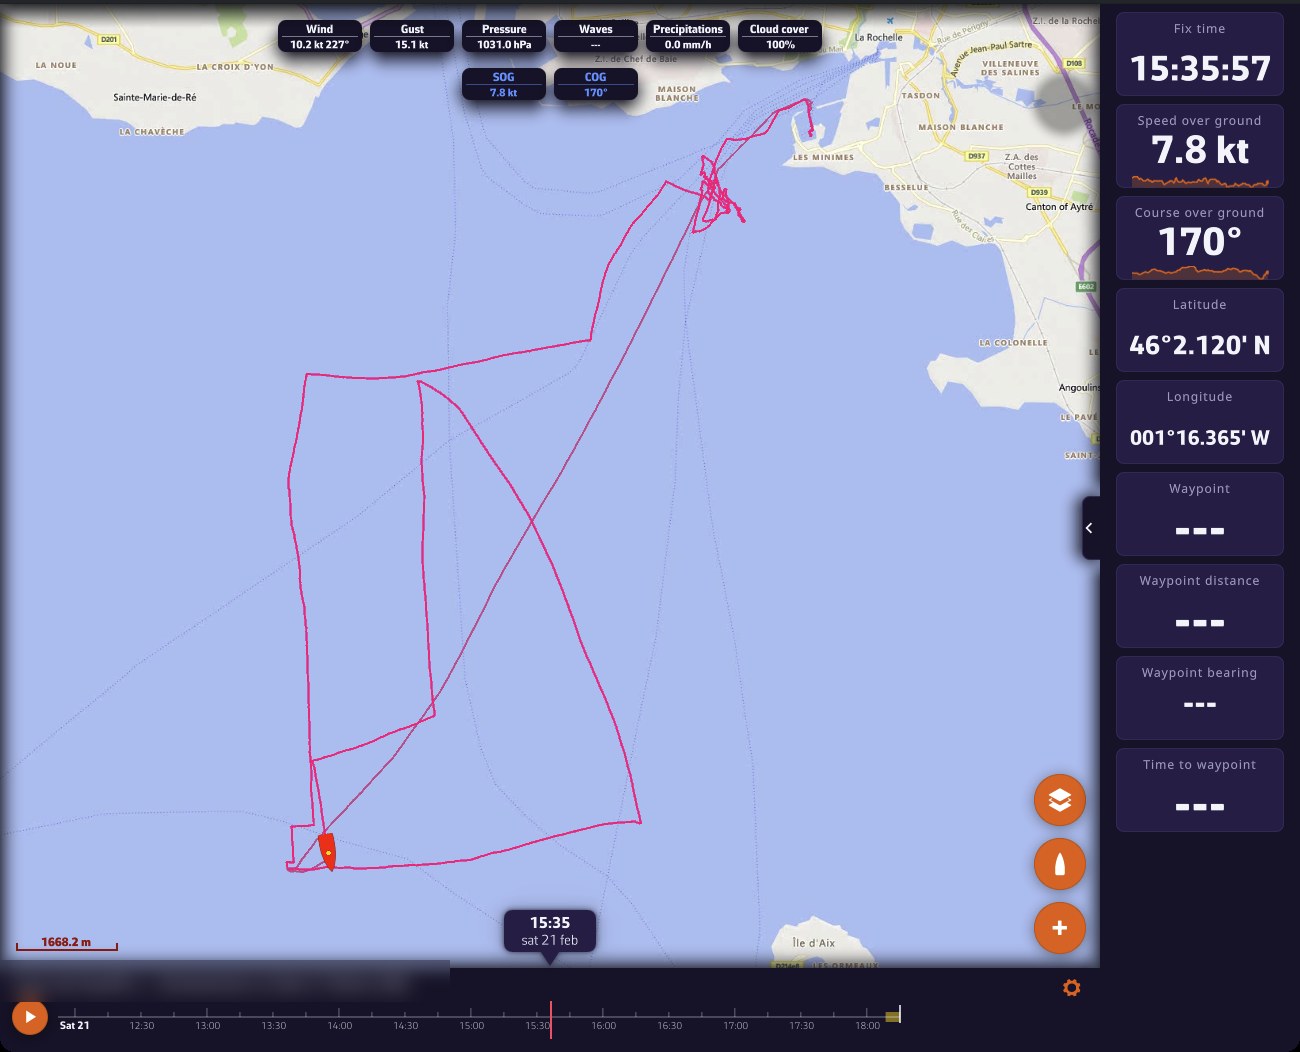
Share-link viewer in a computer browser: track replayed on the chart with the fleet, top labels, instruments on the right and playback bar at the bottom; the track title is blurredShare-link viewer in a computer browser: track replayed on the chart with the fleet, top labels, instruments on the right and playback bar at the bottom; the track title is blurred

Going further

A share link is created in the Tracks tab, from a track’s menu: “Share replay link” or “Share live link”. Anyone who has the link can replay the track and read its logbook in a browser. They cannot modify anything. See the chapter Tracks, Replay and Logbook.

The visitor has no account or subscription. The viewer therefore only shows what is useful for watching the passage:

  • no left drawer (GRIBs, Routes, Routings tabs…) and no account icon;
  • a Settings drawer reduced to what suits the page: Theme, General (language, time zone, units, colours, display scale), Forecast display, Instruments and About. Their choices stay in their browser;
  • in the Layers menu, only the OSM and BING chart backgrounds;
  • no tides, current atlases, weather charts or satellite images, which would show today’s situation over a past passage. Weather stations, lightning and rain radar are only offered if the loaded weather covers the present moment, typically for a live view.

Full screen on iPhone. Safari does not offer a true full screen on iPhone. For a share link, add the page to the home screen (Safari’s share button, “Add to Home Screen”): opened from its icon, it is displayed without Safari’s bars.

The full app in the browser

  • At startup, you must sign in to your NavimetriX account. Without a valid subscription, the “Subscription required” screen appears: “Access from a browser is reserved for accounts with an active subscription. You can subscribe from the NavimetriX application on your phone, tablet or computer.” If the subscription service does not respond, the “Unable to verify your subscription” screen offers “Retry”.
  • You cannot subscribe from the browser: the subscription window points to the App Store or Google Play (see Premium subscription).
  • Signing out immediately reopens the sign-in window: the browser app does not work without an account.
  • On a phone or tablet, the page first offers the native app: “Open in the App Store” or “Open in Google Play”, or “Continue in the browser”.

What the browser version does not do

A browser has no access to the onboard instruments and suspends a tab sent to the background. The browser version therefore removes:

  • the Navigation mode switch;
  • the GPS & NMEA page of the Settings: a browser cannot receive NMEA data (the format of onboard instrument data);
  • the Alarms page: a browser tab cannot keep watch with the screen off;
  • the Geogarage charts page and offline charts: the Geogarage account arrives through synchronization, but nothing is downloaded for offline use;
  • Energy saving;
  • C-MAP charts;
  • the thunder sound associated with the lightning layer.

The rest follows your account as on other devices: routes, POIs (points of interest), ZOIs (zones of interest), routings, settings. See Sync between devices.

See also

↑ Contents

↑ Contents

2 Getting Started and Interface

This chapter tours the interface: the guides for getting started, the main screen with its drawers, round buttons and time bar, the “+” menu and the chart menus, the Layers menu, then the operating modes (Navigation mode, power saving, demo mode).

2.1 First Steps and Guides

Beginner

The essentials

For a first trip, follow the Quick Start: it walks you through the screen, choosing your boat’s polar, downloading the weather, creating a route, calculating a routing and Navigation mode. This guide then goes further, feature by feature.

  1. In the app, open the Settings (chevron handle on the right edge), then “Quick Start” > “Open guide”. The page opens in your browser.
  2. For a specific question, press the “?” icon Help icon, to the left of the “Settings” title: it opens the FAQ.
  3. After each update, read the “What’s new” window: it summarizes what changes in the installed version.

Going further

A first run-through

In the order you will need them:

  1. Choose your boat’s polar in Settings > “My Boat”: routing derives the boat’s speed from it. See My Boat.
  2. Download a GRIB, the weather forecast file: “+” menu, “Download GRIB”. See the chapter Weather: GRIB files and forecasts.
  3. Create a route: “+” menu, “Create route”. See the chapter POIs, routes and ZOIs.
  4. Calculate a routing: “+” menu, “Calculate Routing”. See the chapter Weather routing.
  5. At sea, turn on Navigation mode in the left drawer. See Operating modes.

To find your way around the buttons and drawers, start with The main screen.

The quick start guide

The same page opens from two places in the app: Settings > “Quick Start” > “Open guide”, and the “View Quick Start Guide” button in the end-of-installation window, at first launch. It opens in the app’s language.

What’s new and version history

  • The “What’s new” window is displayed once, at the first launch after an update. It needs the Internet to retrieve the list of changes; it is not displayed after the very first installation.
  • Settings > “About” > “Version history” lists the changes of all versions. It also requires an Internet connection.

The “About” page

Settings > “About” shows the app’s name and version, then:

  • Share anonymous usage statistics (on by default): these figures contain no position, boat name or address. Turning the switch off also asks the server to erase what it has already received from the device.
  • Privacy policy, Visit our website, Join our Facebook group;
  • Rate NavimetriX, on iPhone, iPad, Mac and Android: opens the app’s page in the App Store or Google Play.

Glossary and roadmap

  • The glossary of nautical terms explains the acronyms displayed by the app: COG, SOG, TWA, VMG, XTE and the others.
  • The roadmap lists the features delivered by quarter.

Need help?

Settings > “Contact us” lets you write to support. See the chapter Help and troubleshooting.

See also

↑ Contents

2.2 The Main Screen

Beginner

The essentials

The chart fills the whole screen. Move it by dragging, zoom by pinching (on a computer, with the wheel). Everything else sits around it:

  1. Left edge: a chevron handle opens the left drawer and its tabs (GRIBs, Charts, Routes, Routings, Tracks, AIS…), with the “Navigation” switch at the top.
  2. Right edge: a chevron handle opens the Settings.
  3. Bottom right: the round orange buttons. From top to bottom: layers Layers button, centring on the boat Boat button and the “+” menu Plus button.
  4. Bottom: the timeline, the forecast time bar, as soon as a weather file or a routing is displayed.
  5. Top: the labels, small rectangles that give the weather at the point you are aiming at (the “target”), at the timeline’s time.

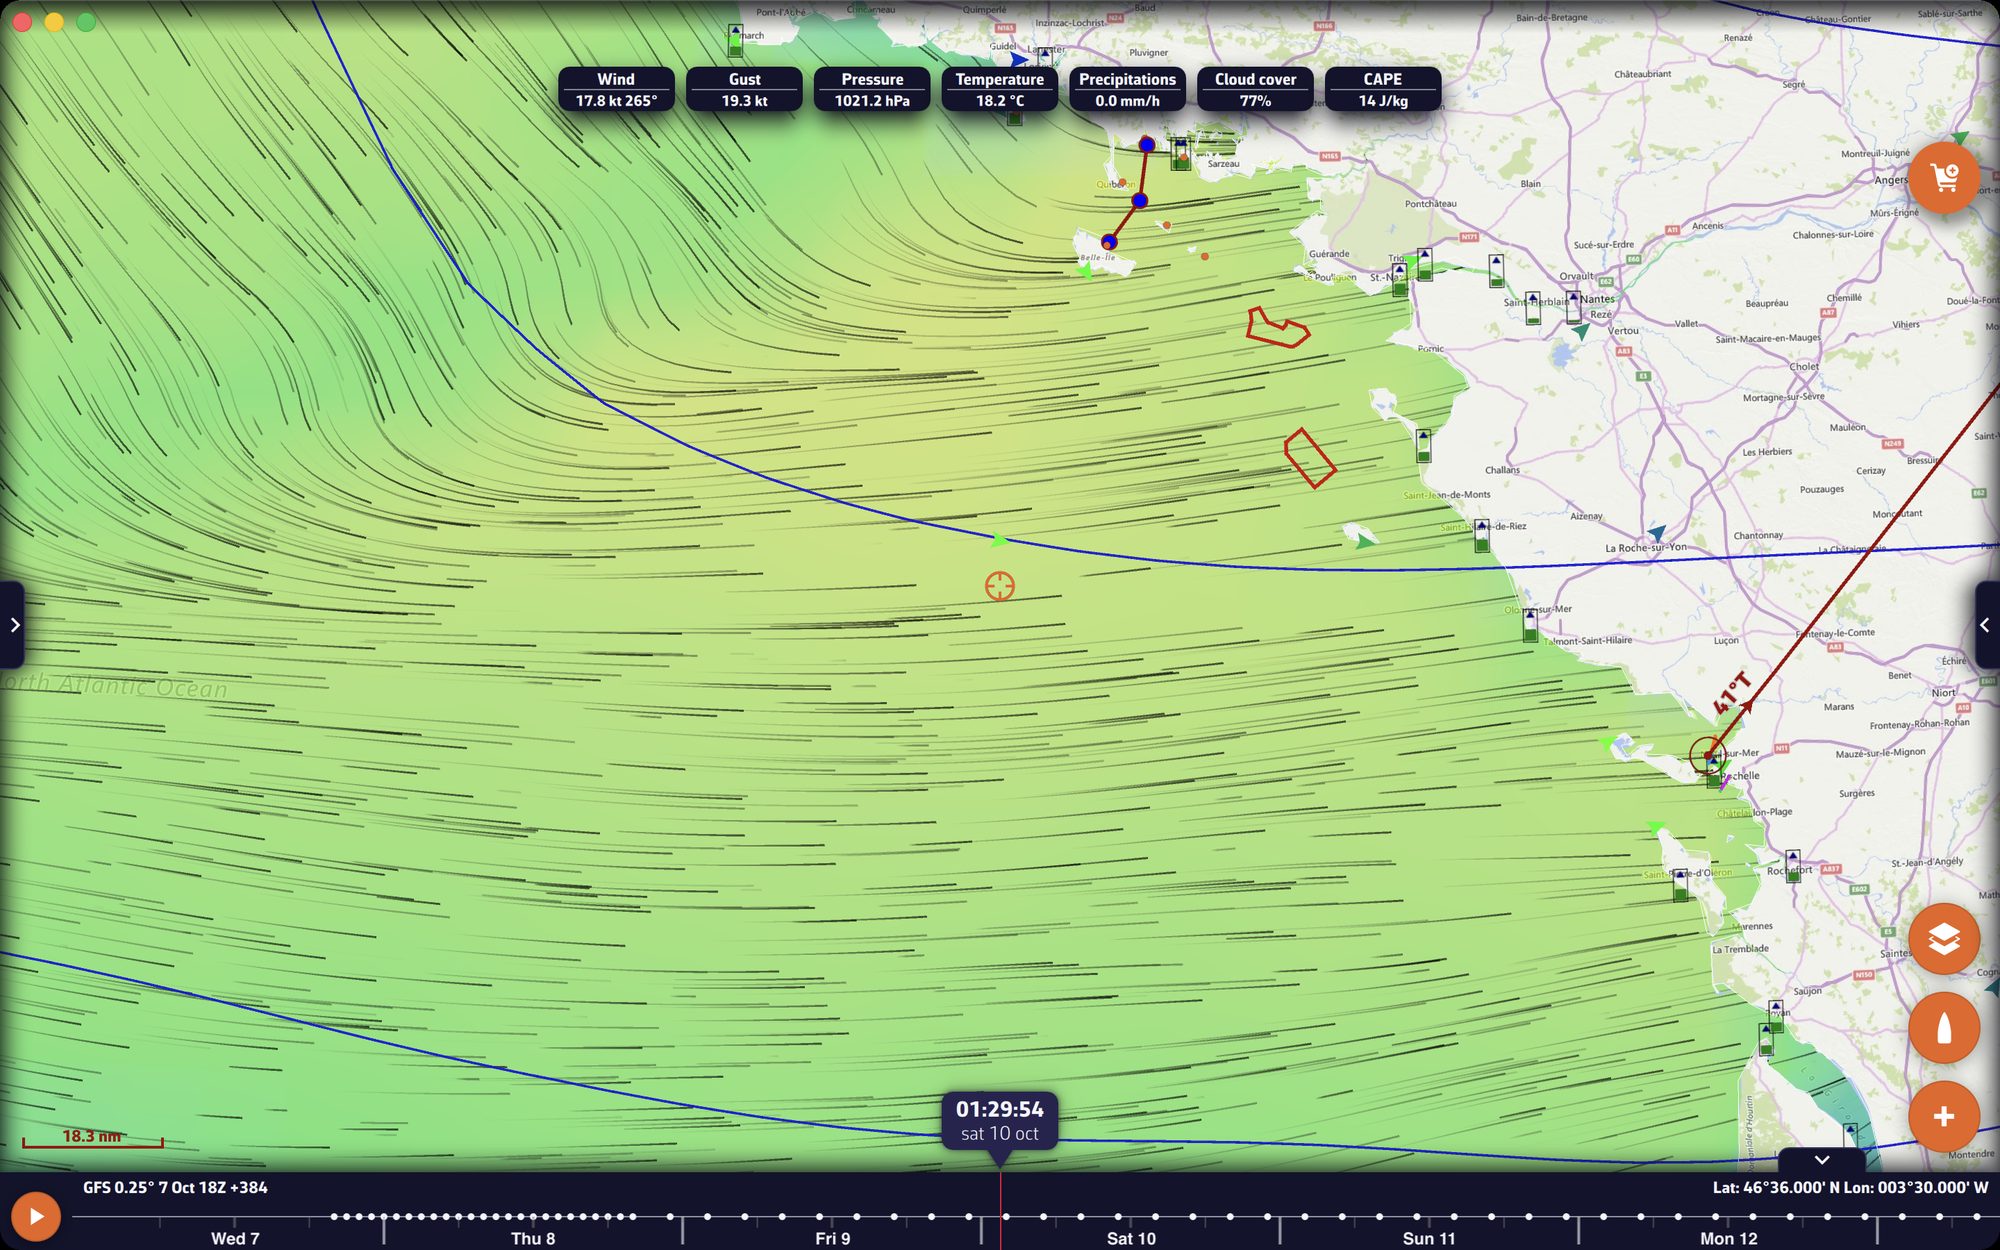
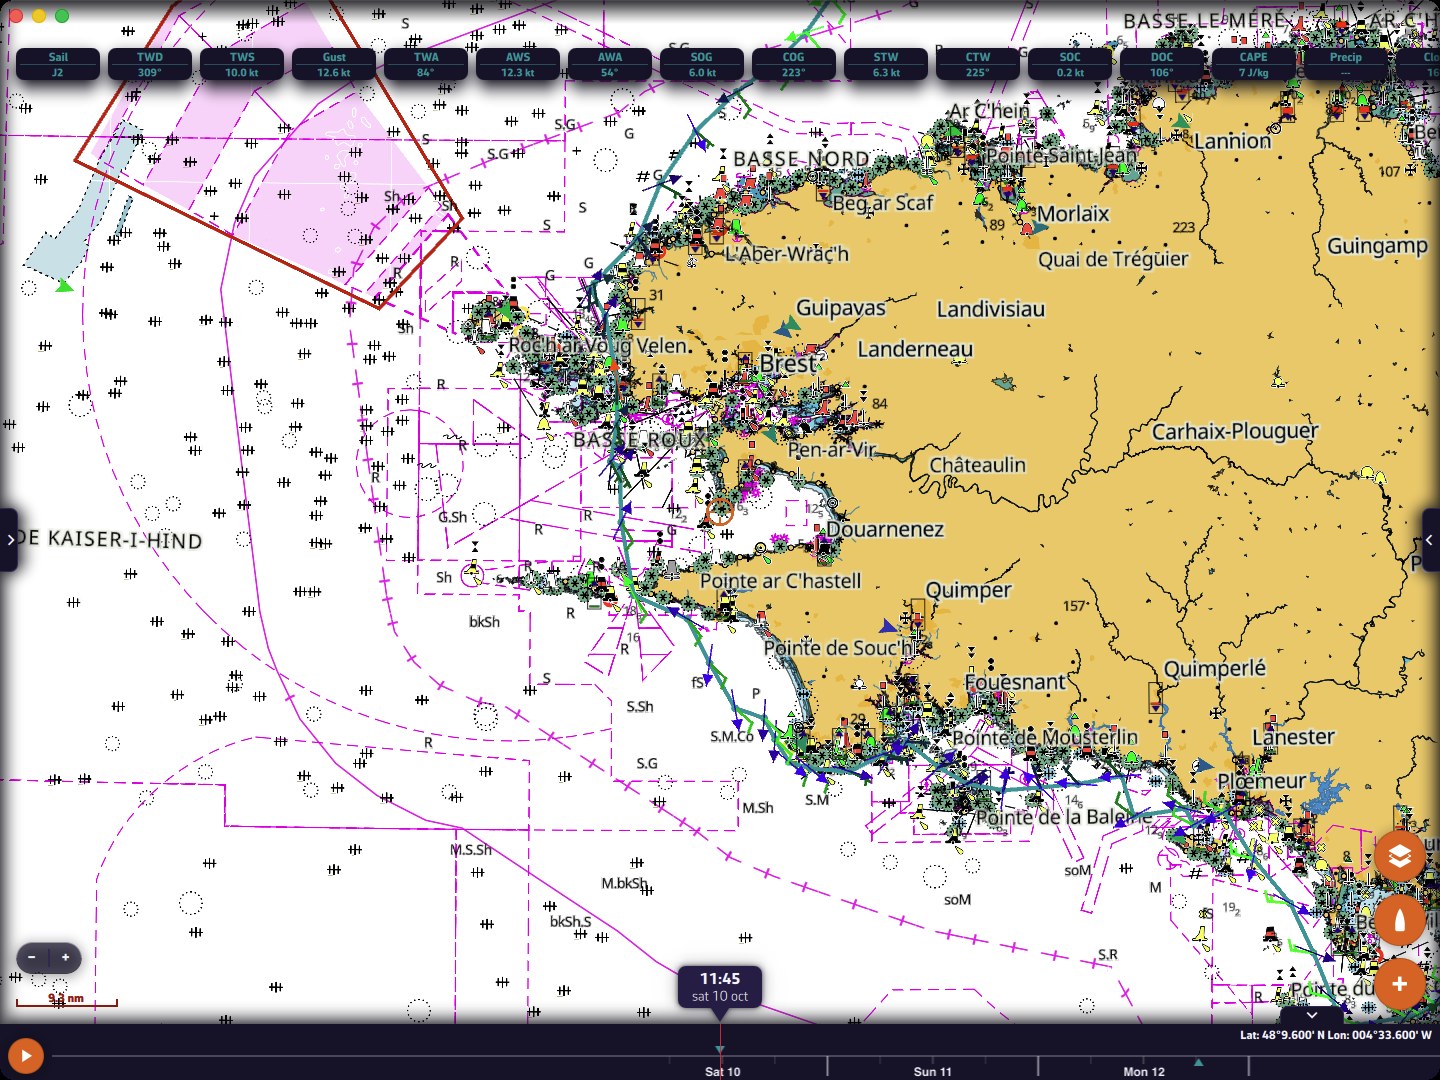
The main screen with a wind GRIB displayed on the Bay of BiscayThe main screen with a wind GRIB displayed on the Bay of Biscay

Going further

The left drawer

The handle on the left edge opens and closes this drawer. At the top, the “Navigation” switch turns on Navigation mode (Premium subscription); the arrow icon to its right indicates, in Navigation mode, the quality of the GPS position. See Operating modes.

Below it, ten tabs on two rows:

TabContentChapter
GRIBsthe downloaded forecast filesWeather: GRIB
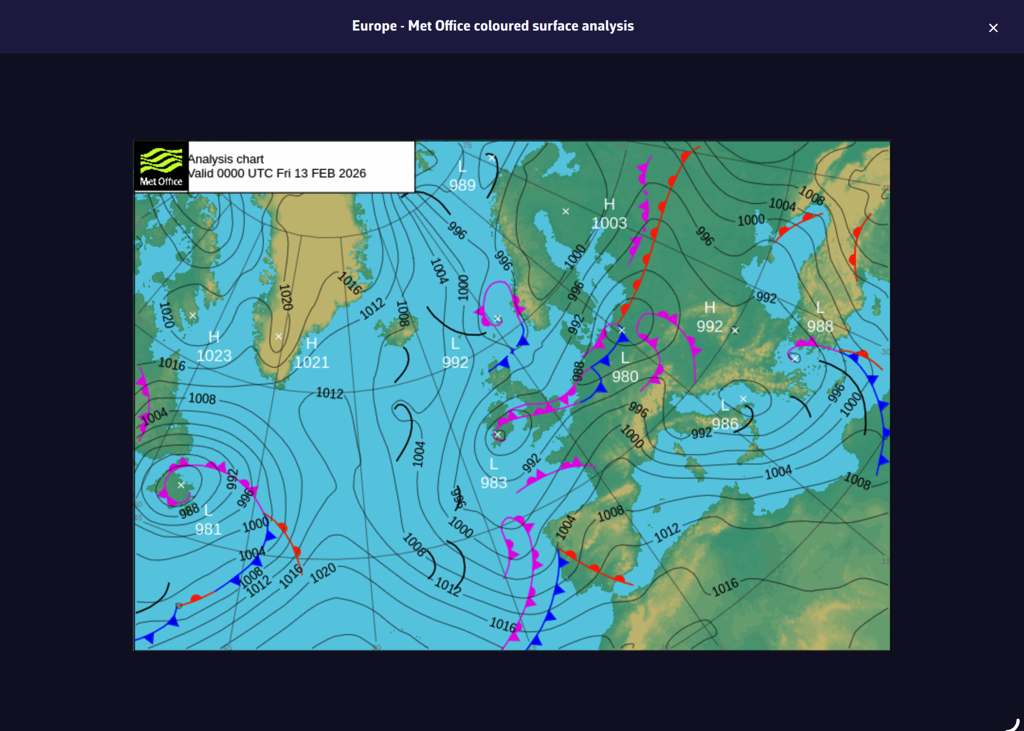
Chartsthe weather charts of official services (isobars, fronts)Weather: observations
Radarthe rain radar sourcesWeather: observations
POIsthe points of interestPOIs, routes and ZOIs
ZOIsthe zones of interest (no-go zones, information zones)POIs, routes and ZOIs
Routesyour routesPOIs, routes and ZOIs
Routingsthe calculated routingsWeather routing
Tracksthe recorded navigationsTracks and logbook
AISthe vessels received by AISNavigation: GPS, NMEA and AIS
Racerace trackingRacing and fleets

The “Charts” tab does not contain the nautical charts: these are chosen in the Layers menu.

The Settings drawer

The handle on the right edge opens and closes the Settings; it always stays visible. At the top of the drawer, on either side of the “Settings” title:

  • the “?” icon opens the site’s FAQ;
  • the person icon opens your account (sign in, sign out). See NavimetriX account.

In a sub-page, the chevron at the top left takes you back to the previous page. The list of sections is described in General settings.

The round buttons

  • Layers: opens the Layers menu (chart background, orientation, forecast display, displayed layers).
  • Boat: one tap recentres the chart on the boat’s position. Without a GPS position, on a computer, the app falls back to an approximate position of the device. A long press recentres and zooms on the boat.
  • “+”: the actions menu (download a GRIB, create a route, calculate a routing…). See The + button and the chart menus.
  • Add a logbook entry (page icon with a “+”): appears above the boat button in Navigation mode, while a track is being recorded. It opens a new logbook entry, dated and positioned at the moment of the tap. On a phone in landscape, this button does not appear: use the entry of the same name in the “+” menu.
  • Subscription: as long as the device is not subscribed, a round orange button with a shopping cart is displayed at the top right of the chart. See Premium subscription.

On a phone in landscape, the round buttons shrink and line up on the timeline’s side.

Bottom left

  • The scale: a red line followed by the distance it represents, in nautical miles (nm) or metres.
  • The zoom buttons “−” and “+”, if the “Zoom buttons” box is ticked in the Layers menu. A held press zooms continuously.
  • The MOB button (man overboard), if it is enabled in Settings > “General” > “MOB button”. It only appears in Navigation mode, with a GPS position. A long press of one and a half seconds triggers it. See the chapter Safety.

The values at the top of the screen

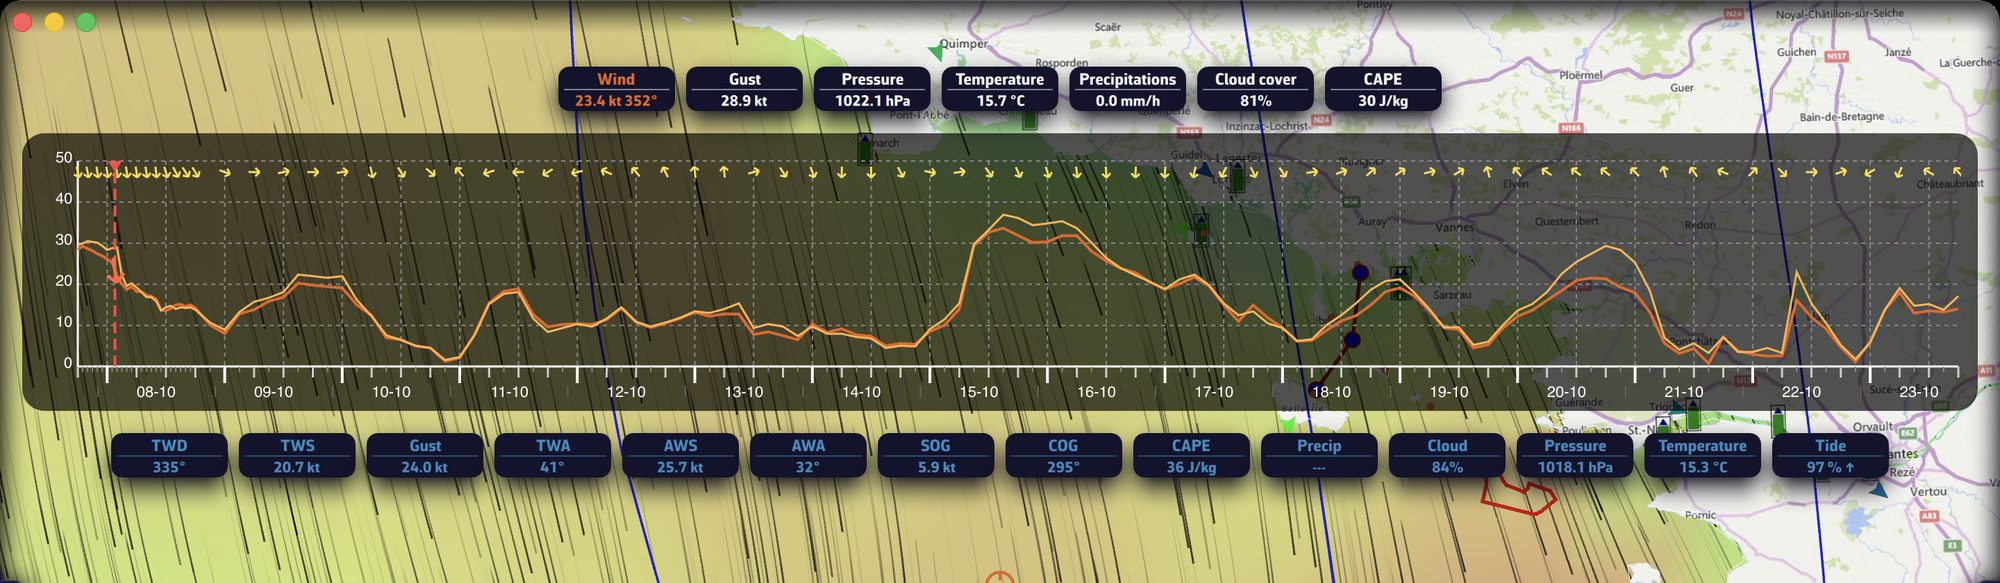
When a GRIB is displayed, a row of labels gives its values at the target point (wind, gusts, pressure…), at the timeline’s time. The target point is set in the Layers menu: the centre of the screen by default, the GPS position or a POI. Tap a label to display under the row the evolution of that parameter over time, at the same point (this requires an active target); tap it again to hide it. These labels are written in the theme’s text colour. When a routing is selected and visible, a second row, just below, gives that routing’s values at the same timeline time, written in the colour of that routing’s line: you can thus tell at a glance the GRIB’s weather from your routing’s.

The timeline

The timeline appears as soon as a GRIB, a routing, the current atlas or the rain radar is displayed.

  • Drag it to move forward or back in time: the chart follows.
  • Tap a point on the timeline to jump to that time.
  • Tap the time bubble, at the centre, to return to now. When the timeline follows real time, the time is shown in orange, with seconds. If the displayed data does not cover the present moment (a GRIB that is too old, for example), the timeline cannot reach it.
  • The play button ▶, at the left of the timeline, scrolls through the forecasts, or the displayed routing, in a loop.
  • At the top left, the timeline recalls the model of the displayed GRIB and its run (the time at which the model was calculated); at the top right, the target’s coordinates. When the timeline is not displayed, these coordinates move to the bottom right corner.
  • On phones and tablets, the timeline grows under your finger and retracts two seconds later.
  • Settings > “General” > “Timeline scale” stretches the timeline from 100 to 500%: the larger the value, the more room an hour takes, and the finer the jump on touch (1 h at 100%, 30 min at 200%, 15 min at 300%, 10 min at 400%, 5 min at 500%).

Fold the timeline. A chevron handle, above the right end of the timeline, folds it to free the chart; this choice is remembered. When the timeline is a horizontal banner (phone in portrait, tablet, computer), this handle is always there. If the timeline has disappeared, first check that it is not folded, then that a weather file or a routing is actually displayed.

Phone in landscape. On small screens (phones and tablets under 8.5 inches diagonal), the timeline becomes a vertical column on the edge of the screen, on the side opposite the camera, with the future at the top. The fold handle is only offered there if it has a neighbour: a column of instruments or an open drawer beside it. Without a neighbour, the timeline cannot be folded and reappears by itself: to fold it, simply hide the instruments and close the drawers.

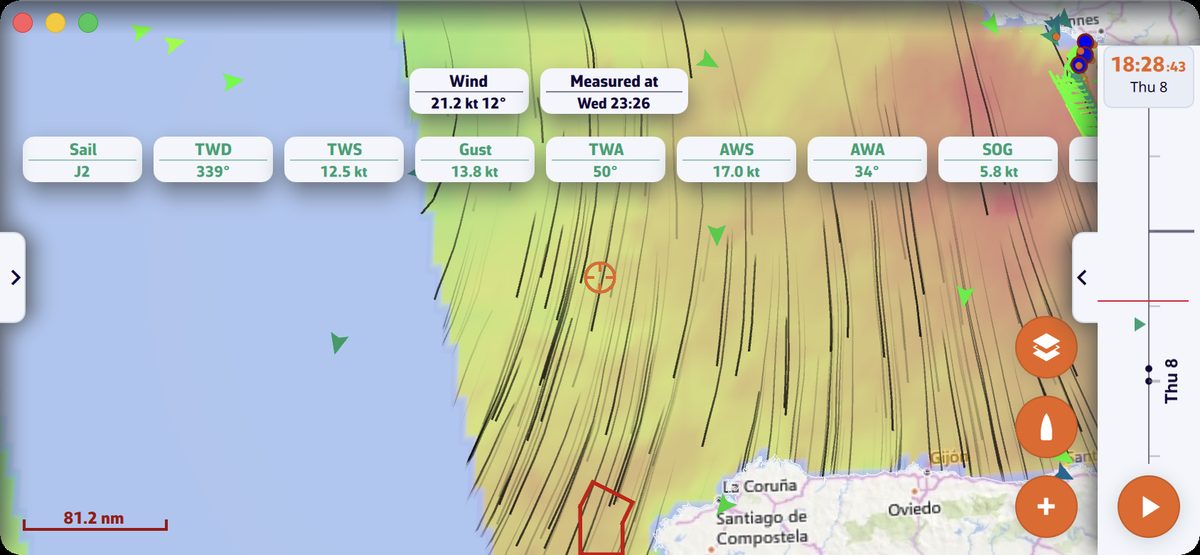
Phone in landscape: wind GRIB displayed and timeline as a vertical column on the right edge, play button at the footPhone in landscape: wind GRIB displayed and timeline as a vertical column on the right edge, play button at the foot

The instruments

When you display them (“Show instruments” box in the window that opens when Navigation mode is turned on, or Settings > “Instruments” > “Visible”), the instruments are placed as a banner at the top of the screen in portrait, as a column on the right edge in landscape. See the chapter Instruments.

Full screen on a computer

On Mac and PC, the standard system shortcut (F11 on Windows, Ctrl + Cmd + F on Mac) puts the window in full screen; this choice is remembered.

See also

↑ Contents

2.3 The + Button and the Chart Menus

Beginner

The essentials

The round “+” button Plus button, at the bottom right of the chart, gathers the actions: download weather (a GRIB forecast file), create a POI (point of interest), a route or a zone, calculate a routing, drop anchor, measure, add an instrument. “Add POI” is placed at the centre of the screen; “Route to the target” aims at the target set in the Layers menu (the centre of the screen by default).

  1. Centre the chart on the area that interests you.
  2. Press “+”, then the desired action.
  3. On a computer, a right-click on the chart opens another menu, whose actions apply to the clicked point.

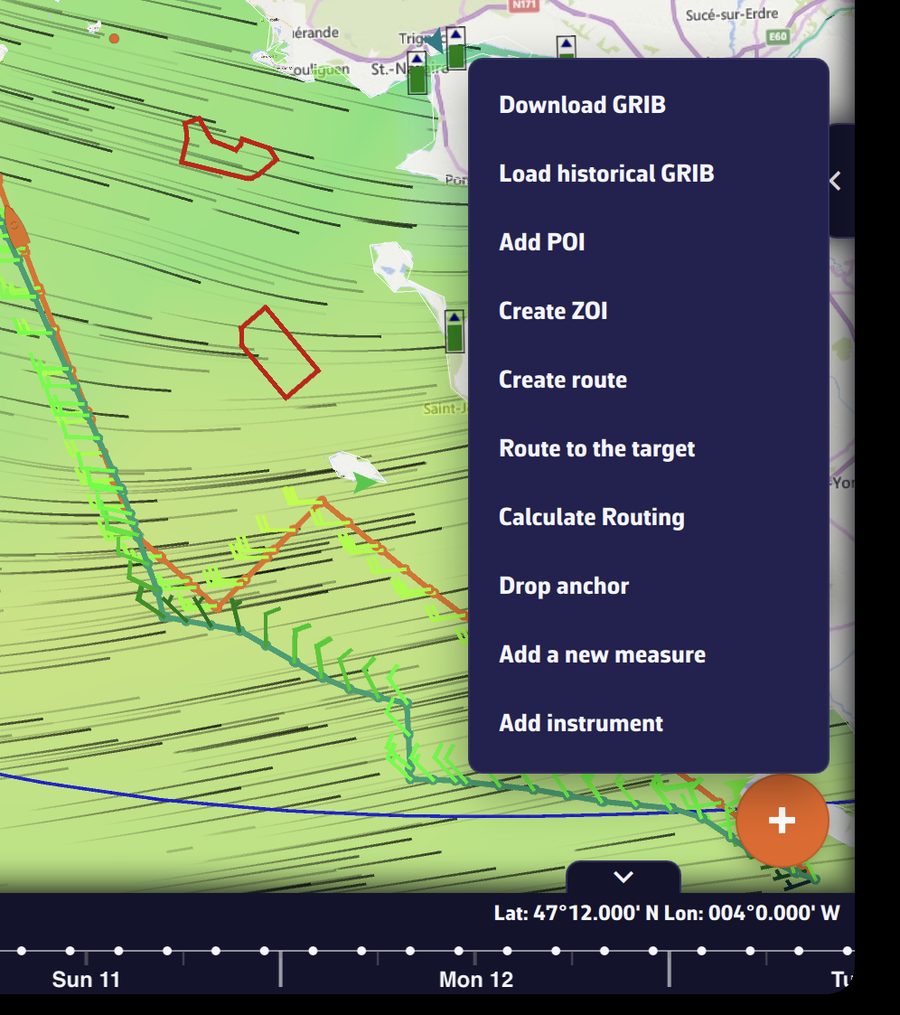
The “+” menu open above the buttonThe “+” menu open above the button

Going further

The actions of the “+” menu

ActionWhat it doesCondition
“Download GRIB”An “Area selection” frame appears; adjust it, confirm, then choose the model.Internet
“Load historical GRIB”Same area selection, for past weather.Premium
“Add POI”Creates a point of interest at the centre of the screen.
“Create ZOI”Draws a zone of interest (no-go or information zone).
“Create route”Starts creating a route, point by point.
“Route to the target”Calculates a routing from the boat, now, to the target (the centre of the screen by default), with the settings of the last routing.Navigation mode, boat position, wind GRIB on the device
“C-MAP AutoRouting”Draws a route that follows the C-MAP chart.C-MAP chart displayed
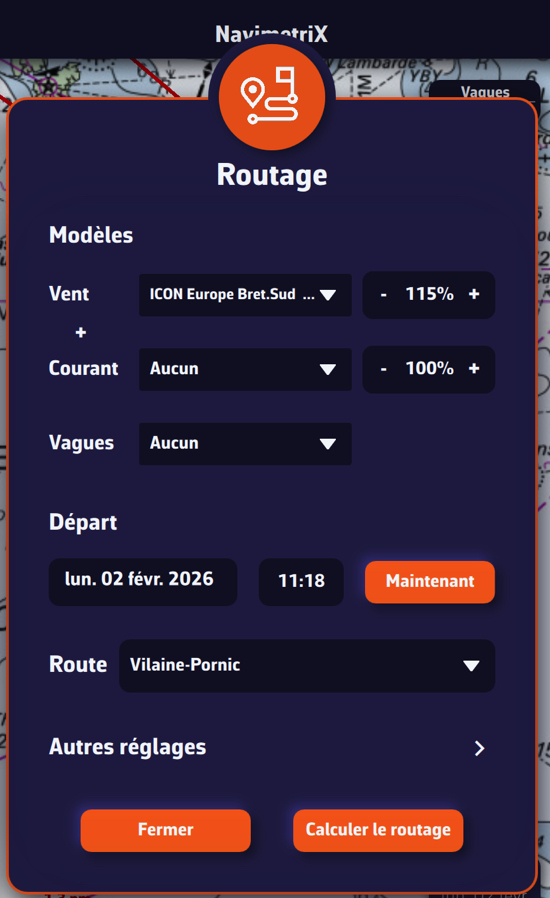
“Calculate Routing”Opens the routing window.a wind GRIB and at least one route
“Drop anchor”Sets the anchor alarm. Turns on Navigation mode by itself, with a message. Disappears while an anchor is set: raise it first from its POI’s menu.Premium, valid GPS position, speed over ground below 2 knots (above that, a message says the boat is still under way)
“Add a logbook entry”Opens a new logbook entry, dated and positioned now.Navigation mode, track being recorded
“Add a measure”Places a ruler measuring distance and bearing.
“Add instrument”Opens the instrument gallery. Tap one, then “Add to instrument bar” or “Add to chart”.

When a condition is missing, the app explains it rather than hiding the action. For example, “Route to the target” outside Navigation mode displays “Routing to a point starts from the boat, now. Turn on Navigation mode first”, and “Calculate Routing” without a route displays “Please create a route before launching a routing.”

When you have selected a point of a routing on the chart, “Calculate Routing” becomes “Routing from this point”.

During the replay of a track, the menu only keeps “Add POI”, “Add a logbook entry” (replay of your own tracks), “Add a measure” and “Add instrument”.

The right-click menu (computer)

A right-click on a free part of the chart opens a menu whose actions apply to the clicked point:

  • “Create route”: the route begins at the first point you click;
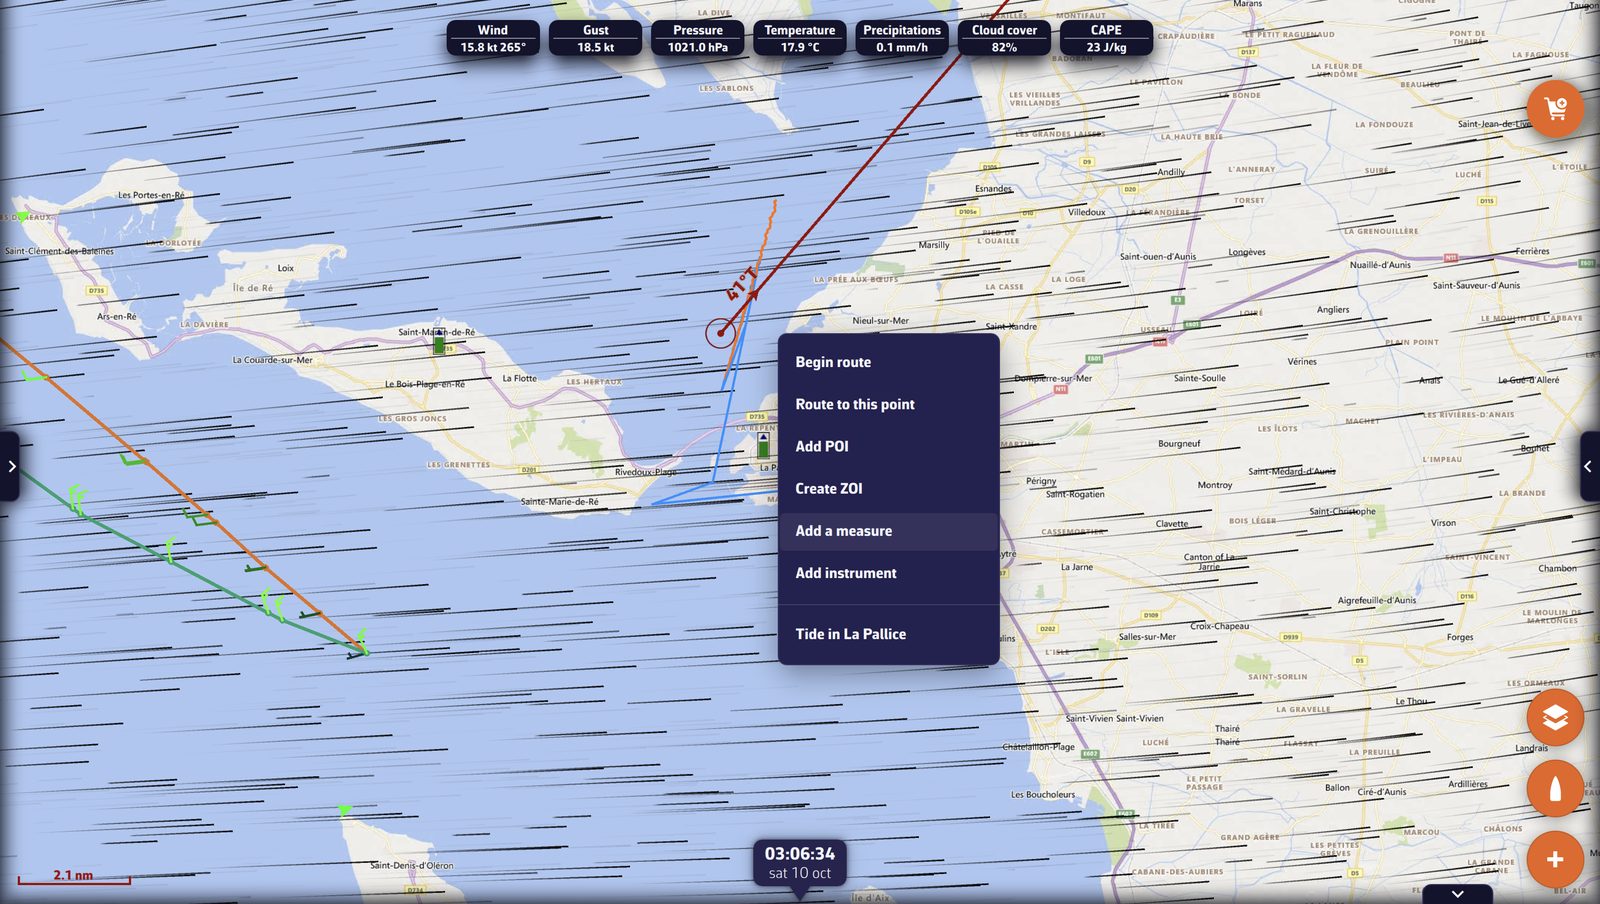
  • “Route to this point”: routing from the boat, now, to the clicked point. The point becomes a POI named after the time, and the routing carries this name. Same conditions as “Route to the target”;
  • “C-MAP AutoRouting”, on a C-MAP chart;
  • “Add POI”, at the clicked point;
  • “Create ZOI”;
  • “Add a measure”, at the clicked point;
  • “Add instrument”, placed on the chart at the clicked point;
  • “Tide in” followed by the name of a port, when a tidal port is within 10 miles: opens the day’s tide curve for that port.

The right-click menu on the chart near La Rochelle, with “Tide in La Pallice”The right-click menu on the chart near La Rochelle, with “Tide in La Pallice”

On a touch screen

A phone or tablet has no right-click: use the “+” menu. “Add POI” places the POI at the centre of the screen, “Route to the target” aims at the target and “Create route” begins at the first point you tap. Two gestures specific to touch:

  • a long press on an object on the chart (an AIS target, a POI…) opens its sheet or menu;
  • two fingers held still for a little over half a second create a measure between the two fingers.

The menus of chart objects

  • A point of a routing (isochrones displayed): tapping it offers “Routing from this point”, which restarts the routing from that point.
  • The edge of a ZOI: tapping it offers “View information”, “Edit zone” and “Delete zone”.
  • A C-MAP chart: a long press, or a double-click on a computer, opens the sheet of the chart object (buoy, light, hazard…). See the chapter Charts.

POIs, routes, AIS targets, measures and instruments also have their own menus, described in their chapters.

See also

↑ Contents

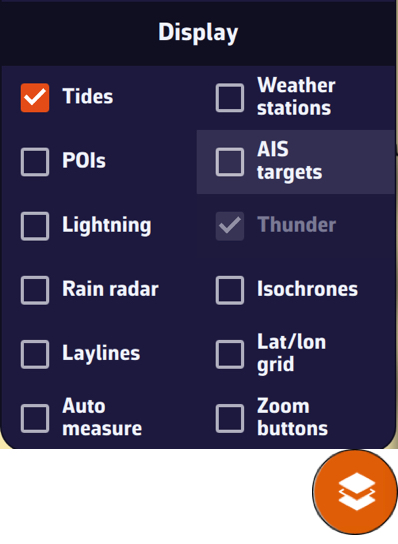
2.4 The Layers Menu

Beginner

The essentials

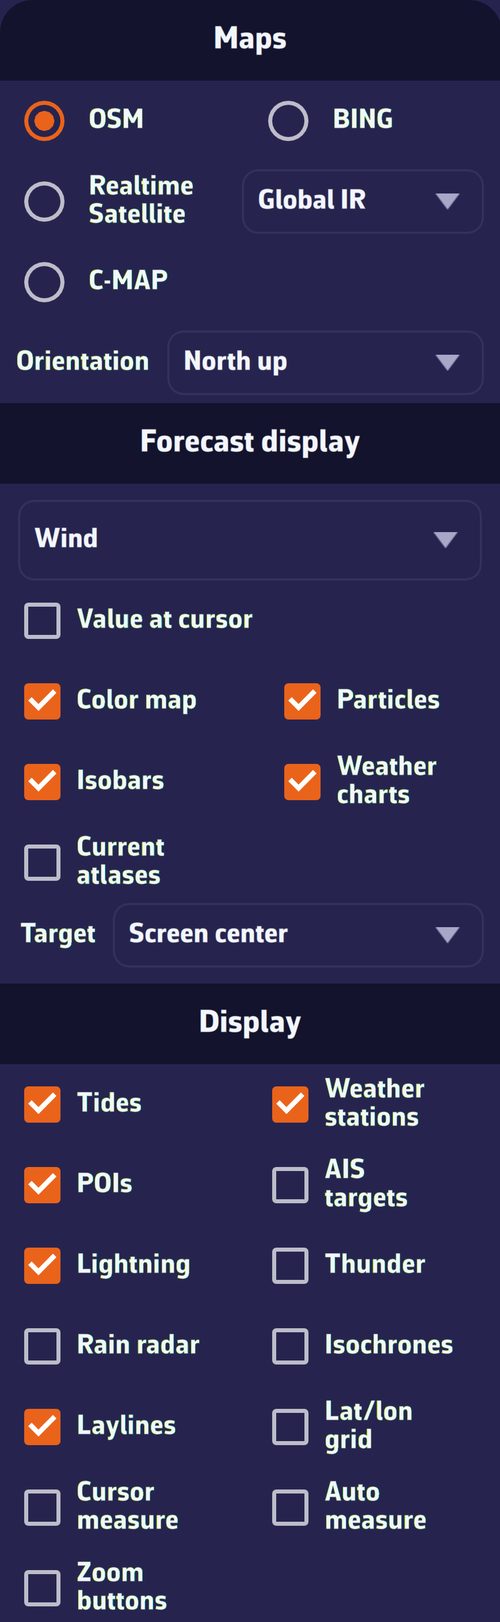
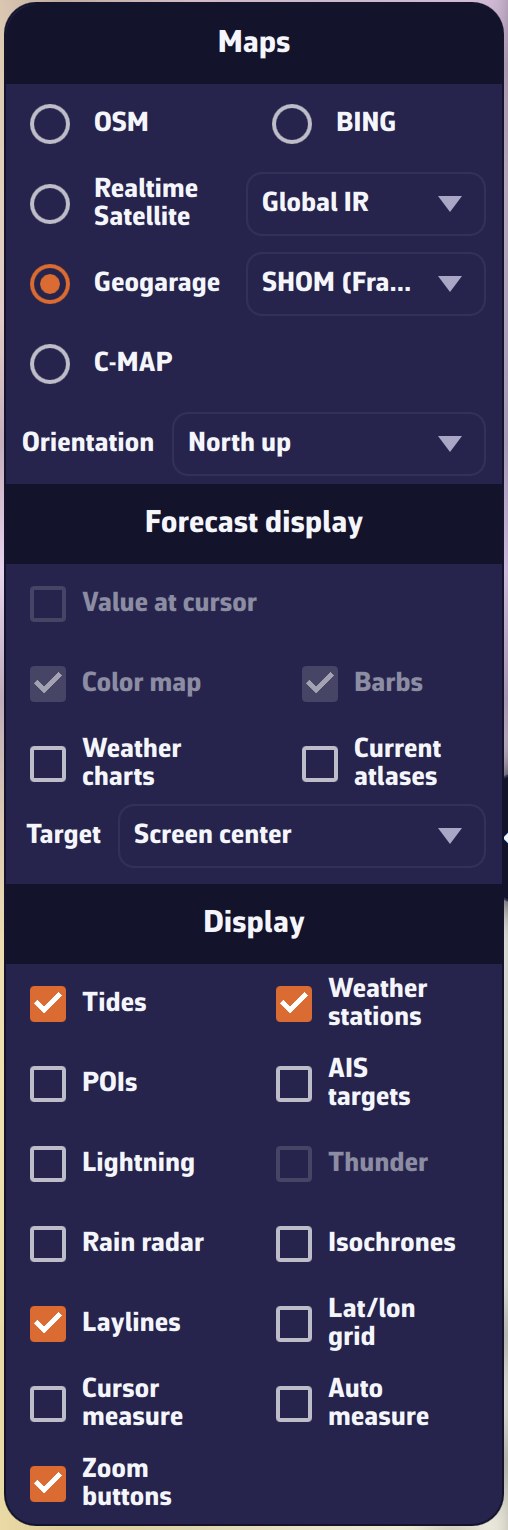
The layers menu with a wind GRIB loadedThe layers menu with a wind GRIB loaded

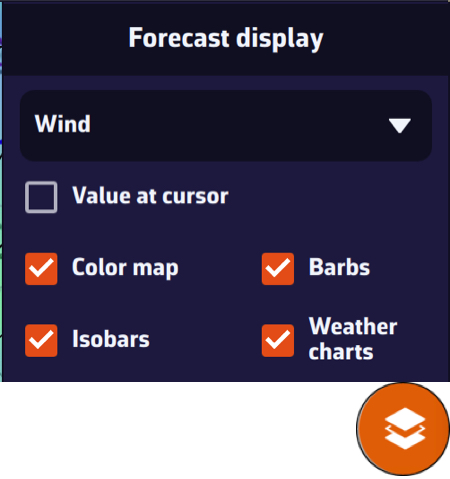
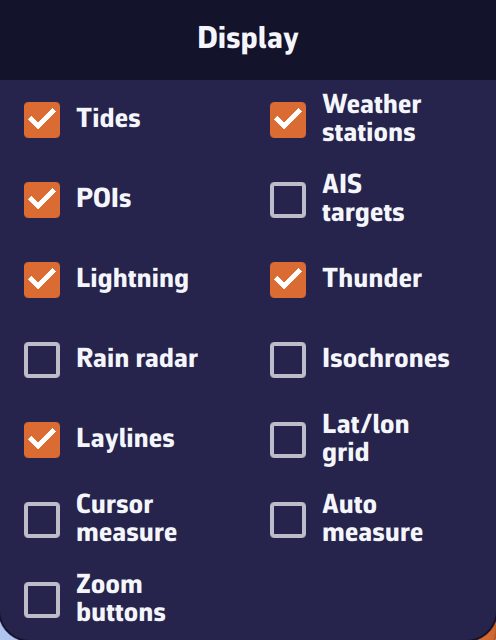
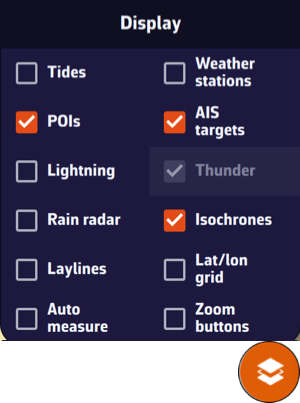
The round layers button Layers button, at the bottom right of the chart, opens a menu in three parts: “Maps” (the chart background and orientation), “Forecast display” (the displayed weather parameter and its drawing mode, the weather charts, the current atlases and the target) and “Display” (the layers placed on the chart).

  1. Press the layers button.
  2. Choose the chart background, then tick the layers to display.
  3. Press the button again, or tap the chart, to close the menu.

Going further

Maps

  • OSM (default): map of land and coastline; BING: satellite imagery (aerial photographs).
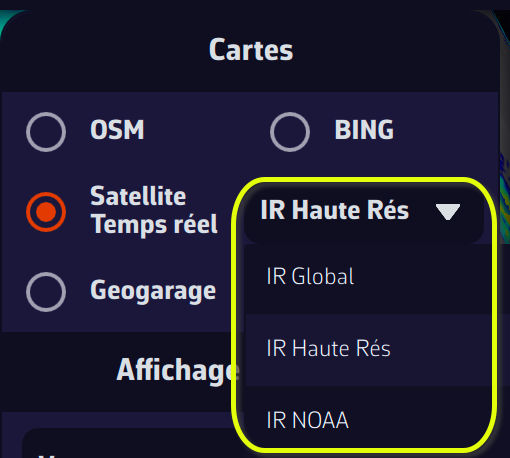
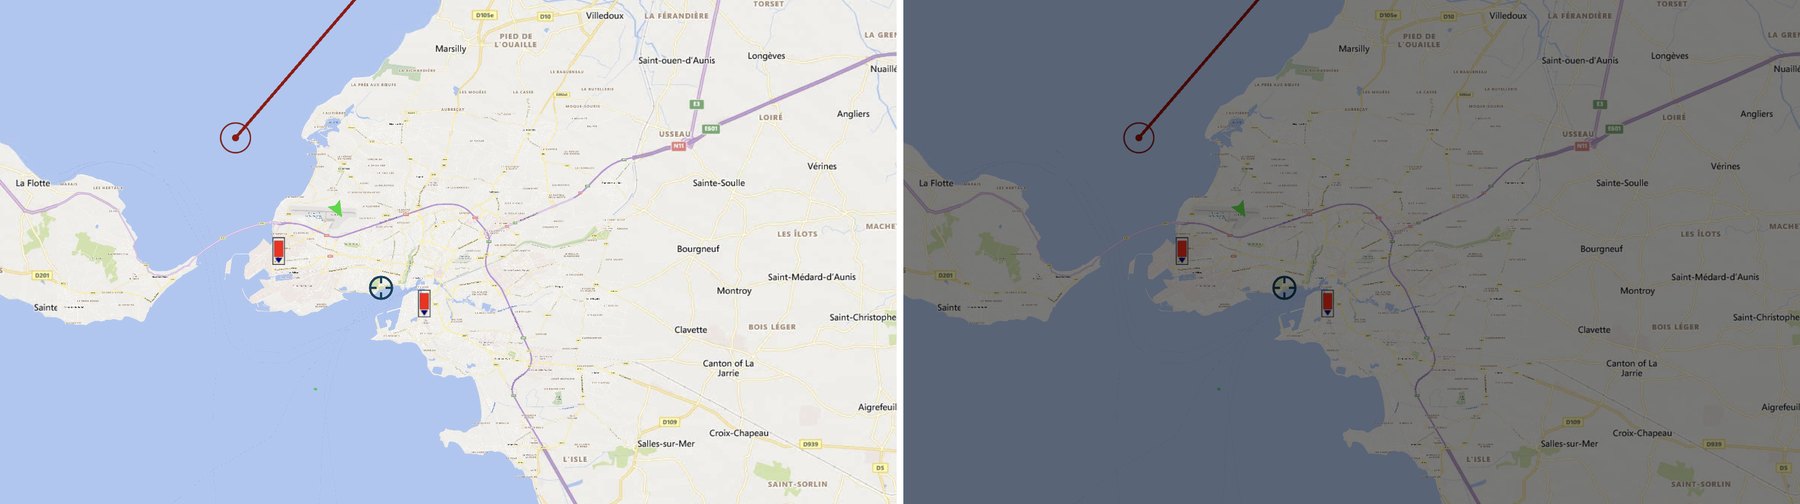
  • Realtime Satellite: recent infrared images from weather satellites, showing cloud cover. The neighbouring list chooses the source: “Global IR”, “High Res IR” (default) or “NOAA IR”. The choice is remembered.
  • Geogarage: the nautical charts of your Geogarage subscription. The line only appears once you are signed in to a Geogarage account; the neighbouring list chooses the layer.
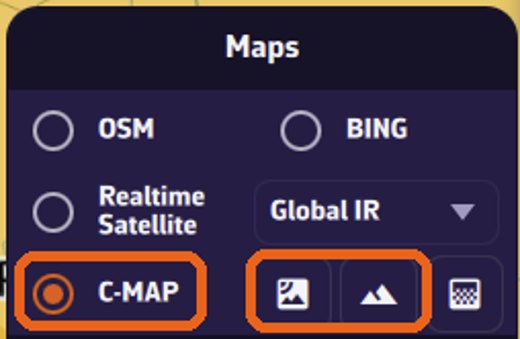
  • C-MAP: the C-MAP DISCOVER X and REVEAL X nautical charts purchased on your C-MAP account. When the C-MAP chart is displayed, three icon buttons appear on its line: satellite imagery, shaded relief and high-resolution bathymetry. Satellite and relief exclude each other and only work with REVEAL X charts; the menu says so when your charts do not have them.

The chosen chart background is specific to each device. Details of the nautical charts are in the chapter Charts.

Orientation

The “Orientation” list chooses what is at the top of the screen:

  • “North up” (default);
  • “Course up (COG)”: the course over ground, the real direction of travel over the ground;
  • “Heading up (HDG)”: the heading, the direction the bow is pointing;
  • “Waypoint up (BTW)”: the bearing to the target waypoint.

Without a valid value (no position, no heading, no active waypoint), the chart returns to north up. This setting is specific to each device.

Forecast display

The first lines concern the displayed GRIB: without a GRIB, they are greyed out or absent. “Weather charts”, “Current atlases” and “Target” remain available without a GRIB.

  • The parameter list: wind, gusts, pressure, waves… depending on the file’s content. It chooses the parameter drawn on the chart.
  • Value at cursor (computer only): shows the parameter’s value under the mouse.
  • Color map: colours the chart according to the parameter’s value.
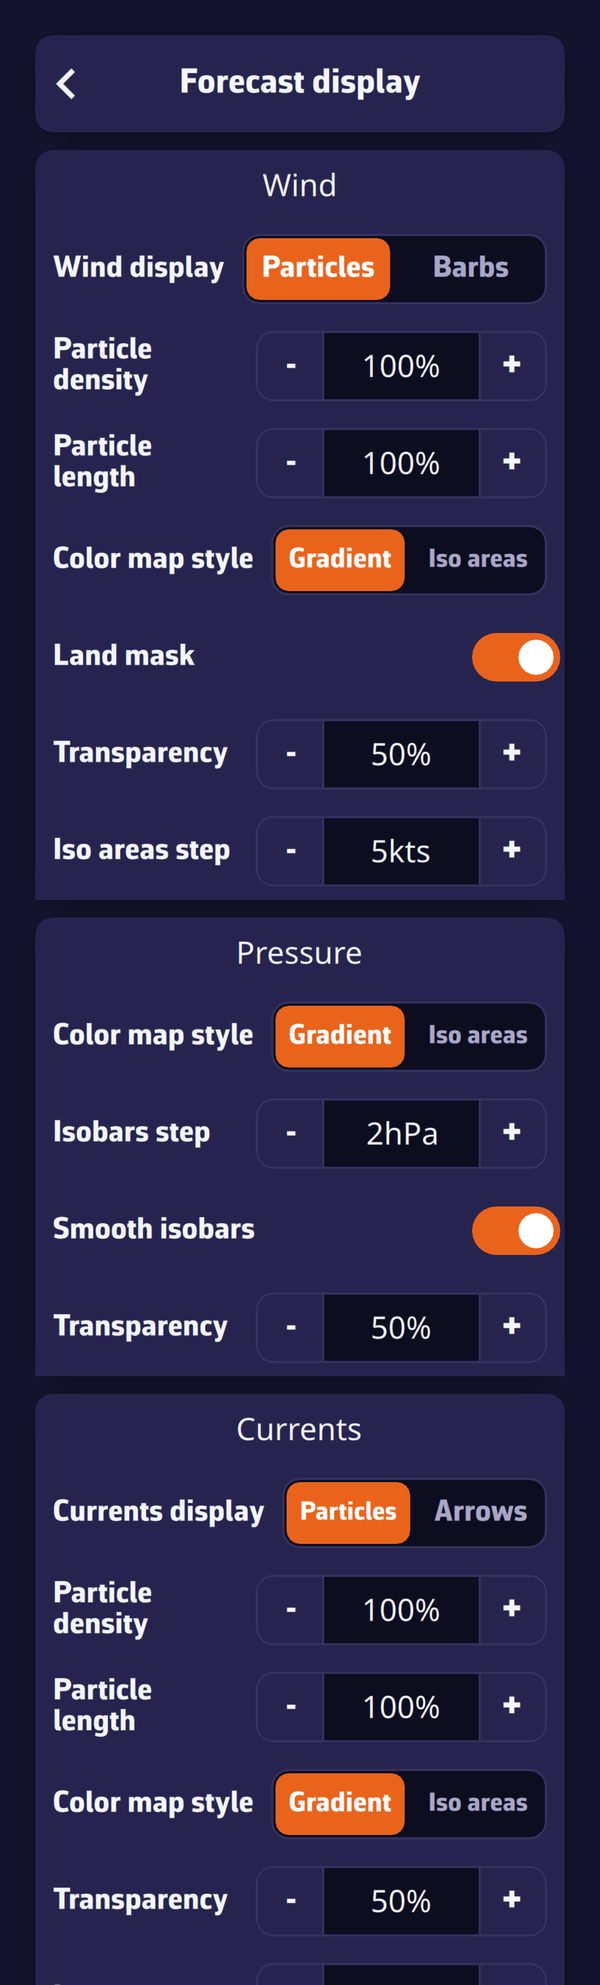
  • Particles or Barbs for wind and gusts, Arrows for currents, waves and pressure: the box shows the mode actually drawn. The choice between particles and barbs is made in Settings > “Forecast display”. In power saving, the chart always draws barbs (and arrows for currents).
  • Isobars: the lines of equal pressure, if the GRIB contains pressure.
  • Weather charts: the charts from the weather services chosen in the Charts tab of the left drawer (isobars and fronts drawn).
  • Current atlases: the tidal currents from the atlases.

The target

The “Target” line chooses the point whose weather the labels at the top of the screen give, and which “Route to the target” and the coordinates shown in the timeline aim at:

  • “Disabled”: no target, and no value labels;
  • “Screen center” (default): the centre of the chart;
  • “GPS position”: the boat’s position;
  • then your visible POIs, in alphabetical order: the target stays on that POI when you move the chart.

A reticle marks the target on the chart. The target does not depend on the GRIB: the line stays active even with no weather loaded.

Display

BoxWhat it displays
Tidesthe tidal ports and their water height at the timeline’s time
Tide infothe Tide pill, next to the labels at the top of the map: the tide at the port closest to the screen center (on by default, independent of the current atlases)
Weather stationsobservations from weather stations ashore and at sea
POIsyour points of interest
AIS targetsthe vessels received by AIS (Premium subscription, or DEMO mode)
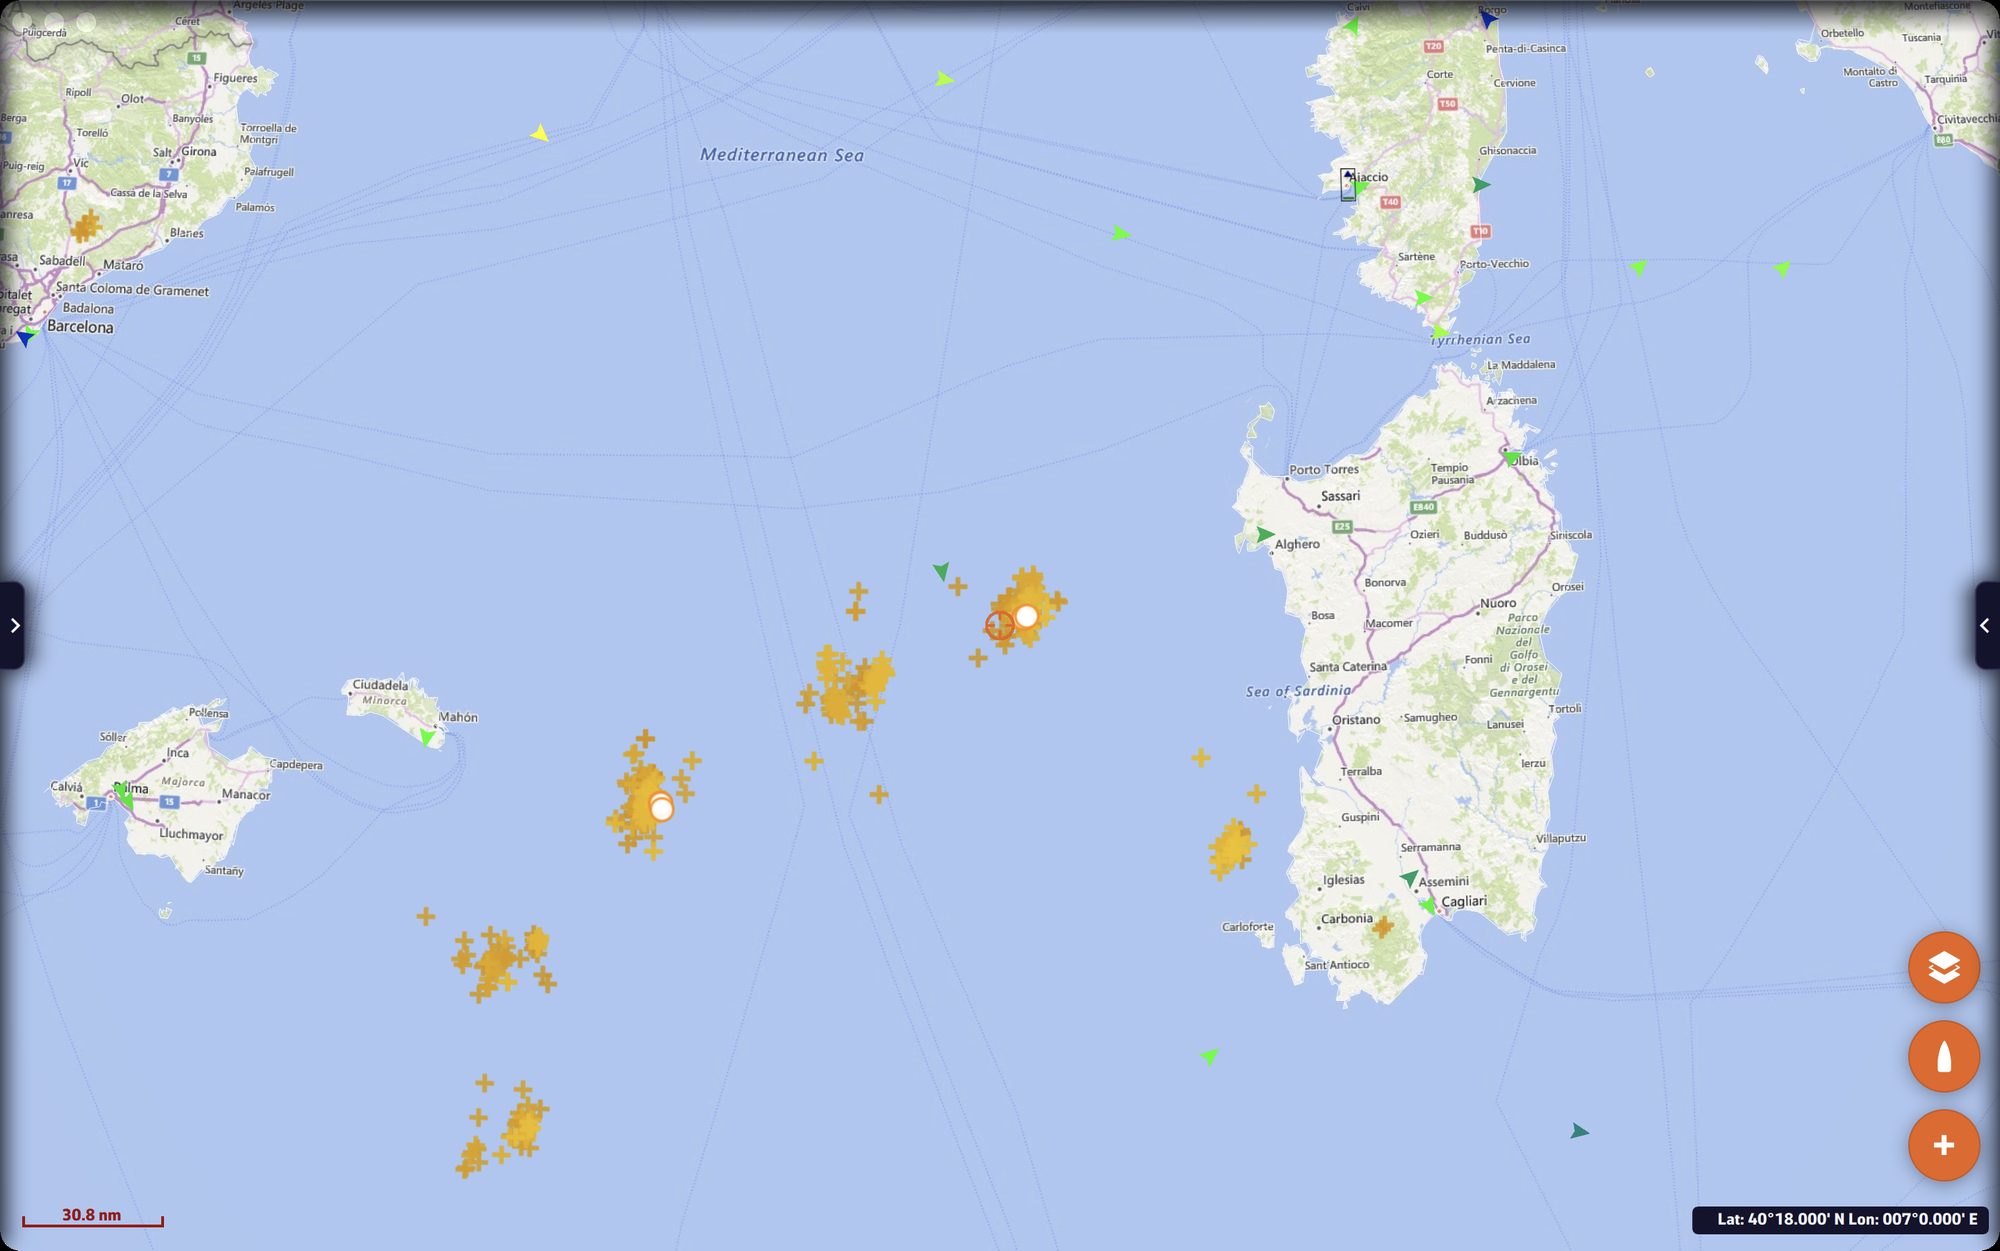
Lightningrecent lightning strikes
Thundera thunder sound when a strike lands in the visible part of the chart (box active if “Lightning” is ticked)
Rain radarprecipitation measured by weather radars
Isochronesthe isochrones of the displayed routings: the lines the boat can reach after the same time
Laylinesthe laylines: the courses at the polar’s optimal angle, upwind or downwind depending on the boat’s point of sail, port and starboard tack, that lead to the waypoint
Lat/lon gridthe grid of latitudes and longitudes
Cursor measure(computer) the boat’s distance, bearing and time to the point under the mouse
Auto measureon each tap on the chart, a ruler from the boat to the centre of the screen, with distance, bearing and time to get there; it disappears after two seconds without a gesture
Zoom buttonsthe “−” and “+” buttons at the bottom left of the chart

The time given by the measures is calculated from the speed of approach to the point, derived from the damped speed and course over ground (30 s by default, “Laylines and waypoint” damping setting); it is not displayed if the boat closes on the point at less than 0.3 knot (boat stopped, abeam or moving away) nor if it would take more than 99 h.

Each layer has its chapter: Weather: observations, charts and tides, Weather routing, Navigation: GPS, NMEA and AIS.

See also

↑ Contents

2.5 Operating Modes

Beginner

The essentials

Ashore, when preparing a trip, NavimetriX spares the battery: the device’s GPS only gives its position every now and then, and nothing is recorded. At sea, turn on Navigation mode: position every second, track recording, alarms active. Navigation mode requires the Premium subscription.

  1. Open the left drawer with the chevron handle on the left edge.
  2. Flip the “Navigation” switch at the top of the drawer (tapping the word “Navigation” also works).
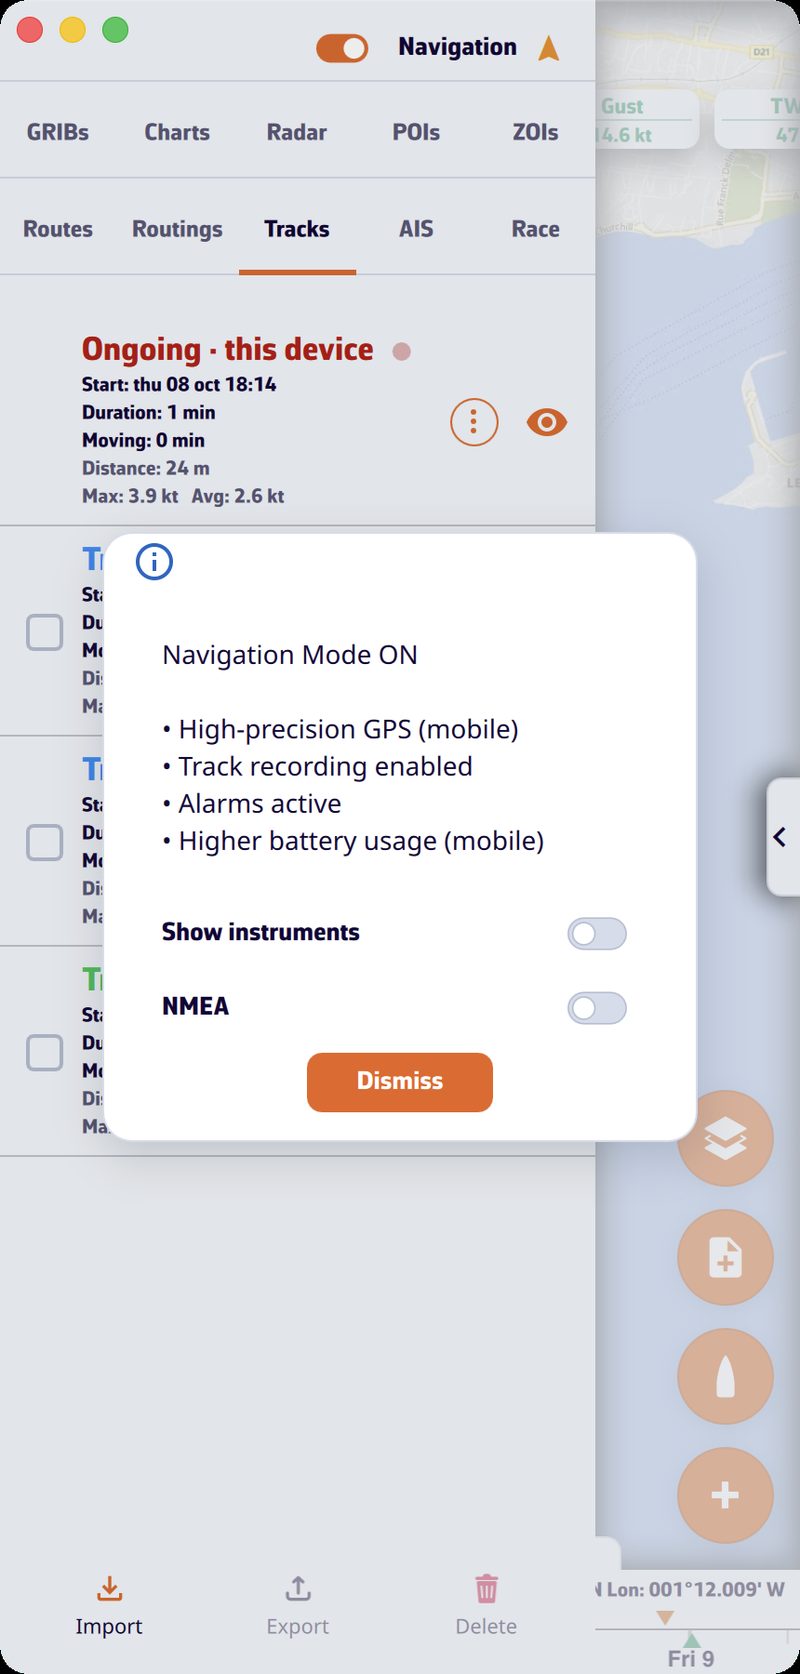
  3. The “Navigation Mode ON” window summarizes what changes. If needed, tick “Show instruments” and “NMEA” (reception of data from the onboard instruments), then close it.
  4. Back in port, flip the switch again: the track is closed and the GPS goes back to economy mode.

Left drawer with the “Navigation” switch on and the “Navigation Mode ON” window listing the effects, with the “Show instruments” and “NMEA” boxesLeft drawer with the “Navigation” switch on and the “Navigation Mode ON” window listing the effects, with the “Show instruments” and “NMEA” boxes

Going further

Navigation mode offNavigation mode on
Device GPS (mobile)low accuracy, one position every 30 secondshigh accuracy, one position per second
Trackno recordingrecorded, then closed when the mode stops
Alarmsdisabledactive
Battery (mobile)savingincreased consumption
  • Without a subscription, the switch immediately goes back off and the “Premium Feature” window opens.
  • The arrow icon, to the right of the word “Navigation”, indicates the position quality in Navigation mode: green for an accuracy of 15 m or better (blue with the colourblind-friendly colours), from orange to red up to 50 m, red with no position or when the GPS stream is interrupted.
  • The window’s boxes “Show instruments” and “NMEA” are remembered separately for turning the mode on and off: the window offers your last choice again.
  • On Android, a foreground service keeps the GPS, NMEA and alarms active with the screen off; its notification shows the position, speed over ground and course over ground. The screen stays on as long as the mode is active.
  • On iPhone and iPad, Navigation mode asks for precise location.
  • The add-to-logbook button appears above the boat button during recording.
  • In the browser, Navigation mode does not exist.

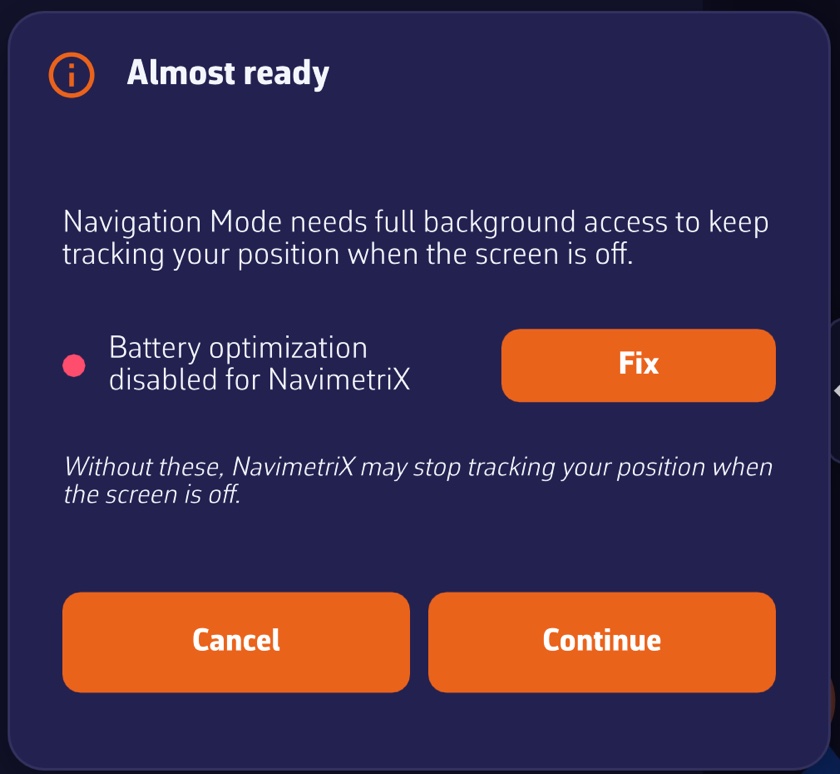
On activation, on phones and tablets, the app checks the system permissions. If any are missing, the “Almost ready” window lists the settings to fix, each with a “Fix” button: location permission, precise location, “Always” location (iOS), notifications and battery optimization (Android). “Continue” overrides for the session, “Cancel” gives up Navigation mode. See Preparing your tablet or smartphone.

Automatic stop in port. One hour after activation (six hours if you turned it on inland, on a lake for example), Navigation mode stops by itself if the GPS position stays ashore, with land all around within a 1 km radius, for one minute. An approximate position (without a real GPS) never triggers this stop, and an armed anchor alarm prevents it.

Anchor alarm. If an anchor alarm is armed, turning off Navigation mode disarms it: the app asks for confirmation (“Turn off” or “Keep watching”).

Instruments outside Navigation mode

You do not need Navigation mode to read the wind or depth at the pontoon: if the instruments are displayed and an NMEA stream arrives from the onboard instruments, their values update once per second, as long as the app is in the foreground. Outside Navigation mode, there is no track, no alarms and no history sparklines in the tiles.

Power saving

Settings > “General” > “Power” > “Energy saving” (off by default) lightens the device’s workload, useful on battery:

  • in Navigation mode, the instruments refresh twice per second instead of about thirty times;
  • the device’s GPS gives a position every two seconds instead of every second;
  • alarms are checked once per second instead of twice;
  • the animated particles disappear: wind is drawn as barbs, currents as arrows;
  • on Android, the Navigation mode notification updates every 15 seconds instead of 5.

This setting is specific to each device. It does not exist in the browser version.

Screen standby on Android. By tapping the arrow icon to the right of the word “Navigation”, you dim the screen to the maximum without turning it off: Wi-Fi stays active and NMEA reception continues. A tap anywhere (“Touch the screen to reactivate”) restores the brightness.

Demo mode

Demo mode replays a recorded passage, with moving AIS targets (simulated vessels, as shown by the Automatic Identification System), to discover the app at home. It goes through NMEA reception and therefore requires the Premium subscription.

  1. Open Settings > “GPS & NMEA”.
  2. In the “NMEA Protocol” list, choose “DEMO”. The “NMEA” switch turns on by itself.

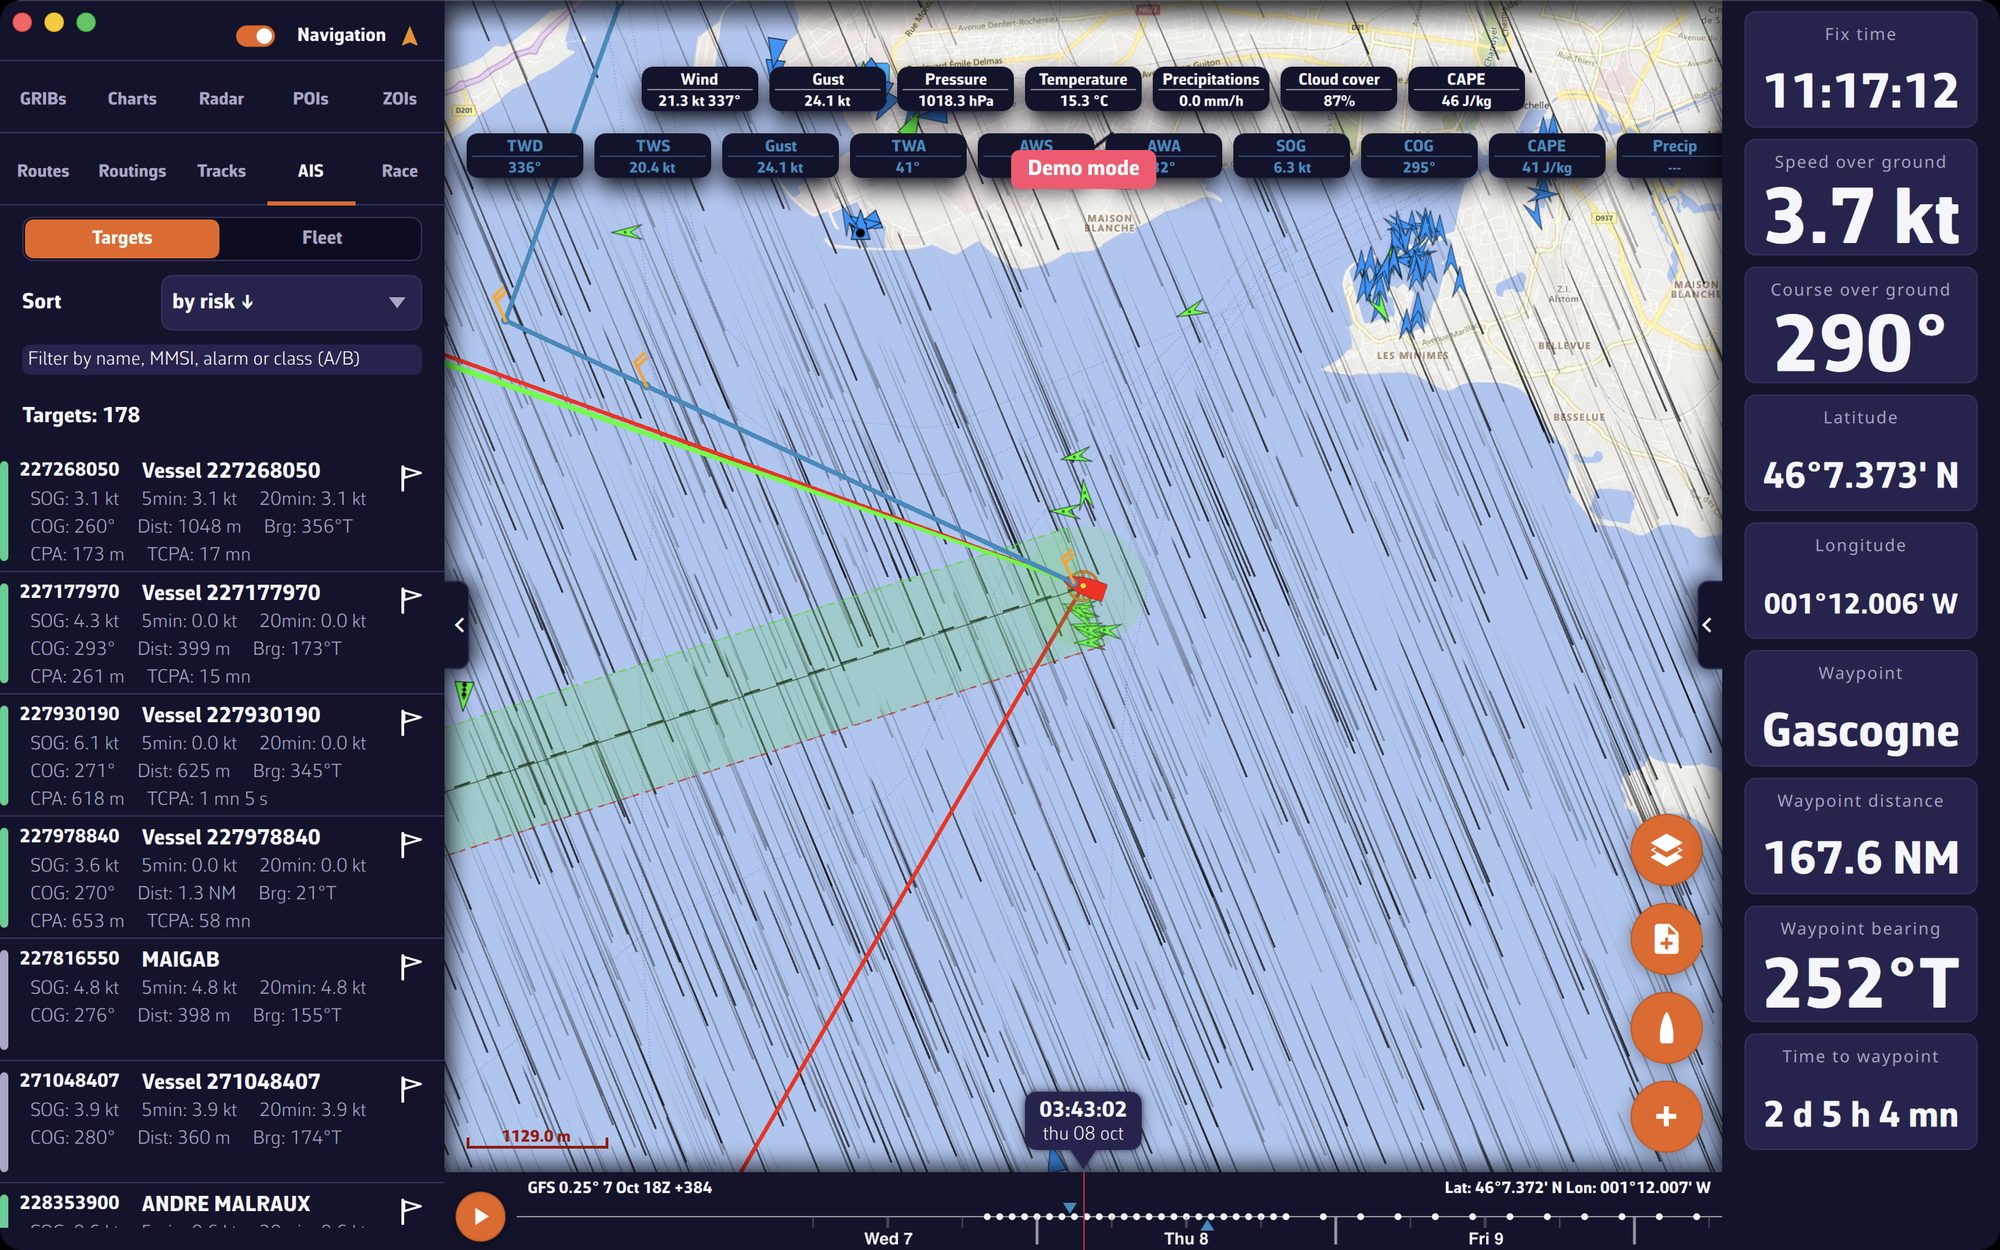
The app then closes the Settings, clears the current track, creates a POI (point of interest) “Gascogne” and starts a “Goto” to it, switches the GPS source to NMEA, turns on Navigation mode, displays the instruments and opens the AIS tab (the left drawer opens on tablet and computer). The “Demo mode” label is displayed for a few seconds and the chart centres on the simulated boat. You can select AIS targets, read their information and follow the instruments.

To stop, turn off the “NMEA” switch, turn off Navigation mode, or choose another protocol. The app removes the “Gascogne” POI and the “Goto”, and restores the protocol, GPS source and Navigation mode from before the demo. Demo data is never relayed on the network or sent over the Internet.

Demo mode: simulated boat, AIS targets and the AIS tab openDemo mode: simulated boat, AIS targets and the AIS tab open

See also

↑ Contents

↑ Contents

3 Settings

This chapter describes the settings common to the whole app: the theme and the General page (language, time zone, units, appearance), the My Boat page, then the phone or tablet settings to make before sailing. Settings specific to a feature (routing, alarms, NMEA, instruments) are described in that feature’s chapter.

3.1 General settings

Beginner

The essentials

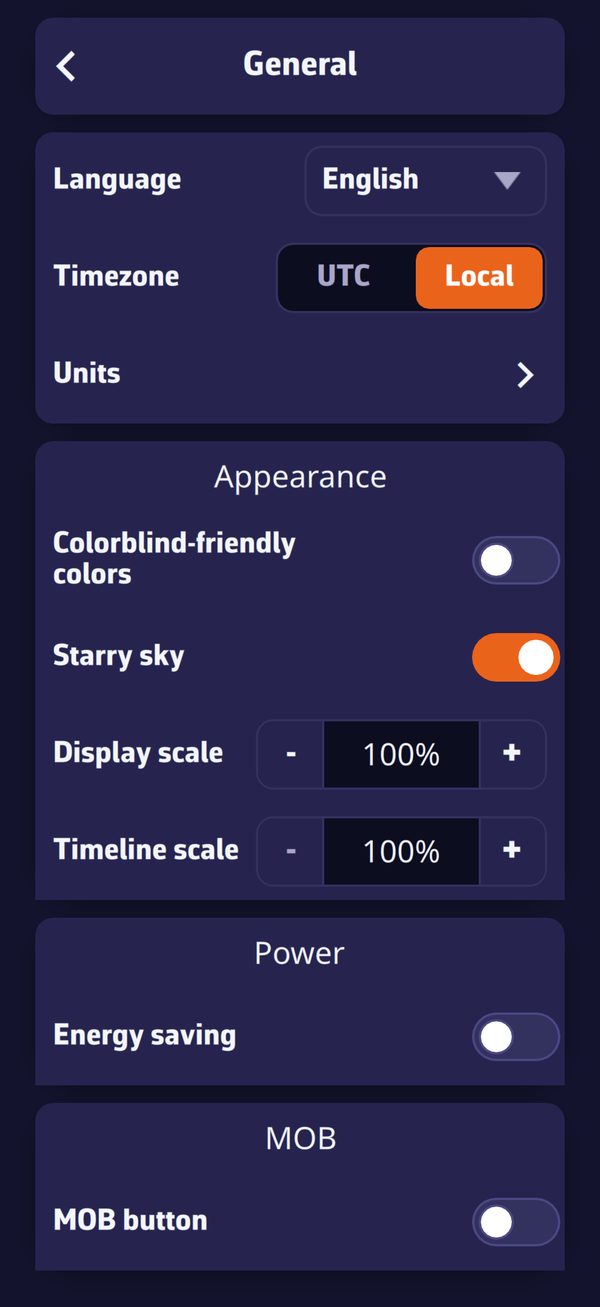
Settings > General: language, time zone, units, then the Appearance, Energy and MOB sectionsSettings > General: language, time zone, units, then the Appearance, Energy and MOB sections

Settings open with the chevron handle on the right edge of the screen. At the top of the drawer, the Theme is changed with one gesture; just below, the General page gathers the preferences for the whole app: language, time zone, units, appearance, energy, MOB (man overboard) button.

  1. Open Settings with the handle on the right edge.
  2. Choose the theme: “Light”, “Dark” or “Night”.
  3. Press “General” for the language, time zone and units.
  4. The chevron at the top left returns to the previous page; the handle closes the drawer.

Going further

The drawer’s entries

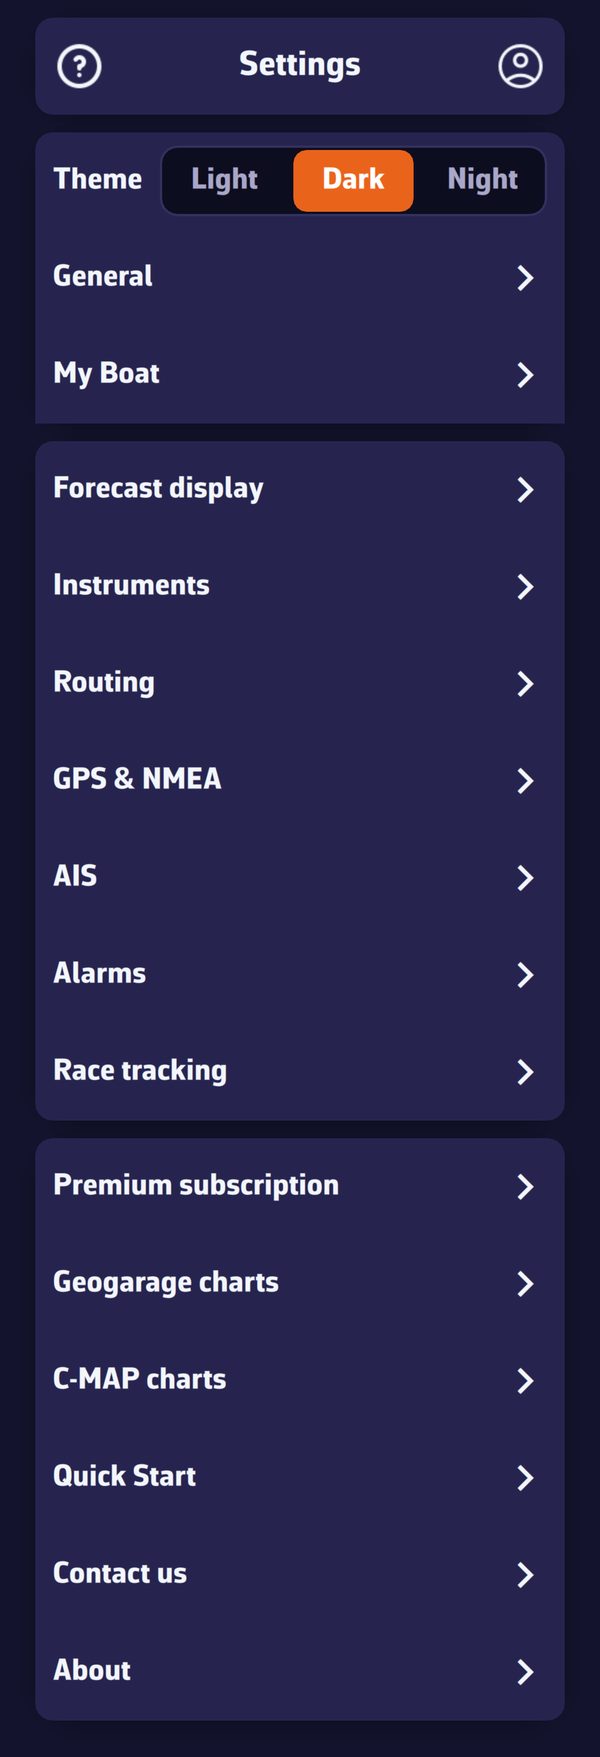
The root of the Settings drawerThe root of the Settings drawer

EntryContent
ThemeLight, Dark or Night
Generallanguage, time zone, units, appearance, energy, MOB button, keyboard shortcuts (this page)
My Boatidentity, dimensions, polar, vectors, track (see My Boat)
Forecast displaystyles, transparencies and isolines of the weather layers
Instrumentsinstrument strip and tiles (Premium)
Routingrouting calculation settings
GPS & NMEAposition source and connections to the onboard instruments
AISAIS target settings (Premium)
Alarmsnavigation alarms
Race trackingtracking a race
Premium subscriptionthe subscription window
Geogarage charts, C-MAP chartsnautical chart accounts and zones
Quick Startopens the getting-started guide
Contact uswrite to support
Aboutversion, usage statistics, version history

In the browser version, the “GPS & NMEA”, “Geogarage charts”, “Alarms” and “C-MAP charts” pages do not exist.

Theme

  • Light, Dark (default) or Night.
  • The Night theme draws the interface in red and amber on a black background, with low brightness, to preserve night vision at the chart table.
  • The theme is specific to each device: light in the cockpit, night at the chart table, without one imposing its choice on the other.

General page

SettingValuesDefaultScope
LanguageEnglish, French, German, Spanishthe system language at first launch (English if it is not offered)device
Time zoneUTC, LocalLocalaccount
Unitssub-page, see belowaccount
Colorblind-friendly colorson, offoffaccount
Starry skyon, offondevice
Display scalefrom 60 to 200%100%device
Font (Windows only)from 75 to 250%, in steps of 25%the Windows scaledevice
Timeline scalefrom 100 to 500%, in steps of 100%100%device
Energy savingon, offoffdevice
MOB buttonon, offoffaccount

“Device”: the setting stays on this device. “Account”: it follows your NavimetriX account to all your devices (see Synchronisation between devices).

Time zone. Times are shown in universal time (UTC) or in the device’s local time.

Colorblind-friendly colors. The colours that carry meaning (green and red of states, port and starboard, “now” cursors, AIS danger, wind scale) switch to a palette readable by people who confuse red and green. For example, the GPS quality icon changes from green to blue. This setting follows the person, so the account.

Starry sky. Purely decorative: stars, atmosphere halo, sun, moon and planets around the globe when you zoom out. Turning it off also relieves a struggling graphics processor.

Display scale. Enlarges or reduces the chart and what it carries, from 60 to 200%, handy for reading the chart without glasses. The menus keep their size.

Font (Windows). Enlarges or reduces the texts and menus of the whole app, from 75 to 250%. The change takes effect when the app is restarted.

Timeline scale. Stretches the time bar: the larger the value, the more room an hour takes there, and the finer the jump on touch, from 1 h at 100% to 5 min at 500%. See The main screen.

Energy saving. Spaces out GPS, instrument and alarm updates, and replaces animated particles with barbs and arrows. See Operating modes. Absent from the browser version.

MOB button. Shows the man overboard button at the bottom left of the chart, in Navigation mode with a GPS position. See the chapter Safety.

Keyboard shortcuts

On Mac, PC and Linux, the keyboard sets the displayed time, acts on the chart and opens the panels. The “?” key, or the “Keyboard shortcuts” button at the bottom of the General page, shows the list. Tablets, phones and the browser version have no shortcuts, and no such button.

KeysAction
← →Back / forward 1 hour
Shift + ← →Back / forward 15 minutes
Alt + ← → (⌥ on a Mac)Back / forward 1 day
Ctrl + ← → (⌘ on a Mac)Start / end of the forecast
SpacePlay / pause the forecast animation
HomeBack to now
+ −Zoom in / out
CCentre on the boat
NNorth up
RCalculate routing
GGRIB list
MMeasure a distance
LLayers
IShow / hide the instruments
TShow / hide the timeline
?Keyboard shortcuts

The time keys move the time of the selected GRIB, or that of the timeline when no GRIB is loaded, without leaving the period covered. They do nothing while the timeline is empty and during a Replay, like “R” and “G”. No shortcut reacts while you are typing in a text field, or while an open window or menu receives the keyboard.

“R” opens the “Routing” window, or starts the routing from the selected pivot point (see Study your routing and pivot points). “M” starts a new measurement, “L” opens or closes the layers menu. On a Mac keyboard without a Home key, fn + ← does the same.

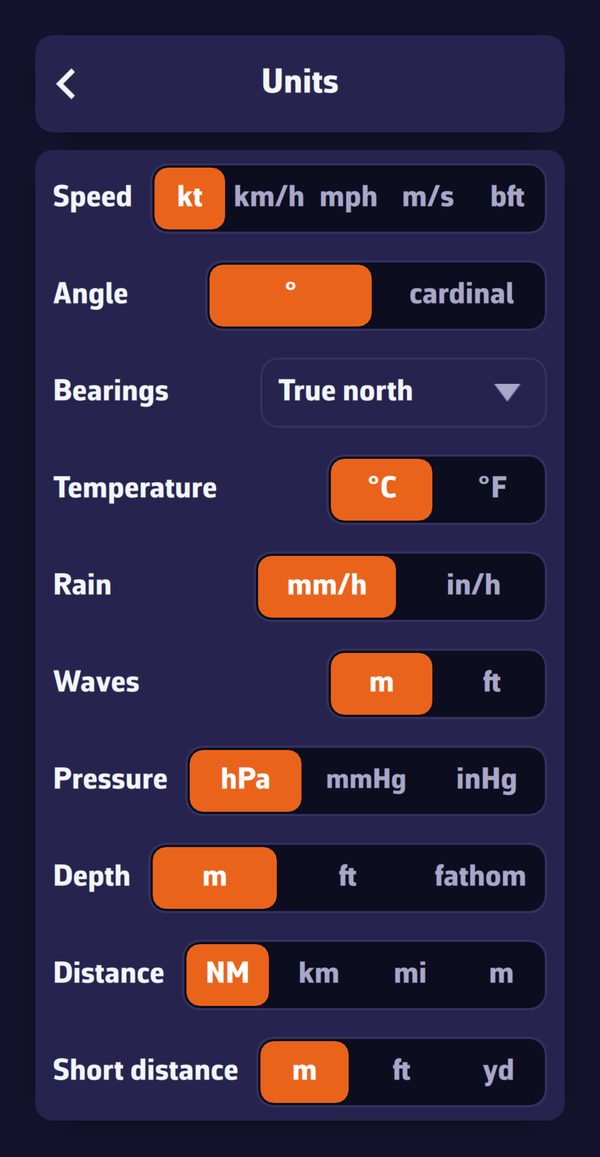
Units

Settings > “General” > “Units”:

Settings > General > UnitsSettings > General > Units

UnitChoices (the first is the default)
Speedkt, km/h, mph, m/s, bft (Beaufort scale)
Angle° (degrees), cardinal (cardinal points)
BearingsTrue north, Magnetic
Temperature°C, °F
Rainmm/h, in/h
Wavesm, ft
PressurehPa, mmHg, inHg
Depthm, ft, fathom
DistanceNM (nautical miles), km, mi, m
Short distancem, ft, yd

Bearings. This setting applies to bearings to a route point, a POI (point of interest) or an AIS target (a vessel received by AIS), to measurements and to the headings of route legs. They are written “°T” in true north, “°M” in magnetic, then corrected for magnetic declination.

See also

↑ Contents

3.2 My Boat

Beginner

The essentials

The My Boat page describes your boat to the app: its name and type, its dimensions, its polar (the table of its speeds according to the wind, which routing needs), and the way it is drawn on the chart when underway.

  1. Open Settings (handle on the right edge), then “My Boat”.
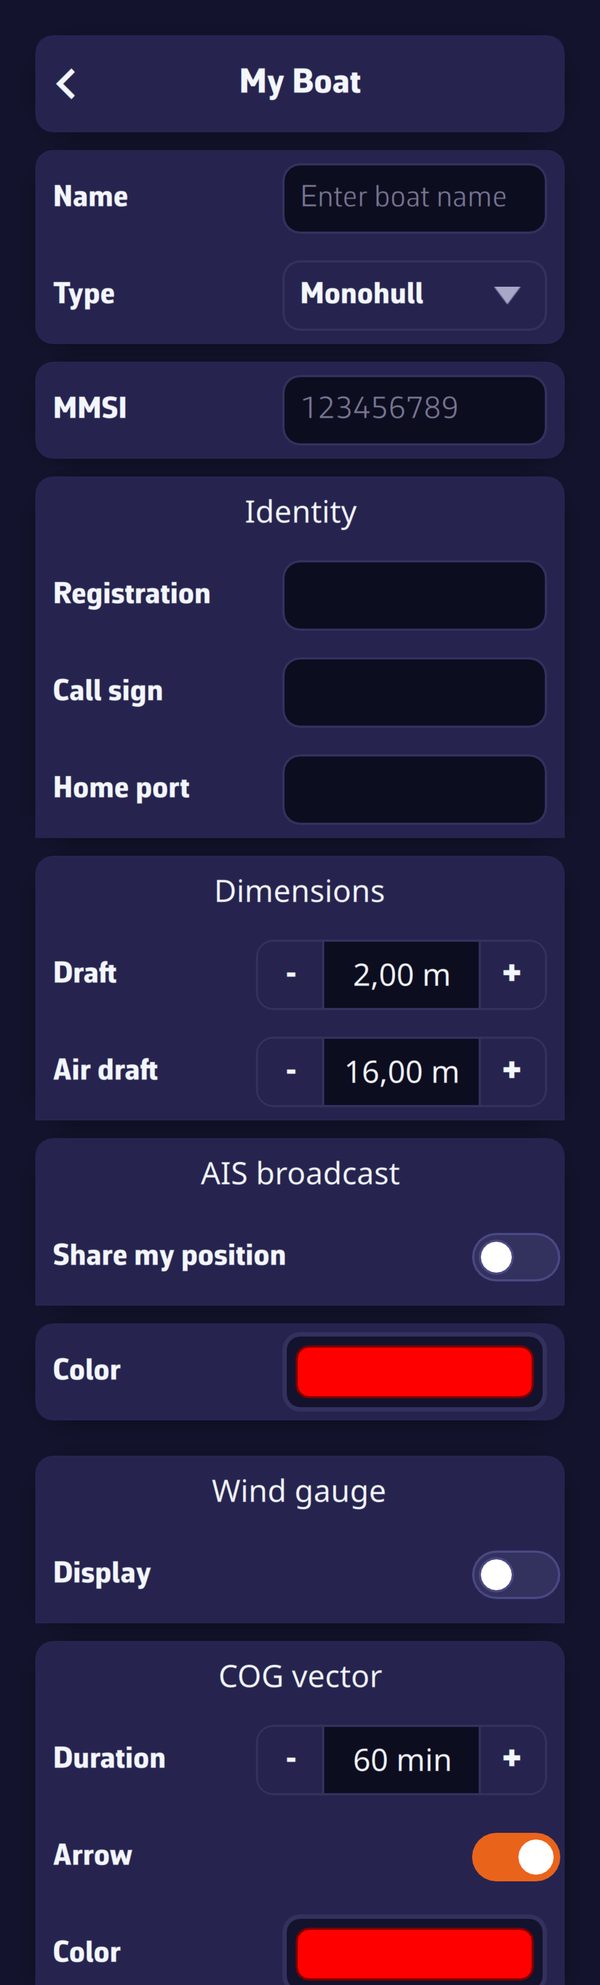
  2. Enter the Name and choose the Type: “Monohull”, “Catamaran” or “Trimaran”. The boat icon on the chart follows this type.
  3. Set the Draft and the Air draft.
  4. Press the Polar row and choose your boat’s polar. This is the most important setting for routing.

Going further

All these settings follow your NavimetriX account to your other devices.

Identity

Settings > My Boat: name, type, MMSI, identity, dimensions, AIS broadcast, polar and wind thresholdsSettings > My Boat: name, type, MMSI, identity, dimensions, AIS broadcast, polar and wind thresholds

SettingUse
Nameboat name, used by position sharing and the logbook; until you enter it, they have no name
TypeMonohull (default), Catamaran or Trimaran; changes the boat icon
MMSImaritime mobile service identity, 9 digits, the one of your VHF or AIS transponder (automatic identification system for ships)
Registration, Call sign, Home port“Identity” section; used at the head of the exported logbook

Dimensions

  • Draft: from 0 to 20 m, in steps of 0.10 m, 2.00 m by default.
  • Air draft: from 0 to 100 m, in steps of 0.10 m, 16.00 m by default.

The draft is used by coastal routing on C-MAP charts (avoiding shallows), by C-MAP AutoRouting, by the “Chart dangers ahead (C-MAP)” alarm and by the danger line of the depth instrument. The air draft is used by C-MAP AutoRouting and the “Chart dangers ahead (C-MAP)” alarm.

AIS broadcast

“Share my position” (off by default) broadcasts the boat’s position every 10 seconds on the NavimetriX network, in the form of an AIS message: other NavimetriX users who display AIS over the Internet see you as an AIS target. It is useful for a boat without an AIS transponder. The position never goes onto the public AIS network.

Conditions: Premium subscription, valid GPS position, no DEMO mode. Without an MMSI entered, the app uses an identifier specific to the device.

Colour

The colour of the boat icon in Navigation mode, red by default.

Polar and wind thresholds

  • Polar: opens the polar choice (library, import, calculation from the boat’s dimensions…). See the chapter Polars and Sailchart.
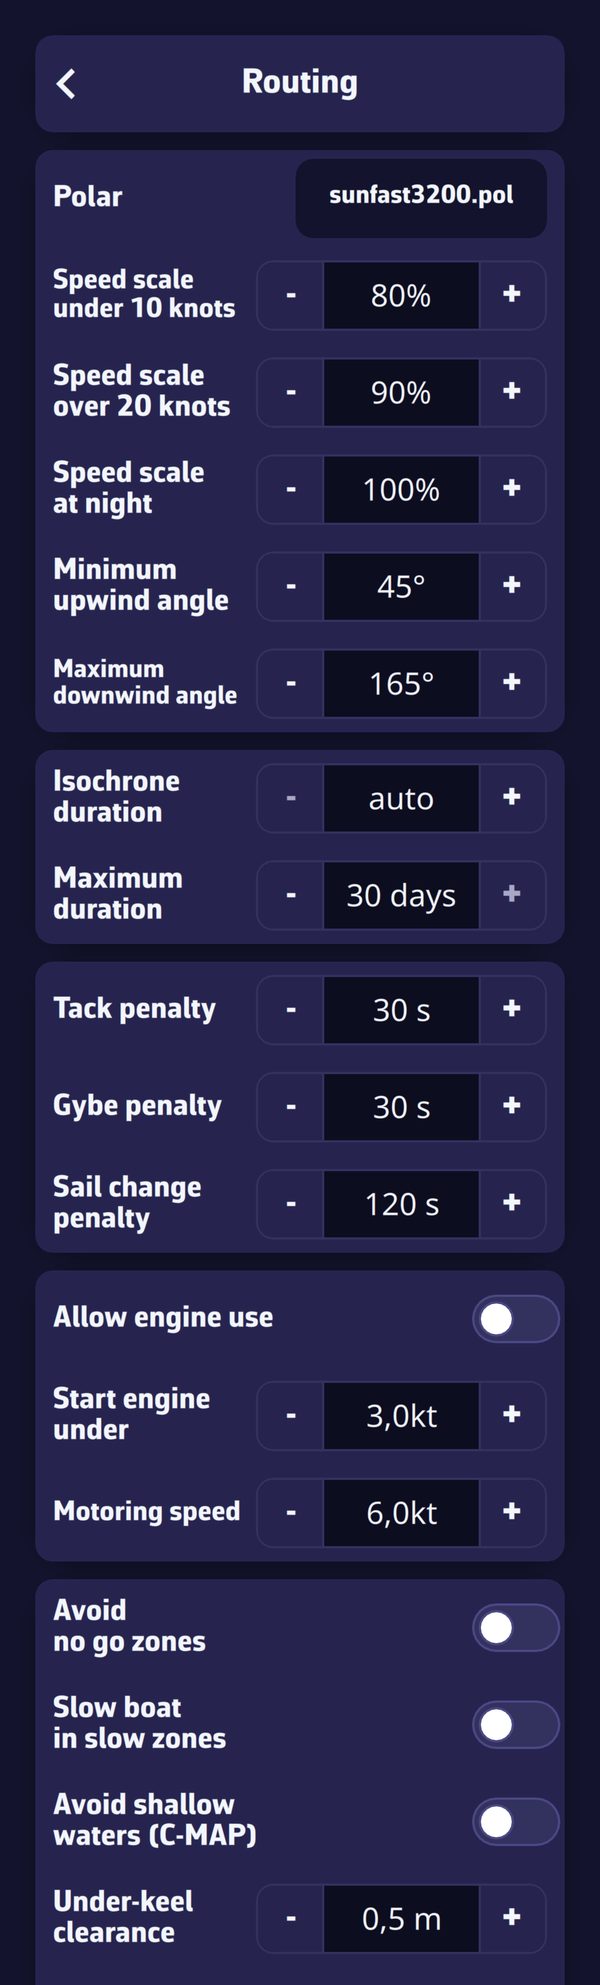
  • Light wind threshold (from 0 to 30 knots, 10 kt by default) and Strong wind threshold (from 5 to 50 kt, 20 kt by default): below the first, routing applies the “Speed scale under … knots” setting; above the second, the “Speed scale over … knots” setting; between the two, an intermediate value. These efficiencies are set in Settings > “Routing”. The strong wind threshold cannot go below the light wind threshold (the app bounds each by the other); if they are equal, the efficiency switches from one to the other at once, with no transition.

Wind gauge

“Display” (off by default) draws a wind gauge around the boat, in Navigation mode, when the app receives wind: a yellow triangle marks the true wind angle (TWA, the angle between the boat’s axis and the true wind), a cyan line the apparent wind angle (AWA).

COG vector and heading line

My Boat, COG vector and Heading line sectionsMy Boat, COG vector and Heading line sections

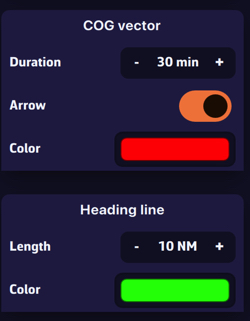
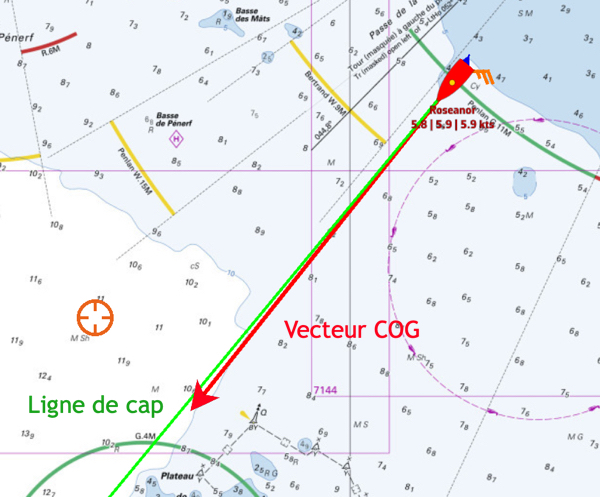
  • COG vector: a line that starts from the boat in the direction of its course over ground (COG, the real direction of travel), as long as the distance covered during the set Duration at the current speed over ground. Duration from 0 to 300 min (60 min by default), Arrow at the end (on by default), Colour red by default.
  • Heading line: a line along the boat’s axis, according to the heading (HDG), of fixed Length: from 0 to 300 NM, in nautical miles (60 NM by default), Colour green by default. It is displayed only if the app receives a heading.

Both lines are displayed only in Navigation mode, with a real GPS position.

On the chart, the COG vector in red and the heading line in greenOn the chart, the COG vector in red and the heading line in green

Cross track

“XTE limit” (from 0 to 2,000 m, in steps of 10 m, 500 m by default) sets the maximum distance tolerated on either side of the route (XTE: the lateral distance between the boat and the planned route). The cross-track corridor is therefore double: 500 m gives a corridor of 1,000 m. The corridor is displayed in Navigation mode, during a “Goto” or when following a route, from a close enough zoom. It is the same value as the “XTE” setting of the cross-track alarm (Settings > “Alarms”). See the chapter Safety.

Track

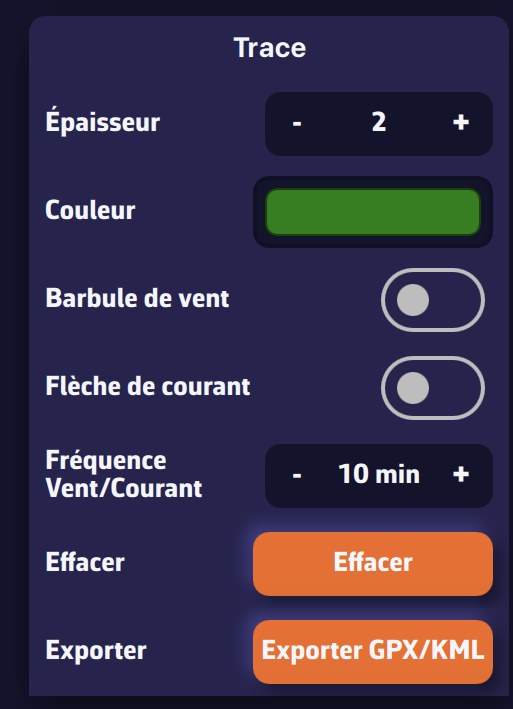
These settings apply to the track being recorded:

SettingValuesDefault
Widthfrom 1 to 52
Colourcolour chartdark red
Wind barbwind barbs along the trackon
Current arrowcurrent arrows along the trackon
Wind/Current frequencyfrom 1 to 360 min between two symbols10 min

There is no “Clear” button here any more: to delete the track being recorded, use ⋮ > Delete on the “In progress” row of the Tracks tab, after confirmation. The rest of the track display is set in the Tracks tab: see the chapter Tracks, replay and logbook.

See also

↑ Contents

3.3 Prepare your tablet or smartphone

Beginner

The essentials

When sailing, NavimetriX must keep the boat’s position and watch over the alarms, even with the screen off, and you must be able to reopen it with one gesture. A few phone or tablet settings contribute to this. The app itself checks the most important ones when Navigation mode is activated.

  1. Activate Navigation mode a first time at the dock (“Navigation” switch in the left drawer).
  2. If the “Almost ready” window opens, press “Fix” opposite each row: the corresponding system setting opens. Come back to the app: the row disappears once the setting is done.
  3. Then set the sleep and screen lock (see below).

“Almost ready” window on Android: the “Battery optimization disabled for NavimetriX” row with its “Fix” button, then the “Cancel” and “Continue” buttons“Almost ready” window on Android: the “Battery optimization disabled for NavimetriX” row with its “Fix” button, then the “Cancel” and “Continue” buttons

Going further

What the app checks

When Navigation mode is activated on a phone or tablet, the “Almost ready” window recalls that “Navigation Mode needs full background access to keep tracking your position when the screen is off.” It lists only what is missing:

RowPlatformWhy
Location permissioniOS and Androidwithout it, no position at all
Location set to “Always” (required for background)iOSto track position with the screen off or the app in the background
Precise Location enablediOS and Androidan approximate position is not enough for navigation
Notifications allowedAndroidthe service that keeps NavimetriX active in the background shows itself through a notification
Battery optimization disabled for NavimetriXAndroidotherwise the system may suspend the app to save battery

“Continue” bypasses this until the app’s next launch; “Cancel” gives up Navigation mode. Without these settings, NavimetriX may stop tracking your position when the screen is off.

On Android, if you answered “Don’t ask again” for location, the app can no longer ask you again: it offers “Open Settings” of the system. Android may then restart NavimetriX after the permission change; simply relaunch the app.

Screen sleep

  • Android: NavimetriX itself keeps the screen on as long as Navigation mode is active. The system’s sleep delay therefore only counts outside this mode.
  • iPhone and iPad: the app does not hold the screen. If you want to keep the chart displayed, set auto-lock to “Never” in the device’s display settings.
  • Screen saver on Android: in Navigation mode, tap the arrow icon to the right of the word “Navigation” to dim the screen as much as possible without turning it off. Wi-Fi stays active, reception of NMEA data from the onboard instruments continues, and a touch restores brightness. See Operating modes.

Onboard safety tips

These settings belong to the system, not the app, and depend on your use:

  • The unlock code: your crew must be able to open the navigation app without you, if you are not in a state to do so. Consider whether to remove the code while sailing.
  • Automatic spelling correction: turning it off avoids it altering the names of routes or POIs (points of interest) that you enter.
  • Wet fingers make the touchscreen temperamental: plan something to wipe it, and test the useful gestures (drawer handles, boat button, “+” menu) before you need them.

On computer

The same principles apply to an onboard computer: turn off sleep during navigation. On Windows, the installer opens the NMEA network reception ports in the firewall (see Platforms and installation).

See also

↑ Contents

↑ Contents

4 Weather: GRIB files and forecasts

This chapter explains how to get and read weather forecasts in NavimetriX: what a GRIB file is, how to choose a model, download it, manage the list of your files and display wind, pressure, rain, waves and currents on the chart. It also presents the meteogram, which shows how the forecast evolves at a single point, and historical weather, which lets you replay a past passage with the weather it actually had.

4.1 Understanding GRIBs and choosing a model

Beginner

The essentials

A GRIB file (short for GRIdded Binary) contains a weather forecast computed by a numerical model: values of wind, pressure, rain, waves or current on a grid of points, for a series of hours ahead. It is the standard format of weather services, compact and readable by most navigation software. NavimetriX downloads its GRIBs from our servers, for the area and the duration you choose. NavimetriX offers one of the most complete libraries of weather models.

To choose a model well:

  1. Choose the type of data: the atmosphere (wind, pressure, rain…), sea state (waves), currents, an ensemble model to judge uncertainty, or ASCAT observations (wind measured by satellite).
  2. Choose the coverage: a global model for a crossing or a forecast beyond a few days, a regional model for the coast and the next two to four days, if one exists for your area.
  3. When in doubt, take the ECMWF IFS global model, or let the magic wand of the area selection choose for you (see Download a GRIB).
  4. Look at the run shown under the model: it is the time of the computation. The more recent it is, the fresher the forecast.

Going further

Run, forecast time, step and grid spacing

  • The run is a complete computation of the model, launched at a fixed time from the observations of the moment. Most models are recomputed two to four times a day, and each run only becomes available a few hours after its start time. In the download window, the line Run: 20260930 12Z +51 reads as follows: run of September 30, 2026, started from the state of the atmosphere at 12:00 UTC (the “Z” stands for UTC time), with 51 hours of forecast. This duration depends on the model: AROME and AROME HD offer 51 hours from a single run, the maximum published by Météo-France. For GFS and GFS Wave, NavimetriX assembles the GRIBs on its servers: the first hours come from the latest run, the distant forecast times from the previous run. The file thus covers up to 384 hours (16 days) even while a new run is being published, and the first forecast hours arrive very early. The next line, “Next run in…”, announces the time before the next run.
  • The forecast time is the validity time of a forecast. A GRIB contains a series of them, which you scroll through with the timeline at the bottom of the screen.
  • The step is the interval between two forecast times: 1 h, 3 h, 6 h… A fine step follows the passage of a front or a breeze better, but makes the file heavier. Some models switch from an hourly step to a three-hour step beyond a certain lead time.
  • The grid spacing (or resolution) is the distance between two points of the grid. It appears in the model name: “ECMWF IFS 0.25° (28km)” has a point every quarter of a degree, about 28 km. The finer the grid, the better the relief, capes and coastal effects are rendered, and the heavier the file for the same area.

NavimetriX downloads in GRIB2 format. When importing a file from elsewhere, it also reads GRIB1.

The model families

In the download window, the “Type” list sorts the models into families:

  • Atmospheric: wind (with gusts), pressure, air temperature, cloud cover, precipitation and CAPE, depending on the model. CAPE (Convective Available Potential Energy) measures the energy available for thunderstorms: the higher it is, the more unstable the air.
  • Sea state: wave height, period and direction, and for some models wind sea and swell separately. See Waves and sea state.
  • Currents: ocean currents and tidal currents. See Currents.
  • Ensemble: an ensemble model runs dozens of computations from slightly different starting states. The October 2026 catalog offers two, GEFS (31 members) and ECMWF IFS ENS (51 members). The downloaded file gives the wind, and the pressure for GEFS, with their spread between members (“Wind Spread”, “Pressure Spread” in the layers menu): a small spread signals a reliable forecast, a large spread an uncertain situation. The members are used for ensemble routing.
  • Observations (ASCAT): the wind measured by satellite over the last few hours. This is not a forecast. See Satellite wind observations (ASCAT).

Global and regional models

The “Coverage” list separates global models, which cover the whole Earth, from regional models, sorted by “Region” (Europe, Americas, Other).

  • A global model reaches far into the future (up to two weeks and more), with a coarser grid. It is the tool for crossings and medium-range forecasts.
  • A regional model has a much finer grid and renders local effects better (thermal breezes, cape effects, channeled wind, thunderstorms), but it covers only one area and only goes a few days ahead.

NavimetriX only offers a regional model if it covers your area: those that do not touch it are removed from the list, as are regions with no useful model.

The list of models is served by our servers and refreshed when the application starts: a new model appears without any NavimetriX update. The detailed lists, with grid spacings and forecast ranges, are in the FAQ (see below). To see the area covered by each model, open the page Coverage areas of each model: the map is updated every 5 minutes.

How to choose

A few simple guidelines:

  • Offshore, compare several global models: ECMWF IFS, ECMWF AIFS (computed by artificial intelligence) and GFS. If they tell the same story, the forecast is solid; if they diverge, an ensemble model helps measure the uncertainty.
  • Coastal, for one to four days, prefer a fine regional model when one exists for your area (Arome on the coasts of France, for example).
  • Reliability decreases with lead time, whatever the model: beyond five to seven days, read a trend rather than a value.
  • For waves and current, choose a model as fine as your navigation: a global model offshore, a regional model near the coast.

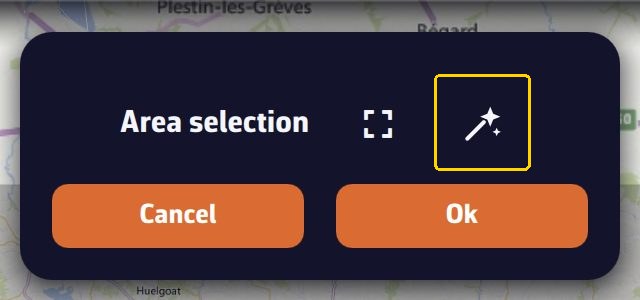
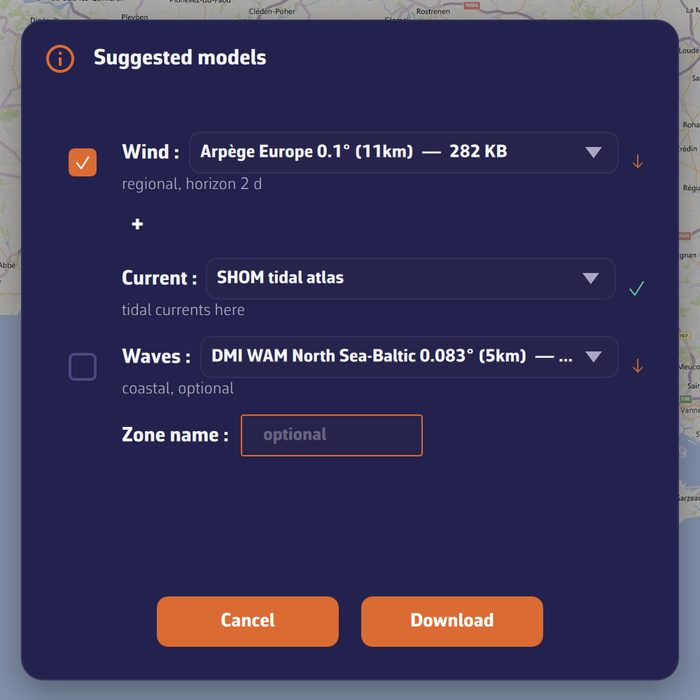
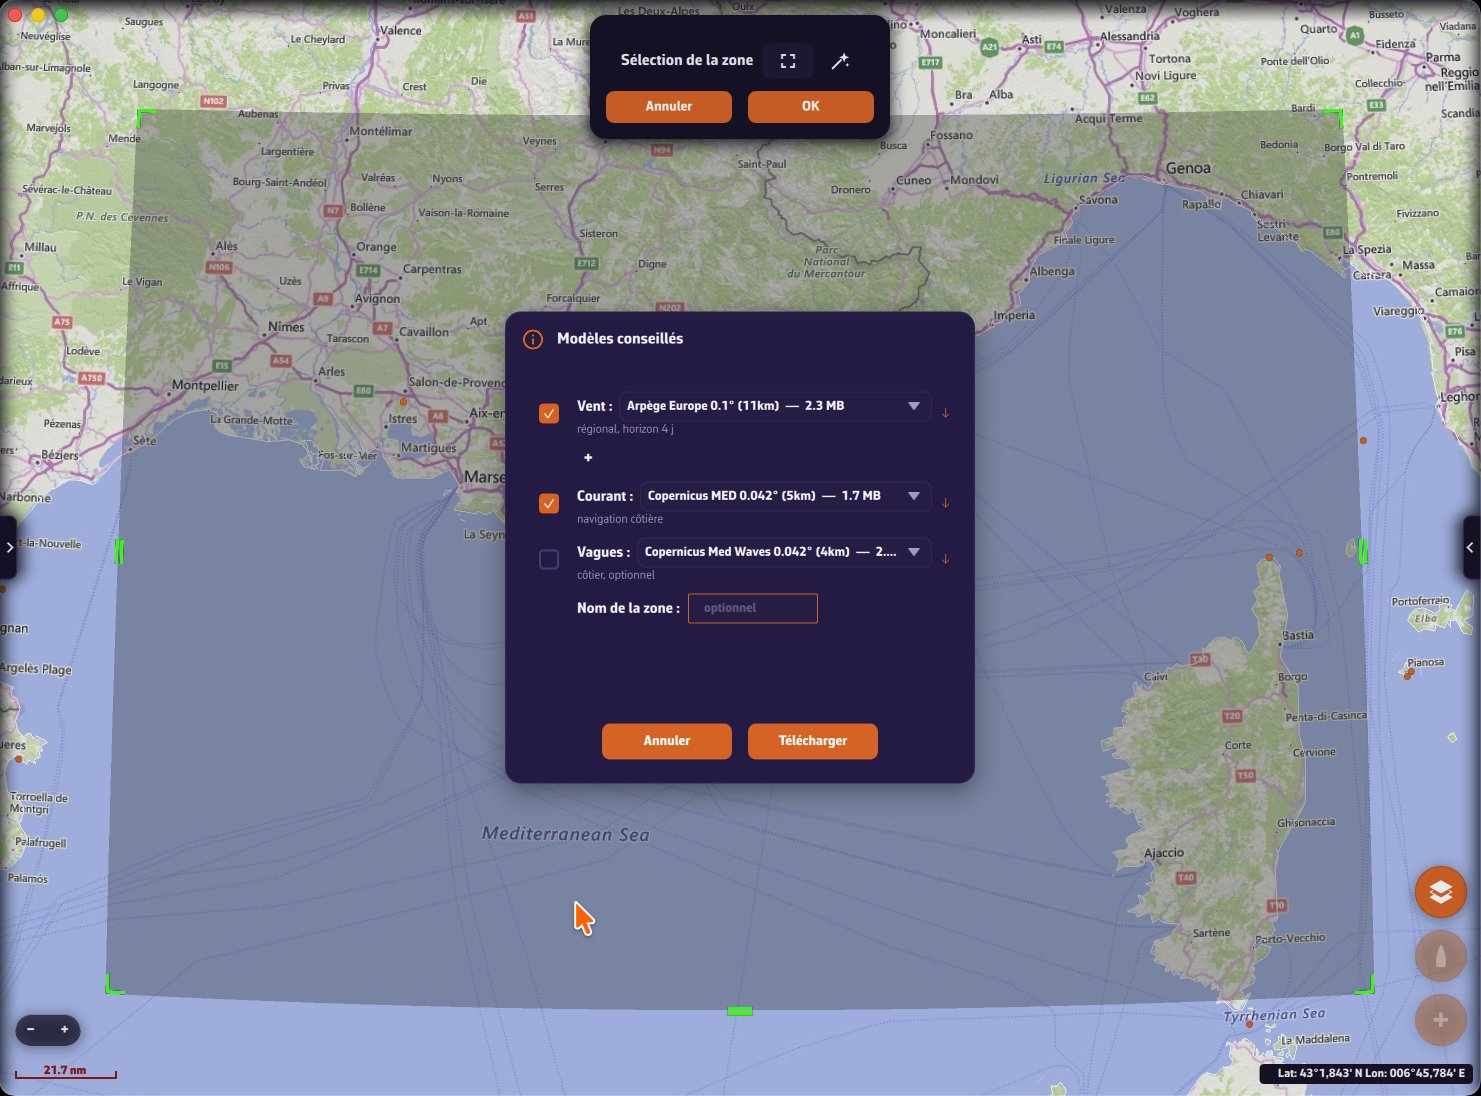
The magic wand of the area selection applies these principles for you: it suggests a wind model, a current source and a wave model suited to the size of the area.

“Area selection” banner: the magic wand, outlined in yellow, is to the right of the full-frame icon, above the “Cancel” and “OK” buttons“Area selection” banner: the magic wand, outlined in yellow, is to the right of the full-frame icon, above the “Cancel” and “OK” buttons

“Suggested models” window opened by the magic wand on an area of Brittany: a wind model, the SHOM current atlas, a wave model and the name of the area“Suggested models” window opened by the magic wand on an area of Brittany: a wind model, the SHOM current atlas, a wave model and the name of the area

Model description and coverage

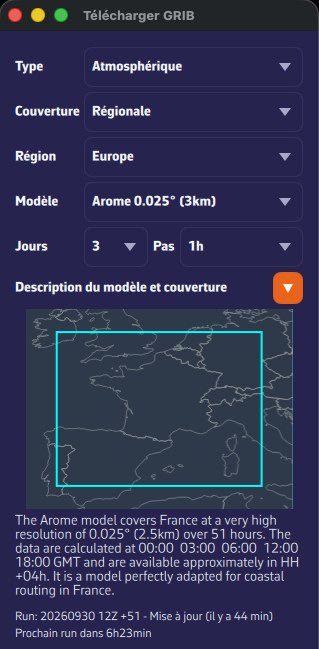
In the download window, the small triangular button on the “Model description and map coverage” row unfolds a small map, framed on the chosen model, where the area it covers is drawn in cyan, and below it a text presenting the model. This text comes from the catalog and only exists in English. The map shows the coverage of the model, not the area you have selected.

Download GRIB window on the Arome model: description unfolded, coverage drawn in cyan, Run and next run lineDownload GRIB window on the Arome model: description unfolded, coverage drawn in cyan, Run and next run line

Model status

Under the description, the line “Run: … - Updated (… ago)” gives the latest available run and its age, and “Next run in…” the time before the next one. If NavimetriX could not reach the status server, it shows “No update info available”.

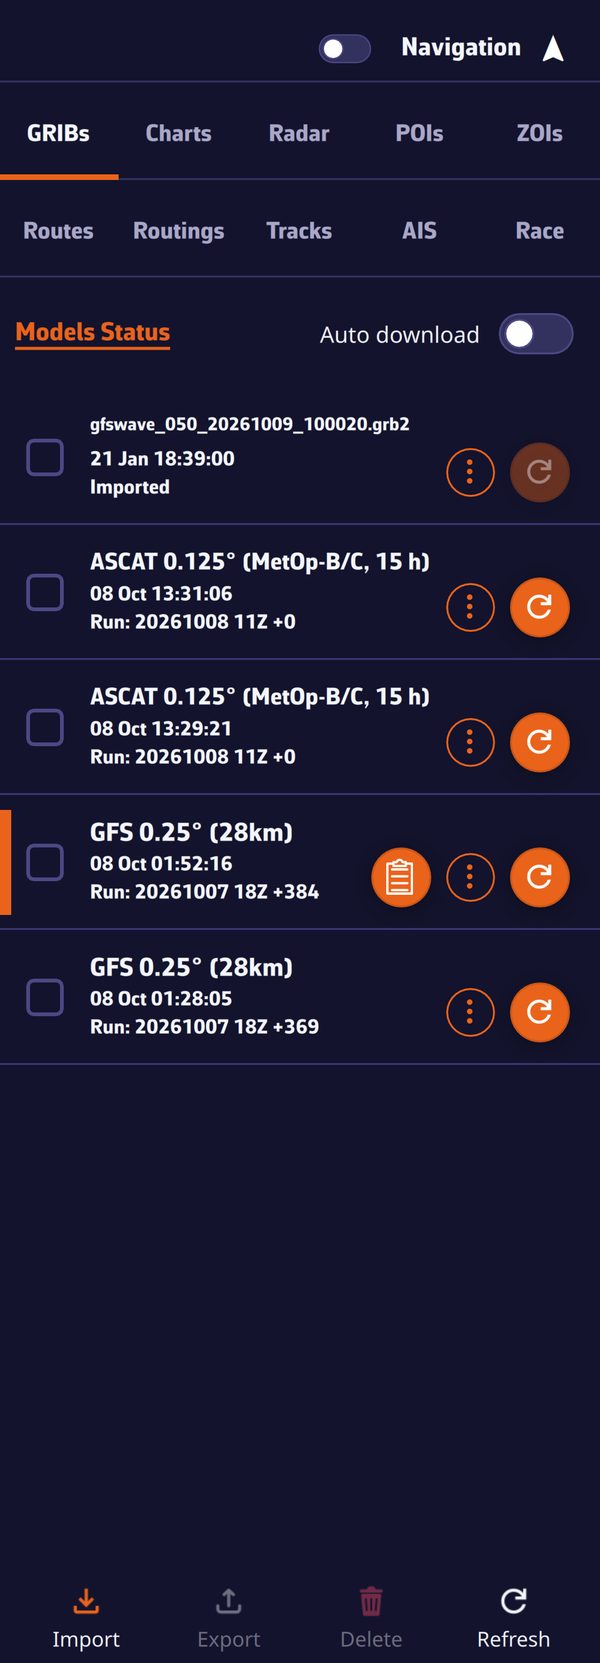
The “Models Status” link, at the top of the GRIBs tab of the left drawer, opens in your browser the page that gives the time of the latest runs of all models.

Without a Premium subscription

Without Premium, the download window only offers the “Atmospheric” type, the “Global” coverage and the GFS models. All the other models (ECMWF, ICON, the regional, ensemble, wave, current and ASCAT models) require the Premium subscription. See Installation, account and subscription.

See also

↑ Contents

4.2 Download a GRIB

Beginner

The essentials

A GRIB is downloaded for an area that you draw on the chart. You then choose the model, the number of days, the time step and the parameters, and NavimetriX prepares the file on our servers before downloading it. An Internet connection is required.

  1. Move and zoom the chart to your sailing area.
  2. Tap the round orange + button at the bottom right, then “Download GRIB”.
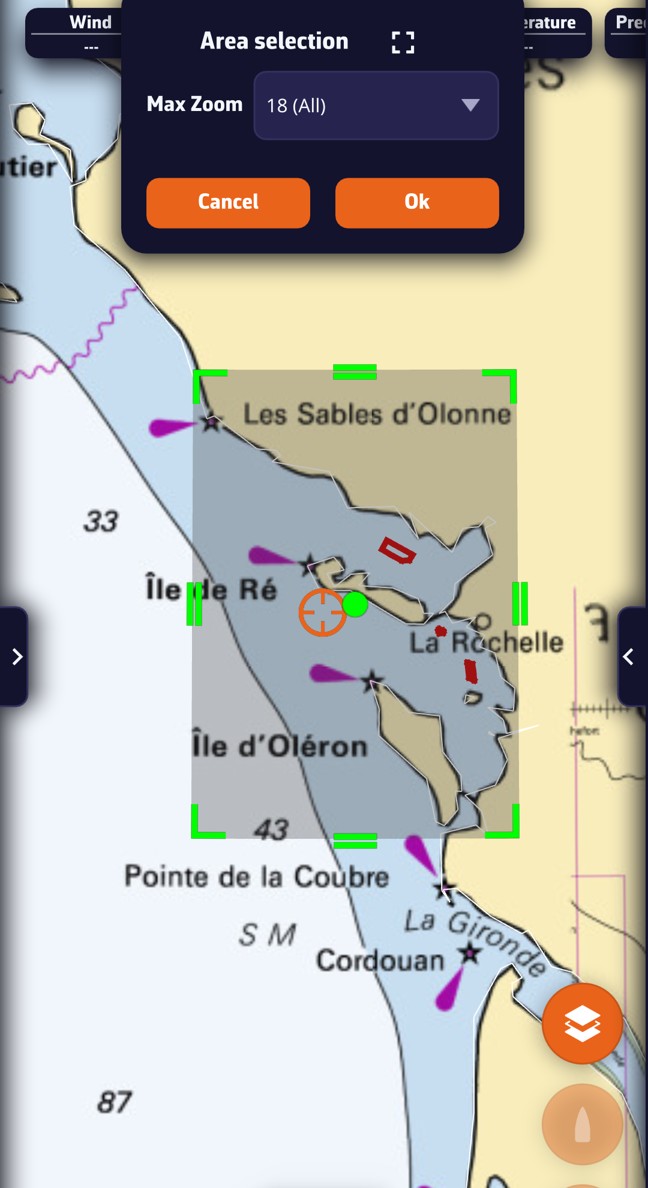
  3. A green rectangle appears on the chart, with the “Area selection” banner at the top of the screen. Adjust the area with the handles, then tap “OK”.
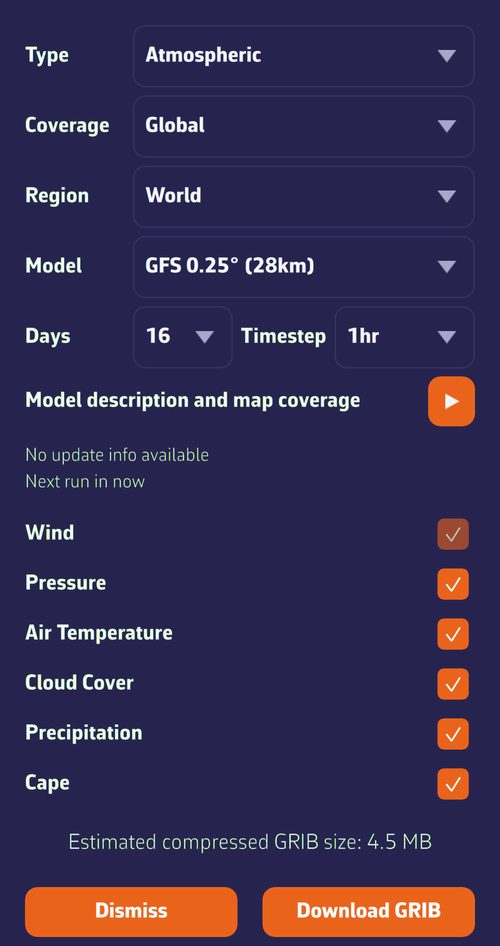
  4. In the “Download GRIB” window, choose the “Type”, the “Coverage”, the “Region” and the “Model”. When in doubt, keep the proposed values for “Days”, “Timestep” and the parameters.
  5. Tap “Download GRIB”. The file is displayed on the chart as soon as it has arrived, and joins the “GRIBs” tab of the left drawer.

To go faster, the magic wand in the “Area selection” banner chooses the models for you (see below).

Download GRIB window: type, coverage, region, model, days, step, parameters and estimated sizeDownload GRIB window: type, coverage, region, model, days, step, parameters and estimated size

Going further

Drawing the area

The starting rectangle covers four fifths of the visible part of the chart. The handles at the corners and at the midpoints of the sides resize it; the central handle moves it as a block. The rectangle is green, or sky blue in colorblind mode. The full-screen button in the banner resets it to the current view of the chart, and “Cancel” abandons.

Except for an ocean crossing, take an area a little wider than your sailing area: the wind that will matter to you tomorrow often comes from outside. There is no point in going too wide with a fine model, though: the file grows quickly.

Choosing the model

  • “Type”: “Atmospheric”, “Currents”, “Sea State”, “Ensemble” or “Observations (ASCAT)”.
  • “Coverage”: “Global” or “Regional”.
  • “Region”: “World”, “Europe”, “Americas” or “Other”.
  • “Model”: the model name with its grid spacing, for example “ECMWF IFS 0.25° (28km)”.

With regional coverage, only the models that touch your area are offered. If the area is entirely outside the chosen model, the download is refused; an area that partly overflows is accepted. NavimetriX remembers your last choices of type, coverage, region and model.

The triangular button on “Model description and map coverage” unfolds the model’s coverage map and its presentation. Below it, the “Run” line shows the latest available computation and “Next run in…” the time before the next one. See Understanding GRIBs and choosing a model.

Days and step

  • “Days” offers from 1 day up to the maximum forecast range of the model. The maximum is what is selected when the window opens.
  • “Timestep” offers 1 h, 3 h, 6 h, 12 h or 24 h, without going below the finest step of the model. NavimetriX takes the last step used if it is available, otherwise the finest.

Reducing the days or widening the step makes the file lighter, useful with a slow or satellite connection.

Parameters

One checkbox per family of parameters, if the model contains it: “Wind” (gusts included), “Pressure”, “Air Temperature”, “Cloud Cover”, “Precipitation”, “Cape”, “Waves”, “Currents”. All are ticked when the window opens. The first in the list (wind for an atmospheric model, currents for a current model, waves for a wave model) stays ticked and greyed out: it is the data that makes the file worthwhile. Untick the others to lighten the download. This choice is not remembered from one time to the next.

Size, limits and memory

  • At the bottom of the window, “Estimated compressed GRIB size:” updates with each setting, then “Actual GRIB size:” once the server has prepared the file. A size of several tens of MB most often signals a grid that is too fine for the area, too many days or too many parameters.
  • A file cannot exceed 300 MB. Beyond that, the estimate turns red with the mention “⚠ May exceed 300 MB download limit”, and a download that exceeds this size is interrupted.
  • On a device with less than 3 GB of RAM, a GRIB estimated at more than 50 MB is refused with the message “Insufficient RAM for this GRIB size”: reduce the area or the number of parameters.
  • An area smaller than two grid cells of the model is enlarged automatically.
  • If you already have a GRIB of the same model on the same area, NavimetriX invites you to update it from the list rather than download a second one.

During and after the download

Status messages follow one another: sending the request, preparing the file on the server, downloading with its percentage, then “GRIB file saved”. During the download, “Cancel” interrupts it. The window then stays open: you can follow up with another model on the same area, then “Dismiss”. On a computer, it opens in a separate window; on phones, tablets and in the browser, over the chart.

The last downloaded GRIB is displayed on the chart. If it does not appear, open the layers menu (round orange button at the bottom right) and check that “Color map” and “Particles” (or “Barbs”) are ticked. See Displaying forecasts on the chart.

Suggested models: the magic wand

The magic wand in the “Area selection” banner analyzes the drawn area and opens the “Suggested models” window:

  • Wind: the recommended model, with its size, its coverage (regional or global) and its horizon in days. The list offers the other suitable models of the same coverage, and the + button adds other wind models to compare.
  • Current: the “SHOM tidal atlas” as first choice when an atlas touches a coastal area, then the suitable current GRIBs, or “None”. See Currents.
  • Waves: a wave model, suggested by default for offshore sailing, optional for coastal.
  • Zone name: optional, 8 characters at most, shown in front of the name of these GRIBs in the list.

The choice depends on the size of the area, measured by its diagonal: under 100 miles, one day of forecast; up to 250 miles, two days; up to 500, four; up to 1,000, six; up to 2,000, ten; beyond, fifteen. A regional model is preferred as soon as it covers the whole area, with a grid spacing suited to its size and a file of 30 MB at most when possible. A wave model is ticked by default from 350 miles of diagonal; the current is ticked by default, and the SHOM atlas offered, up to 500 miles.

Each row can be ticked or unticked. “Download” fetches the missing files in parallel (all parameters, at the finest step), displays the wind on the chart and keeps the chosen current and waves as the routing sources. If everything is already there, NavimetriX says so with “Suggested models already downloaded”.

Suggested models window on an area of the Mediterranean: wind, current, waves and zone nameSuggested models window on an area of the Mediterranean: wind, current, waves and zone name

Without a Premium subscription

Without Premium, the window only offers the “Atmospheric” type, the “Global” coverage and the GFS models, with no particular message: the lists are simply shorter. The magic wand then only suggests GFS models for the wind, and the SHOM atlas for the current when it covers the area.

See also

↑ Contents

4.3 Managing the GRIB list

Beginner

The essentials

The GRIBs tab of the left drawerThe GRIBs tab of the left drawer

All your GRIB files are stored in the “GRIBs” tab, the first one in the left drawer. Open this drawer with the chevron handle (›) at the left edge of the screen. This is where you choose the file displayed on the chart, update it when the model has published a more recent forecast, and rename, export or delete it.

  1. Tap a row to display that GRIB on the chart. A colored bar at the left edge of the row marks the displayed file. Tap the same row a second time to remove it from the chart. Only one GRIB is displayed at a time.
  2. Update a file when the round button to the right of its row (circular arrow) lights up: a new run of the model has been published. Tap it, and the file is replaced by the new forecast.
  3. Update everything at once: the “Refresh” button at the bottom of the tab updates all the files that need it.
  4. Rename, export, delete: open the ⋮ menu of the row.

Going further

What a row shows

  • The name: the one you gave the file, otherwise the model name (“Arome 0.025° (3km)” for example), preceded by the zone name if you entered one in “Suggested models”. An imported file keeps its file name; an archive is called “ECMWF IFS 0.25° archive · start → end” (0.5° or 1° if the grid spacing was reduced).
  • The second line: the date and time of the download on this device, or “Missing” if the file is not there.
  • The third line: “Run:” followed by the run of the file for a downloaded model, “Imported” for an imported file, “Historical” for an archive.
  • The checkbox, on the left, is only used for grouped actions (exporting or deleting several files). It does not display the GRIB.
  • The buttons on the right: the meteogram (table icon, only visible on the displayed GRIB when the center of the chart is within its area, see Meteogram), the ⋮ menu, then the round refresh or download button.

The list is sorted by date of first download, the most recent at the top. An update does not change the order. Missing files are dimmed and placed at the bottom.

Updating a GRIB

A weather model is recomputed several times a day; each computation is called a run. NavimetriX learns of the publication of a new run in real time and also checks the state of the models every five minutes.

  • The round button on the row shows a circular arrow. It is only active if a run more recent than that of your file is available, and no download is in progress.
  • It shows a download arrow when the file is “Missing”: you requested it on another device of your account, and it is not yet on this one. Tap it to fetch it.
  • During the update, the “Preparing GRIB file” then “Downloading GRIB file” window shows the progress. The old file is then deleted: the row keeps its name, its zone and its parameters.
  • “Refresh”, in the bottom bar, updates all the files that have a new run and also downloads the missing files. The “Refreshing all GRIB files” window lets you “Cancel”.

Refresh button lit: a new run is availableRefresh button lit: a new run is available

Automatic download

The “Auto download” switch, at the top of the tab, is off by default. When on, it downloads the new runs of your GRIBs without you having to tap the button on each row:

  • as soon as you turn it on;
  • when the application returns to the foreground;
  • each time a new run is detected.

It only triggers on a new run; it then also fetches the “Missing” files. Without a new run, a file that is “Missing” on this device is fetched with its button or with “Refresh”. The setting is shared between the devices of your account. It requires an Internet connection; if your data plan is limited, leave it off and update by hand.

In the browser version, at first startup, all the GRIBs of the account are downloaded once.

Synchronization between your devices

The GRIB list follows your account: a file downloaded on one device appears on the others, marked “Missing” until you fetch it. The names you gave, the zone names, the “Auto download” setting and deletions also pass from one device to another, as does the choice of the displayed GRIB. Only imported files stay on the device where you imported them.

Renaming

  • ⋮ menu of the row, “Rename”: the “Rename GRIB” window offers the current name in the “GRIB name:” field.
  • Or a long press (or long click) on the name: it becomes editable in place. Enter or a tap outside the field saves, Esc cancels.

An empty name, or the model name itself, gives the file back its default name. The chosen name is kept across updates and on your other devices.

The zone name

When you use the magic wand of the area selection, the “Suggested models” window offers a “Zone name” field (8 characters at most, optional). This name is shown in front of the name of each of the GRIBs downloaded together, in the form “Zone - Model”: handy to recognize at a glance the files of a same sailing plan. A name given with “Rename” replaces it. See Download a GRIB.

Deleting

  • One file: ⋮ menu of the row, “Delete”.
  • Several files: tick their checkboxes, then “Delete” in the bottom bar.

NavimetriX always asks for confirmation. Deletion also applies to your other devices.

Importing an external GRIB

You received a GRIB by email, or downloaded it elsewhere: tap “Import” in the bottom bar. The “Import GRIB File” window accepts the extensions .grb, .grb2, .grib1 and .grib2, as well as .grb and .grb2 compressed as .bz2 or .gz, decompressed on import. For another extension (.grib for example), choose “All files”. Both GRIB1 and GRIB2 formats are read.

The file must contain wind, current or waves, otherwise NavimetriX refuses it and lists the parameters it found. An accepted file is displayed on the chart right away. It stays on this device: it is not synchronized, and it is not updated since it does not come from a model of the catalog.

Exporting and sharing

  • On a computer, “Export” asks for a destination folder (the Downloads folder is suggested).
  • On phones and tablets, the same button is called “Share” and opens the system share sheet (email, messaging, files…).

For a single file, use the ⋮ menu of its row; for several, tick them then use the bottom bar. A “Missing” file cannot be exported. A wave file in GRIB2 format is rewritten on export so that other navigation software can read it: its messages are sorted by forecast time and, if it has no separate swell, a copy of the total sea is added to it as swell.

Model status

The “Models Status” link, at the top of the tab, opens in your browser the page that gives, model by model, the time of the latest runs available on our servers.

See also

↑ Contents

4.4 Displaying forecasts on the chart

Beginner

The essentials

When a GRIB is displayed (tap its row in the “GRIBs” tab of the left drawer), the chart shows the wind by default: a color map according to its strength, and animated particles or barbs for its direction. Everything else in the file (gusts, pressure, rain, clouds…) is one gesture away.

  1. Tap the round orange layers button at the bottom right of the chart.
  2. In the “Forecast display” section, choose the parameter in the drop-down list (“Wind” by default).
  3. Check or uncheck “Color map”, “Particles” or “Barbs” (“Arrows” for currents and waves), and “Isobars”.
  4. Drag the timeline at the bottom of the screen to follow the evolution hour by hour.
  5. Read the values in the badges at the top of the chart: they give the forecast under the target (by default, the crosshair at the center of the screen).

The fine settings (color style, transparency, particle density…) are in the right drawer, “Forecast display”.

Layers menu, Forecast display section: Wind parameter, Value at cursor, Color map, Barbs, Isobars and Weather chartsLayers menu, Forecast display section: Wind parameter, Value at cursor, Color map, Barbs, Isobars and Weather charts

Going further

The parameters in the list

The list only offers what the file contains, in this order:

  • “Wind” and, for an ensemble model, “Wind Spread” (the standard deviation of the wind between the members);
  • “Gusts” and “Delta Gust” (the difference, in knots, between the forecast gusts and the mean wind: the larger it is, the more the gusts exceed the mean wind). “Delta Gust” is very useful for anticipating sail changes: sails are often chosen by the gusts rather than by the mean wind, especially on a multihull;
  • “Pressure” and, for GEFS, “Pressure Spread”;
  • “Currents” and “Waves”;
  • “Temperature” (air), “Precipitations”, “Cloud” (cloud cover), “CAPE” (energy available for thunderstorms) and “Snow”;
  • and, for an imported file that contains it, “Ice” (sea ice, in %).

NavimetriX remembers the chosen parameter for each GRIB. If a parameter is missing, check that it was ticked at download time.

Barbs, particles and arrows

  • Particles: thin animated trails that follow the wind, computed by the graphics card. This is the default mode. They are black, or white on the BING background.
  • Barbs: the classic meteorologists’ representation, arrows placed on the points of the GRIB grid, spaced further apart as you zoom out, with barbs that show the wind strength. More sober, they are also easier on the battery.
  • Arrows: for currents and waves. See Currents and Waves and sea state.

The choice between particles and barbs is made in the settings, on the “Wind display” row; the checkbox in the layers menu then takes the name of the chosen mode. It applies to the wind and what derives from it (gusts, Delta Gust, Wind Spread), to currents and to waves; it has no effect on pressure, temperature, rain, clouds and CAPE.

The “Forecast display” settings

Open the right drawer with the chevron handle (‹) at the right edge of the screen, then “Forecast display”. The page has one section per family of data.

Wind (also applies to gusts):

SettingValuesDefault
“Wind display”“Particles” or “Barbs”Particles
“Particle density”25 to 300%, in steps of 25100%
“Particle length”25 to 150%, in steps of 25100%
“Color map style”“Gradient” or “Iso areas”Gradient
“Land mask”on or offon
“Transparency”0 to 100%, in steps of 550%
“Iso areas step”1 to 20 knots5 knots

Pressure: “Color map style” (Gradient by default), “Isobars step” (1 to 5 hPa, 2 hPa by default), “Smooth isobars” (on by default) and “Transparency” (50%).

Precipitations, Temperature, Cloud and CAPE: a single row, “Transparency” (50% by default).

The Currents, Waves and Lightning sections are described on their own pages: Currents, Waves and sea state, Lightning and thunderstorms.

Right drawer, Forecast display page: Wind, Pressure and Currents sectionsRight drawer, Forecast display page: Wind, Pressure and Currents sections

Color map and iso areas

  • Gradient: the color varies continuously with the value. For wind, the scale runs from blue (calm) to magenta (strong wind) through green, yellow and red, over 0 to 40 knots.
  • Iso areas: the same scale, but in bands of equal value (for example every 5 knots with the default step), up to 50 knots for wind. The “Iso areas step” setting sets the width of the bands.
  • Rain is always painted in bands, from 0.1 to 50 mm/h. Temperature runs from purple (−20 °C) to red (+40 °C), CAPE from yellow to dark red (0 to 4,000 J/kg), and clouds from transparent to dark grey.
  • Transparency sets how much of the chart remains visible under the color map: at 0%, the color is opaque.

With the “Colorblind-friendly colors” setting (Settings, “General”), the wind scale drops the green. There is no legend on the chart: the exact value is read in the badges. At very high zoom levels, as soon as the chart shows a harbor, the color map fades out.

Land mask

When on (the default), the land mask hides the wind color map and barbs over land. It applies down to the harbor-approach view, a few miles across. Turn it off to see the wind over land too, for example among islands where you want to keep a sea-to-land continuity. Wave colors, on the other hand, are always masked over land.

Isobars

The “Isobars” checkbox in the layers menu only appears if the GRIB contains pressure. Off by default, it draws lines of equal pressure over the displayed parameter, whichever it is: wind and isobars together, for example. The spacing between two lines follows the “Isobars step” setting. Labels give the pressure along the lines (reddish below 1,013 hPa, bluish above, in your pressure unit), and the letters H and L mark highs and lows. Isobars fade out at very high zoom levels and while a routing is being computed.

Reading the values: the target and the badges

The row of badges at the top of the chart gives, for each parameter of the GRIB, the value under the target, at the time of the timeline: wind (strength and direction), gusts, pressure, temperature, rain, clouds, CAPE, snow, current, waves (height, direction, period). “—” means there is no value at that location. For an ensemble model, the spread is followed by the symbol σ (standard deviation).

Tap a badge: a curve of that parameter over the whole duration of the GRIB, at the target point, appears under the badges. Tap it again to hide it. To see all the parameters at once, as a table, see the Meteogram.

The “Target” list in the layers menu chooses the point that is read: “Screen center” (the default), “GPS position”, one of the visible POIs, or “Disabled” to hide the badges.

The “Wind” badge tapped: the wind and gust curve over the whole forecastThe “Wind” badge tapped: the wind and gust curve over the whole forecast

Value at cursor (computer)

On a computer, the “Value at cursor” checkbox in the layers menu shows, next to the mouse pointer, the value of the displayed parameter at that spot: direction then strength for wind, height, direction and period for waves. It is off by default, and disappears while the chart is being moved, over a clickable object and outside the GRIB area. It does not exist on touch screens.

The timeline

Drag the timeline (or use the mouse wheel) to move from one forecast time to the next; all the weather layers follow. Tap the time bubble to return to now. The play button loops through the forecast, over the duration of the GRIB (or of the displayed routing).

Energy saving

The “Energy saving” setting (Settings, “General”) replaces particles with barbs for the wind and with arrows for currents, and greys out the corresponding rows of “Forecast display”. It does not exist in the browser version.

See also

↑ Contents

4.5 Meteogram

Expert

The essentials

The meteogram presents, as a table, the whole forecast of a GRIB at a single point: one row per forecast time, one column per parameter. You see at a glance when the wind picks up, when the pressure drops or when the rain arrives, without scrolling the timeline.

  1. Display the GRIB you want on the chart (tap its row in the “GRIBs” tab of the left drawer).
  2. Center the chart on the point you are interested in: your anchorage, a cape to round, the starting point.
  3. On the row of the displayed GRIB, tap the table-shaped button, to the left of the ⋮ menu. It only appears if the center of the chart is within the GRIB area.
  4. The table opens on the row for the time shown by the timeline, highlighted.

The meteogram of a GRIB: one row per hour, the current hour highlightedThe meteogram of a GRIB: one row per hour, the current hour highlighted

Going further

The point and the file read

The meteogram reads the displayed GRIB, and only that one: to compare two models, open the meteogram of one, then display the other and open its meteogram. It gives the values at the center of the chart at the moment you open it; moving the chart afterwards does not change the table. For another point, recenter the chart and reopen it.

Its title shows the model name and its run, not the name you may have given the file.

The columns

The first column, “Time”, stays fixed when you scroll the table. The times follow your time zone setting (UTC or local time); in UTC, they carry the mention “UTC”. The table covers the whole duration of the GRIB, at its step.

On computer and tablet, the columns are, in order:

  • a wind arrow, colored according to the wind strength (the colors follow the colorblind mode if it is on);
  • “Wind Speed”, “Wind Direction” and “Gust”;
  • “Pressure” and “Temp.” (air temperature);
  • “Rain”, in mm/h (a dash below 0.1 mm/h);
  • “Cloud Cover”, in %;
  • “CAPE”, in J/kg (a dash below 1 J/kg). CAPE measures the energy available for thunderstorms: the higher it is, the greater the risk of storms;
  • “Snow”, in %;
  • “Current Speed” and “Current Dir.”;
  • “Wave Height” (in m), “Wave Dir.” and “Wave Period” (in s).

Only the columns present in the GRIB are displayed: a wave file only shows waves, an atmospheric file without precipitation has no “Rain” column. Wind, gusts, pressure, temperature and current follow your unit settings, and the table updates if you change them. Directions follow the “Angle” unit setting (degrees or cardinal points).

On a phone, the headers are abbreviated to fit the width: SPD (wind speed), DIR (direction), GUST (gusts), PRES (pressure), TEMP (temperature), RAIN (rain), CLOUD (clouds), CAPE, SNOW (snow), CUR (current), WAV (wave height), PER (period).

Moving around the table

Scroll the table vertically and horizontally, with the mouse wheel or your finger. The row for the time shown by the timeline stays highlighted and follows the timeline if you move it: a simple way to find in the table the moment you are looking at on the chart.

A curve rather than a table

To follow a single parameter as a curve, tap its badge in the row at the top of the chart: the curve of that parameter over the whole duration of the GRIB, at the target point, appears under the badges. See Displaying forecasts on the chart.

Computer, mobile and browser

On a computer (macOS, Windows, Linux), the meteogram opens in a separate window, titled “Meteogram:” followed by the model name; close it like an ordinary window. On phones, tablets and in the browser version, it opens full screen, with a “Dismiss” button.

See also

↑ Contents

4.6 Waves and sea state

Expert

The essentials

Wave models (the “Sea State” type in the download window) describe the sea in a simplified way: its height, period and direction. Many distinguish the wind sea, raised by the local wind, from the swell, which comes from farther away, next to the total sea that combines the two. NavimetriX displays the height in color, the direction as arrows, and all the values in the badges at the top of the chart. Wave models require the Premium subscription.

  1. Download a “Sea State” GRIB for your area (see Download a GRIB).
  2. Display it from the “GRIBs” tab of the left drawer. In the layers menu, the displayed parameter is “Waves”.
  3. Tick “Color map” for the height and “Arrows” for the direction.
  4. Under the target, read the total sea, the wind sea and the swell: height, direction and period, then the steepness of the sea.
  5. Tap a badge to open its curve over the whole duration of the file.

Wind sea and swell on the chart: Total sea, Wind sea, Swell and Steepness badges, black arrows for the wind sea and red arrows for the swellWind sea and swell on the chart: Total sea, Wind sea, Swell and Steepness badges, black arrows for the wind sea and red arrows for the swell

Going further

Total sea, wind sea and swell

  • The height is the significant wave height, the usual measure of sea state: it corresponds roughly to what an observer estimates by eye. Some individual waves are noticeably higher.
  • The period is the time, in seconds, between two crests. A long swell (high period) is more comfortable than a short, steep wind sea of the same height.
  • The direction is the one the waves come from, as for the wind: a 270° swell arrives from the west.

When the file contains the wind sea or the swell, the “Waves” badge becomes “Total sea”, and two badges are added: “Wind sea” and “Swell”. Each gives the height, direction and period; “—” means a value is missing.

Tap a badge to open its curve at the target point, over the whole duration of the file:

  • the height as a solid orange line, on the left axis, in meters;
  • the period as light blue dashes, on the right axis, in seconds;
  • the direction as arrows, in a row at the top of the graph, and as a large arrow on the curve at the displayed time. As on the chart, the arrows show the direction in which the waves travel.

Tap the curve to move through time; tap the badge again to close the graph.

Total sea curve: height in orange, period as light blue dashes on the right axis, direction arrows at the topTotal sea curve: height in orange, period as light blue dashes on the right axis, direction arrows at the top

The arrows

The “Arrows” checkbox in the layers menu displays the wave direction:

  • with a file that distinguishes wind sea and swell, two arrows per grid point: the wind sea in the color of the chart (black, white on the BING background) and the swell in red. The total sea appears in grey, only where the model gives neither of the two;
  • with a total-sea-only file, one arrow in the color of the chart.

The arrows start from the grid point and show the direction of travel of the waves, the opposite of the badges, which give the direction they come from. Their length grows with the height. No arrow starts from land.

The color map

The color follows the height of the total sea, from blue (calm sea) to magenta (rough sea), over 0 to 5 m. It is always masked over land, whatever the “Land mask” setting of the wind.

The settings are in the right drawer, “Forecast display”, “Waves” section:

SettingValuesDefault
“Color map style”“Gradient” or “Iso areas”Gradient
“Transparency”0 to 100%, in steps of 550%
“Iso areas step”0.2 to 2.0 m, in steps of 0.20.2 m

In “Iso areas”, the sea is painted in bands of the chosen height, and the band under the first step stays transparent. There is no setting for the arrows.

Forecast display drawer, Waves section: color map style, transparency and iso areas stepForecast display drawer, Waves section: color map style, transparency and iso areas step

Steepness

Steepness is the ratio between the wave height and the wavelength, expressed as a percentage. At equal height, a short sea is steeper, more hollow and harder on the boat than a long swell: 2 m of swell at 12 s gives a steepness of 0.9%, 2 m of wind sea at 5 s gives 5.1%.

NavimetriX computes it with the deep-water wavelength, from the height and period in the GRIB, for the total sea and for the wind sea, and keeps the higher of the two. The swell, long by nature, is not part of the calculation. Seas under 0.5 m are ignored: a chop of a few centimeters would give a high steepness that means nothing for a boat.

SteepnessWhat is generally observed
Around 2%Long swell, gentle sea
3 to 4%Well-developed wind sea, a few whitecaps
4 to 5%Whitecaps everywhere, frequent breaking
Beyond 5 to 6%Young, short sea (strengthening wind, wind against current): crests often break

These guidelines apply to the mean steepness of the sea state. An isolated wave breaks at about 14% (1/7), but the largest waves of a sea reach about twice the significant height: they approach that limit when the mean steepness exceeds 6 to 7%. Offshore, such values remain rare: on a 16-day global GFS Wave, fewer than one point in a thousand exceeds 5%. This calculation takes neither depth nor current into account, which steepen the sea over shoals and in wind against current.

Steepness can be read:

  • in the “Steepness” badge, next to the wave badges; tap it to open its curve, graduated in %, without a wave period in the GRIB, steepness cannot be computed and the curve does not show a calm sea;
  • as a color map: in the layers menu, choose “Steepness” instead of “Waves”. The sea stays transparent below 1.5%, then goes from green (2%) to yellow (3%), orange (4%), red (5%) and dark red from 6%. The direction arrows remain displayed, and the color map is never more transparent than 25%, even if the wave transparency is set higher; With the “Colorblind-friendly colors” setting, the scale goes from sky blue to yellow, orange, crimson and dark purple.
  • in “Value at cursor”, on a computer, when “Steepness” is the displayed parameter;
  • along a routing, in the “Max Steepness” column of the passage table and in the “Steepness” badge of the routing bar;
  • in the meteogram, “Wave Steepness” column, when the file only gives the total sea.

“Steepness” color map over the North Atlantic with the wind sea and swell arrows, and the “Steepness” badge“Steepness” color map over the North Atlantic with the wind sea and swell arrows, and the “Steepness” badge

Steepness curve at the target point, graduated in %Steepness curve at the target point, graduated in %

In the October 2026 catalog, GFS Wave, MFWAM (global and France), Copernicus (global and Mediterranean) and DMI WAM give the wind sea and the swell. ECMWF Wave and the IFREMER WW3 models only give the total sea.

IFREMER WW3 files: waves and currents

Most IFREMER WW3 models also contain the current (all except Guadeloupe-Martinique 1 km, Martinique and Réunion). When one of these files is displayed, the layers menu list offers “Currents” before “Waves”: choose “Waves” to see the sea state.

Other ways to read the waves

  • The meteogram gives, forecast time by forecast time, the height, direction and period of the total sea, and its steepness when the file has no wind sea.
  • On a computer, “Value at cursor” displays the height, the direction the waves come from and their period under the mouse pointer.
  • On export, a wave file is rewritten so that other navigation software can read it (see Manage the GRIB list).
  • Routing can take waves into account: the wave GRIB is chosen in the routing window, or by default with the “Suggested models”. See Weather routing.

See also

↑ Contents

4.7 Currents

Expert

The essentials

NavimetriX knows two sources of current:

  • current GRIBs (the “Currents” type in the download window): ocean currents and tidal currents computed by models (Copernicus, SHOM, IFREMER, BSH, NCOM…). They require the Premium subscription and are downloaded like any other GRIB;
  • the SHOM tidal current atlas (Service hydrographique et océanographique de la Marine, the French navy’s hydrographic and oceanographic service), for the French coasts of the English Channel and the Atlantic. It is downloaded once and for all at installation and then works without a connection.

Both are displayed as arrows or particles and are used in routing.

  1. SHOM atlas: open the layers menu (round orange button at the bottom right) and tick “Current atlases”. Zoom in on the coast: the atlas only appears from a coastal scale.
  2. Current GRIBs: display the file from the “GRIBs” tab of the left drawer; the “Currents” parameter is displayed.
  3. Drag the timeline to follow the turn of the tide and the hours of strong current.
  4. To choose between arrows and particles, open the right drawer, “Forecast display”, “Currents” section.

Tidal current atlas as arrows colored according to the strength of the currentTidal current atlas as arrows colored according to the strength of the current

Going further

The SHOM tidal current atlas

The atlas gives the tidal current at any point of its zones, at any time. NavimetriX computes it from two reference states, neap tides and spring tides, which it interpolates according to the tidal coefficient (from 45 to 95), as a function of the time of high or low water at the reference port of each zone. Tides are computed within the application: the atlas works offline, and for any date.

  • Zones: the SHOM atlases cover the French coasts of the English Channel and the Atlantic, from the Strait of Dover to the Bay of Biscay, with detailed atlases (Bay of the Seine, Normand-Breton gulf, northern Brittany, Iroise, southern Brittany, Vendée-Gironde…). Where several atlases overlap, the finest one prevails.
  • Download: about 20 MB, when the application is installed, then with each new version of the data. In the browser version, it is done in the background after startup.
  • Zoom: nothing is displayed when you zoom out too far (small scales): zoom in to a coastal view.
  • Timeline: with the atlas displayed, the timeline covers seven days before and seven days after today, even without a GRIB.

Arrows: they are colored according to the strength of the current.

CurrentColor
less than 1 knotyellow
1 to 3 knotsorange
3 to 5 knotsred
more than 5 knotsdark red

The colorblind mode uses a variant of these colors. The length of the arrows grows up to 3 knots. No arrow is drawn on land, nor below 0.1 knot. Below 1 knot, the arrows shrink with the speed.

Particles: they are cyan, which distinguishes them from the black particles of a GRIB displayed at the same time, and they are never drawn on land.

Value under the center: the “Current Atlas” badge at the top of the chart gives the speed and direction of the current at the center of the screen (not at the target). It disappears over land.

You can overlay the atlas and a high-resolution current GRIB (IFREMER for example) to compare them by dragging the timeline.

Current GRIBs

With a current GRIB displayed, the color map gives the strength of the current, from blue to magenta, over 0 to 5 knots. The arrows are black (white on the BING background), and their size follows the speed. The color map of currents is not masked over land.

The catalog offers global ocean current models (Copernicus, RTOFS, SMOC which adds the tide) and finer regional tidal current models (SHOM, IFREMER, Copernicus IBI and Mediterranean, BSH in the North Sea and the Baltic, NCOM and MSC in North America…). See the list in the FAQ.

The “Currents” settings

Right drawer, “Forecast display”, “Currents” section. These settings apply to current GRIBs and to the SHOM atlas.

SettingValuesDefault
“Currents display”“Particles” or “Arrows”Particles
“Particle density”25 to 300%, in steps of 25 (also sets the density of the atlas arrows)100%
“Particle length”25 to 150%, in steps of 25100%
“Color map style”“Gradient” or “Iso areas”Gradient
“Transparency”0 to 100%, in steps of 550%
“Iso areas step”0.1 to 5.0 knots0.2 knot
“Speed values”on or offoff

“Speed values” writes the current speed next to the arrows, at large scales. In “Energy saving” mode (Settings, “General”), currents are always drawn as arrows.

Forecast display drawer, Currents sectionForecast display drawer, Currents section

Currents in routing

In the routing window, the “Current” row offers “None”, “SHOM atlases”, then your current GRIBs. A coefficient, from 80 to 150% (100% by default), on the same row, increases or decreases the current taken into account. The magic wand of the “Suggested models” automatically chooses the SHOM atlas for coastal navigation when it covers the area. Outside the atlas zones, it provides no current. See Weather routing.

See also

↑ Contents

4.8 Historical weather

Expert

The essentials

Historical weather loads a GRIB from the past: the wind, pressure, gusts, clouds, rain and waves of the ECMWF IFS model at 0.25°, over the area and period of your choice, up to the current day. Back in port, you replay the day you have just sailed with the weather it actually had; you can also study a past situation or prepare a race on a known course. The feature requires the Premium subscription and an Internet connection.

  1. Tap the round orange + button at the bottom right, then “Load historical GRIB”.
  2. Adjust the area with the handles of the rectangle, then tap “OK” in the “Area selection” banner.
  3. In the “Historical weather” window, choose the “Start” and the “End” of the period.
  4. Read what the window announces: days available right away, preparation time, grid spacing used. Then tap “Download…”.
  5. The archive is displayed on the chart and joins the “GRIBs” tab of the left drawer.

“Historical weather” window on an area of southern Brittany: three-day period, periods ready at once, days to prepare with the estimated time, “Cancel” and “Download…” buttons“Historical weather” window on an area of southern Brittany: three-day period, periods ready at once, days to prepare with the estimated time, “Cancel” and “Download…” buttons

Going further

The content of the archive

  • Model: ECMWF IFS, 0.25° grid (about 28 km), with no other choice.
  • Parameters: wind, pressure, gusts, cloud cover, rain, and for waves height, direction and period. They are all included.
  • Step: 3 hours, that is eight forecast times per day, from 00:00 to 21:00 UTC.
  • Period: from 1 to 365 days, from February 29, 2024 (start of the archive) up to today. The current day is reconstructed from the runs already published, which lets you replay the day’s passage as soon as you are back in port.

When the window opens, the period runs from yesterday to today. When you choose a start, the end is set ten days later (without going beyond today) as long as you have not chosen the end yourself. An invalid period is flagged under the dates.

The area is that of the rectangle you drew. A very small area is automatically widened to at least one degree.

Days ready and preparation time

Our servers build the archive day by day and keep those that have already been requested. When the window opens, it asks them which ones are ready:

  • “Ready at once:” lists the periods that are already ready;
  • if your whole period is, “This period is ready: immediate download.”;
  • otherwise, the window announces how many days remain to be prepared and the time to allow: “… days of this period still have to be prepared: allow around … min.”

During preparation, a progress bar shows the “Estimated time remaining”, then “A little more patience…” if the estimate is exceeded. The window polls the server every 20 seconds. If it is still not finished, it invites you to try again in a few minutes: the days already built are kept.

Reduced grid for large areas

The larger the area and the period, the heavier the file. The window estimates its size before the download:

  • beyond 40 MB, a checkbox offers a coarser grid, in the form “Reduce to 0.5°: … MB instead of … MB”. It is ticked by default; untick it to keep the fine grid;
  • beyond 100 MB, the grid is widened automatically (0.5°, then 1°): “Wide area: the grid is reduced to…”;
  • if the file still exceeds 100 MB at 1°, the request is refused: shorten the period or reduce the area.

Where to find the archive

The archive is displayed on the chart as soon as it arrives (“Historical weather loaded”). In the “GRIBs” tab, it is called “ECMWF IFS 0.25° archive · start → end” (0.5° or 1° if the grid was reduced), with the label “Historical”. It can be renamed, exported and deleted like other GRIBs, and is read with the meteogram. There is no new run to wait for.

With an archive displayed, the timeline covers its period. The rain radar and the current atlas, which only deal with today, no longer stretch it to today’s date once the archive ended more than two days ago.

Synchronization and reuse

An archive requested by hand enters the GRIB list of your account: your other devices see it, marked “Missing”, and fetch it with the download button on its row or with “Refresh”. This second download does not require a Premium subscription.

A request identical to an archive already on the device is served without a connection. On the device, an archive file is deleted after seven days without use.

The archives that NavimetriX loads by itself to replay a track do not appear in the list and disappear with the track. See Tracks, replay and logbook.

Without a Premium subscription

The “Load historical GRIB” menu remains visible, but the request is refused at download time: “Historical weather requires a premium subscription.”

See also

↑ Contents

↑ Contents

5 Weather: observations, charts and tides

This chapter brings together what shows the weather as it actually is, to complement forecasts: rain radar, satellite images, lightning, measurement stations and weather ships, and wind measured by satellite (ASCAT). It also presents the weather charts of the official services, to be read alongside GRIB files, and tides.

5.1 Rain radar

Beginner

The essentials

The rain radar shows where it is raining right now, and where it will rain in the next few hours. The images come from national and European weather radar networks, and from a nowcast computed by artificial intelligence. They refresh every five minutes. An Internet connection is required.

  1. Open the layers menu (round orange button at the bottom right) and tick “Rain radar”, in the “Display” section.
  2. To choose the sources, open the left drawer (chevron handle at the left edge of the screen), “Radar” tab, and tap the eye of each source to show or hide it.
  3. Drag the timeline at the bottom of the screen: to the left to review the last few hours, to the right for the forecast.

The rain radar over the English Channel, England, Belgium and Germany: showers are colored from light blue to green, then yellow for the strongestThe rain radar over the English Channel, England, Belgium and Germany: showers are colored from light blue to green, then yellow for the strongest

Going further

The sources

The list in the “Radar” tab is served by our servers; it can therefore grow without an application update. In October 2026, it offers:

  • “Europe (AI powered by WeatherNCo)”: rain over Europe, with an artificial-intelligence nowcast over three hours. It is the only source displayed by default;
  • “Europe - Lightning (AI powered by WeatherNCo)”: forecast lightning from the same artificial intelligence, hidden by default (see Lightning and thunderstorms);
  • “Europe (EUMETNET OPERA)”: the composite of European radars, which also covers Spain, Portugal, the United Kingdom, Ireland, the Benelux, Poland, the Baltic and Greece;
  • “France (Météo-France)”, “Germany (DWD)”, “Italy (Protezione Civile)”, “Scandinavia (MET Norway)” and “United States (NOAA)”: the national networks.

Source names stay in English. Under the WeatherNCo sources, a link leads to this partner’s website (ai4vigil.com). Your choice of sources is remembered on the device.

A source is only drawn if the map view touches its area. If you tick several sources that overlap, their images are superimposed.

The timeline

Radar images follow the timeline: for each source, NavimetriX displays the image closest to the timeline time. With the radar displayed, the timeline extends from the oldest available image (about two hours back for most sources) to the last forecast time. Its markers distinguish:

  • in cyan, observed images;
  • in orange, forecast images;
  • in the text color, moments observed by one source and forecast by another.

To follow the passage of a shower, drag the timeline. A source is only drawn within the time range covered by its images.

With a historical GRIB that ended more than two days ago, the radar no longer stretches the timeline to today.

The AI nowcast

The “Europe (AI powered by WeatherNCo)” source extends the observation with a forecast in 10-minute steps up to three hours, computed by an artificial intelligence model. Forecast images are read like observed images: only the color of their marker on the timeline distinguishes them.

The colors

The colors go from cyan (drizzle) to blue, green, yellow, orange and red (heavy to extreme rain), then magenta (hail risk) and purple. A light grey covers the areas seen by a radar where it is not raining: you can thus tell “no rain” from “no radar”. The image is displayed at 70% opacity, with no setting, and no legend on the chart. At very large scales, when the chart shows a harbor, the radar fades out.

Data and battery

Images are kept on the device (50 at most) and refreshed every five minutes. On phones and tablets, the radar downloads nothing when the application goes to the background, and updates again as soon as it returns to the foreground.

The rain radar does not require a Premium subscription.

See also

↑ Contents

5.2 Weather charts (Charts tab)

Expert

The essentials

The Charts tab of the left drawerThe Charts tab of the left drawer

Surface weather charts (also called isobaric charts or front charts) are drawn by forecasters at the major weather services: pressure centers, isobars, fronts, gale warnings. They complement GRIB files, which are computed without human intervention, and help you understand the situation. NavimetriX gathers them in the “Charts” tab of the left drawer.

  1. Open the left drawer with the chevron handle (›) at the left edge of the screen, then the “Charts” tab.
  2. The list only shows the charts that cover the center of the map: move the map to see those of another region.
  3. Tap a chart: it is laid over the nautical chart, in its place, or opens as an image depending on its format.
  4. Tap it again to remove it.

Do not confuse the “Charts” tab of the left drawer (weather charts) with the “Maps” section of the layers menu, which chooses the base map.

Going further

The charts offered

The list is served by our servers and updated every hour. In October 2026, it includes charts from NOAA (Atlantic, Pacific, Panama), the Met Office (Europe and North-East Atlantic), the BOM (Australia, Indian Ocean, South Pacific), the Marinha do Brasil (South Atlantic), and a sargassum density chart from USF (tropical Atlantic). The forecast ranges of each series are detailed in the FAQ.

The “All weather charts” link at the top of the tab opens the complete list on our website, and the “?” button the corresponding FAQ page.

The list follows the map

A chart only appears in the list if the center of the view is within its area. The list updates when you move the map, and sorts the charts by area, with their number. If none covers the center of the view, the tab shows “No charts available for current view”.

Each row shows:

  • the source, abbreviated, on a colored badge;
  • the area, in English;
  • “Current analysis” or “24h forecast” (for example), with the mention “(Color)” for color charts;
  • “Valid:” followed by the date and time of validity, in UTC. The ⚠ symbol and an alert color flag an outdated chart: an analysis more than 24 hours old, or a forecast whose validity time has been exceeded by more than its lead time (by more than 24 hours for a “24h forecast”).

On the map or as an image

  • Charts in Mercator projection (NOAA, Marinha do Brasil, USF sargassum) are laid over the nautical chart, in their place, with the white background made transparent. If the center of the screen is outside their area, the map reframes to show them in full. A colored bar at the edge of the row marks the displayed chart. Only one chart is laid at a time, and the “Weather charts” checkbox in the layers menu (ticked by default) hides or restores them. The laid chart is only drawn at small scales, down to the view of a stretch of coast such as southern Brittany: when you zoom in closer, it fades out, and if you are too close when you choose it, the map zooms out to show it.
  • The others (Met Office, BOM) are not overlaid on the nautical chart: they open in the image viewer, in a separate window on a computer, over the map on mobile and in the browser. A chart not yet downloaded opens in your browser.

NOAA situation chart (North Atlantic, color analysis) laid over the map: isobars, anticyclones, depressions and frontsNOAA situation chart (North Atlantic, color analysis) laid over the map: isobars, anticyclones, depressions and fronts

Met Office color surface analysis opened in the image viewerMet Office color surface analysis opened in the image viewer

With a GRIB

If a GRIB is displayed, choosing a chart laid over the nautical chart (NOAA, Marinha do Brasil, USF) sets the timeline to its validity time: you compare at a glance the forecaster’s drawing and the model’s wind at the same time. Charts that open as an image (Met Office, BOM) do not move the timeline. The laid chart, for its part, does not move with the timeline.

Offline

Charts are downloaded in the background shortly after startup, or when the tab is opened, then renewed when their validity time changes. Those already downloaded remain available without a connection. Weather charts do not require a Premium subscription.

Reading a front chart

A few guidelines, detailed in the FAQ How do I read marine weather charts?:

  • H (High) marks an anticyclone, L (Low) a depression, with their central pressure.
  • Isobars join points of equal pressure. Close together, they announce strong wind; widely spaced, light wind. In the Northern Hemisphere, the wind turns clockwise around an anticyclone and counterclockwise around a depression.
  • A cold front is a blue line with triangles, a warm front a red line with semicircles, an occluded front a purple line carrying both, and a stationary front alternates blue triangles and red semicircles on either side.
  • A trough (often marked TROF) is a dashed line: a zone of relatively low pressure, often unstable.
  • The mentions GALE, STORM and HURRICANE FORCE near a depression announce gale, storm and hurricane-force winds.

See also

↑ Contents

5.3 Satellite images

Beginner

The essentials

Weather satellites constantly photograph the Earth in infrared, day and night. Their image shows the actual cloud cover, to within a few tens of minutes: the cloud bands of fronts, thunderstorm clusters, clear spells. NavimetriX displays it as the base map, in place of the usual map. An Internet connection is required.

  1. Open the layers menu (round orange button at the bottom right).
  2. In the “Maps” section, choose “Realtime Satellite”.
  3. In the neighboring list, choose the source: “Global IR”, “High Res IR” (default) or “NOAA IR”.
  4. The time of the image is shown at the bottom left of the chart, above the scale.

To return to the usual map, choose another base map in the same section.

Layers menu, Maps section: Realtime Satellite and the list Global IR, High Res IR, NOAA IRLayers menu, Maps section: Realtime Satellite and the list Global IR, High Res IR, NOAA IR

Infrared satellite image (Global IR) over the North Atlantic: a long cloud band of a frontInfrared satellite image (Global IR) over the North Atlantic: a long cloud band of a front

Going further

The three sources

  • High Res IR: the best image available depending on longitude. NavimetriX chooses the satellite by itself, for each part of the image: GOES-East between 100° W and 15° W, Meteosat between 15° W and 70° E, Himawari between 70° E and 170° E, GOES-West elsewhere. The label names the one at the center of the screen. The Meteosat image is colorized and is about half an hour old. Beyond 70° of latitude, none of these satellites covers the area, and the label says “not covered”.
  • Global IR: a global infrared mosaic from NOAA, prepared on our servers and renewed every hour. It is less detailed: when zooming in closer than a stretch of coast such as southern Brittany, the image is simply enlarged.
  • NOAA IR: NOAA’s global infrared mosaic, in grey levels, with a resolution of about 3 km, updated every hour.

NavimetriX remembers the chosen source.

The label and the update

At the bottom left of the chart, the label gives the name of the satellite (for “High Res IR”) or of the source, followed by the time of the image, in UTC or local time according to your time zone setting. NavimetriX checks every ten minutes whether a more recent image is available, and then reloads the map.

Combining layers

The satellite image remains a base map: on top of it, you can display a GRIB, a NOAA weather chart laid over the map, lightning, rain radar or weather stations. Combining a satellite image with a front chart gives an instant view of the situation. See Weather charts and Lightning and thunderstorms.

Satellite images do not require a Premium subscription.

See also

↑ Contents

5.4 Lightning and thunderstorms

Beginner

The essentials

NavimetriX displays lightning strikes as they happen, detected by the worldwide Blitzortung network, and can play a clap of thunder when a flash strikes in the area you are looking at. An approaching storm can thus be seen, and heard, before it reaches the boat. An Internet connection is required.

Layers menu, “Display” section: “Lightning” and “Thunder” tickedLayers menu, “Display” section: “Lightning” and “Thunder” ticked

  1. Open the layers menu (round orange button at the bottom right).
  2. In the “Display” section, tick “Lightning”.
  3. Leave “Thunder” ticked to hear the strikes that fall in the visible part of the chart, or untick it for silence.
  4. To set the number of strikes and how long they are displayed, open the right drawer, “Forecast display”, “Lightning” section.

Chart with the lightning strikes of the last hour around Sardinia and the Balearic IslandsChart with the lightning strikes of the last hour around Sardinia and the Balearic Islands

Going further

Reading the symbols

Each strike ages before your eyes:

  • during the first ten seconds, an orange ring expands around it;
  • during the first minute, it is marked by a white disc ringed in orange;
  • after that, it becomes a cross that goes from yellow to dark red as it ages, and gradually fades until the maximum age you set.

A cluster of dark red crosses shows where the storm has passed, the white discs where it is striking now: their succession gives its direction.

Lightning is not displayed in a very distant view, wider than an ocean or a continent: zoom in a little to see it.

The “Lightning” settings

Right drawer, “Forecast display”, “Lightning” section:

SettingValuesDefault
“Max strikes”100 to 1,000, in steps of 100500
“Max age”10 to 120 minutes, in steps of 1060 minutes

When the view contains more strikes than the maximum, the most recent are kept. The application only keeps strikes for one hour: a maximum age above 60 minutes therefore does not show any more of them.

Thunder

The “Thunder” checkbox, ticked by default, is only active if “Lightning” is. A clap of thunder sounds for each strike received in real time that falls in the visible part of the chart: zoom in on your sailing area to hear only the storms that concern you. Thunder does not exist in the browser version.

Offline and on restart

Strikes arrive continuously over the Internet. NavimetriX keeps those of the last hour, up to 5,000, saves them every five minutes and restores them on restart. Unticking “Lightning” hides the strikes without erasing them.

Forecast lightning

Blitzortung flashes are strikes that have already fallen. For upcoming lightning, the “Radar” tab of the left drawer offers the source “Europe - Lightning (AI powered by WeatherNCo)”, an artificial intelligence forecast, hidden by default. See Rain radar.

The CAPE of an atmospheric GRIB (energy available for thunderstorms) shows where the air is unstable enough for storms to form. See Displaying forecasts on the chart.

Lightning does not require a Premium subscription.

See also

↑ Contents

5.5 In-situ stations and weather ships

Beginner

The essentials

“In-situ” stations give the weather measured on the spot: buoys at sea, lighthouses and semaphores on the coast, airport stations (METAR), observation ships, and wind measured by satellite. Compared with the GRIB forecast, they tell you whether the model matches the reality of the day. An Internet connection is required.

  1. Open the layers menu (round orange button at the bottom right) and check that “Weather stations” is ticked, in the “Display” section. This is the default setting.
  2. Zoom in on your area: each station is an arrowhead oriented according to the wind direction and colored according to its strength.
  3. Tap a station: the “In Situ Info” window gives its latest readings.
  4. Tap the middle of this window to set the chart and the timeline to the station and the time of the reading, and compare with the GRIB.

Six In Situ Info windows: semaphore, ships, METAR, buoy and satelliteSix In Situ Info windows: semaphore, ships, METAR, buoy and satellite

Going further

The types of stations

The “Type:” line of the window shows: “Buoy”, “Coastal”, “Lighthouse”, “METAR” (airport station), “Satellite” (wind measured by the ASCAT scatterometers), “Semaphore” or “Ship”. The data is gathered on our servers from buoy networks, synoptic and METAR observations, semaphores, observation ships and satellite measurements, then refreshed every five minutes as long as the layer is displayed.

Readings more than three hours old are discarded (five hours for satellite measurements). Stations are displayed from the view of a region such as the Bay of Biscay, and are hidden while a routing is being computed and while an area is being selected.

When the view contains too many, NavimetriX draws 200 at most, keeping one station per sector of the map, in order of priority: semaphores and lighthouses, then buoys, ships and NOAA stations, satellite measurements, and finally airport stations.

The “In Situ Info” window

Depending on what the station measures, it gives: “Station:”, “Type:”, “Age:” (“just now”, in minutes or hours), “Wind:” (strength and direction), “Gust:”, “Pressure:”, “Water:” and “Air:” (temperatures), “Visibility:” and “Source:”. The units are fixed: knots, hectopascals, degrees Celsius and miles, whatever your unit settings. The window can be moved by dragging it.

Comparing with the GRIB

Tap the middle of the window, without dragging it. If the time of the reading is within the period of the displayed GRIB and the station is within its area, NavimetriX:

  • centers the chart on the station;
  • sets the timeline to the time of the reading;
  • adds a “GRIB:” line with the forecast wind strength and direction at that place and time.

The “In Situ Info” window of a semaphore after a tap in the middle: the “GRIB:” line gives the forecast wind, next to the measured windThe “In Situ Info” window of a semaphore after a tap in the middle: the “GRIB:” line gives the forecast wind, next to the measured wind

You thus compare the measurement and the forecast directly. A consistent discrepancy from one station to the next is a good clue for choosing between two models.

AIS weather ships and stations (in cyan)

Some ships, buoys and coastal stations broadcast their weather measurements over AIS (message 8, meteorological and hydrological data). NavimetriX draws them in cyan: a class A or B vessel, or a square for a base station or an aid to navigation. At small scales, where ordinary AIS targets are hidden, these weather targets remain visible.

Tap one of these targets: its AIS card has a “Weather” block with, depending on what it broadcasts, “Wind:”, “Wind direction:”, “Gust:”, “Pressure:”, “Water temp:”, “Air temp:”, “Current:” and “Current direction:”.

Displaying AIS targets, whether received by your receiver or over the Internet, requires the Premium subscription. See Navigation: GPS, NMEA and AIS.

Sharing the weather aboard

The “Share weather data” setting (right drawer, “AIS”) sends every ten seconds the weather measured by your instruments: mean true wind and its direction, gust and its direction, pressure, air and water temperatures. It goes over the Internet to our servers, as an AIS 8 message: no AIS transponder is needed. On by default, sending requires:

  • the Premium subscription;
  • a true wind computed by NavimetriX from your instruments (NMEA link, the onboard instrument protocol) and a valid position;
  • not being in demo mode, following another boat or in replay.

The message carries your boat’s MMSI if it is filled in under “My Boat”, otherwise a random identifier specific to the device. This setting does not exist in the browser version.

See also

↑ Contents

5.6 Satellite wind observations (ASCAT)

Expert

The essentials

ASCAT is a scatterometer aboard the European MetOp-B and MetOp-C satellites: a radar that measures the roughness of the sea surface, and from it deduces the strength and direction of the wind at 10 m. NavimetriX offers these measurements as a GRIB, a map of the observed wind over the last 15 hours. It is not a forecast: it is the ideal tool to check that a model matches reality before trusting it. ASCAT requires the Premium subscription and an Internet connection.

  1. Draw an area and open the download window as for any GRIB (+ button, “Download GRIB”).
  2. Choose the type “Observations (ASCAT)” and the model “ASCAT 0.125° (MetOp-B/C, 15 h)”, then “Download GRIB”.
  3. The measured wind is displayed on the chart, in bands: the swaths, that is, the strips of sea seen by the satellite on each pass.
  4. Place the target on a point: the “Measured at” badge gives the day and time of the measurement.

ASCAT GRIB over the Bay of Biscay: two colored swaths and the empty strip between them, “Wind” and “Measured at” badges at the top of the chart, target in a swathASCAT GRIB over the Bay of Biscay: two colored swaths and the empty strip between them, “Wind” and “Measured at” badges at the top of the chart, target in a swath

Going further

What the file contains

According to the catalog description (the “Model description and map coverage” button of the download window):

  • the surface wind measured by the ASCAT scatterometers of MetOp-B and MetOp-C, coastal product from KNMI and EUMETSAT OSI SAF (12.5 km cells), on a 0.125° grid;
  • a single map of the last 15 hours, redone every hour: each point shows the most recent satellite pass, about 2 to 15 hours old;
  • the areas between swaths are empty.

The file only contains the wind: no pressure, no gusts. Since it is redone every hour, the update button on its row, in the “GRIBs” tab, lights up with each new map (see Manage the GRIB list).

The display

The measured wind is displayed like the wind of a GRIB: color map, particles or barbs, with the same settings. Between swaths, the chart stays transparent: no value is invented there. The edges of the swaths are not outlined.

The measurement time

Each point was not measured at the same time: depending on the passes, the measurement can date from two hours ago or from the previous evening. The “Measured at” badge, placed right after the “Wind” badge at the top of the chart, gives the day and time of the measurement under the target, for example “Mon 22:26” in local time, or followed by “UTC” if your time zone is set to UTC. The value is that of the nearest grid point, never interpolated. “—” means a point without measurement, between two swaths.

This badge does not open as a curve, and the measurement time does not appear in the “Value at cursor” on computers.

How to use it

  • Judge a model: display ASCAT, note the measured wind and its time, then display the model’s GRIB at the same time on the timeline. A model that clearly underestimates the measured wind calls for caution for the coming hours; if several models are available, prefer the one that best matches the measurements.
  • Spot a phenomenon: a depression, a front, an area of strong wind are visible in the swaths, with their actual position.
  • Not for routing: these are past measurements, not a forecast. The ASCAT file has a single moment, already past: it allows no useful routing. It is used to compare models with reality; to route, use a forecast model.

ASCAT measurements also appear, point by point, among the in-situ stations, with the type “Satellite”. See In-situ stations and weather ships.

See also

↑ Contents

5.7 Tides

Beginner

The essentials

NavimetriX computes the tide of nearly 1,200 ports around the world, without a connection. On the chart, one gauge per port shows whether the sea is rising or falling; tapping the gauge opens the port’s tide table: times and heights of high and low waters, coefficient, curve for the day.

  1. Tide gauges are displayed by default. To hide or restore them, open the layers menu (round orange button at the bottom right) and tick or untick “Tides”, in the “Display” section.
  2. Zoom in on the coast: a green gauge signals a rising tide, a red gauge a falling tide. Its fill gives the water level between low and high water.
  3. Tap a gauge to open the port’s tide table. You can also right-click (long press on mobile) near a port and choose “Tide in” followed by the port name.
  4. Tap the date to choose another day, or drag the tide table left or right to move to the next or previous day.

Display section of the layers menu, Tides checkbox tickedDisplay section of the layers menu, Tides checkbox ticked

Going further

The gauges on the chart

  • Green: rising tide; red: falling tide. In colorblind mode, the rising gauge turns blue. A small arrow pointing up or down confirms the direction.
  • The fill of the gauge, in tenths, places the water level between low water and high water. Special icons mark high water and low water.
  • Main ports appear from the view of a stretch of coast such as southern Brittany. Secondary ports (computed from a neighboring main port) appear from the view of a bay such as Quiberon Bay.
  • The gauges follow the time of the timeline when it is displayed, otherwise the current time: drag the timeline to see the tide at your arrival time.
  • The Tide pill sits next to the labels at the top of the map as soon as a tidal port is close to the screen center. It gives the port name, then the water height, the level as a percentage (0 % at low water, 100 % at high water), the direction (↑ rising, ↓ falling) and, the coefficient (in the area where it is given, see below). Tapping it opens the tide window. The “Tide info” box of the layers menu shows or hides it.

The Tide pill next to the labels: port name, water height, level, direction and coefficientThe Tide pill next to the labels: port name, water height, level, direction and coefficient

Two tide gauges: red falling and green risingTwo tide gauges: red falling and green rising

A port’s tide table

On a computer, it opens in a separate window; on phones, tablets and in the browser, over the chart. It contains, from top to bottom:

  • the port name and the date, which opens a calendar;
  • the table for the day: “Tide” (“High” or “Low”), “Time”, “Height” (in meters, to the centimeter) and “Coeff” (the coefficient, given at high waters);
  • for the current day, the line “Now: … | Height: … m | …”, with the trend: “Ascending”, “Descending”, “High” or “Low”;
  • the 24-hour tide curve, with a vertical red line at the current time for the current day;
  • the “Height threshold” row;
  • the “Dismiss” button.

The times follow your time zone setting (UTC or local time); in UTC, they carry the mention “UTC”. The coefficient is the French tidal coefficient, computed for Brest as in the almanacs: the higher it is, the greater the tidal range and the currents. The coefficient is only given between 42.5° and 52° N and between 10° W and 3° E (French Atlantic and Channel and their neighbours); elsewhere neither the pill nor the tide window shows one.

Cowes tide table: table of high and low waters, Now line, curve and height thresholdCowes tide table: table of high and low waters, Now line, curve and height threshold

The height threshold

The height threshold answers two questions: what depth of water at a given time, and at what time the water reaches a given height. Set it with the − and + buttons on the “Height threshold” row, from 0 to 20 m in steps of 10 cm. A horizontal red line is drawn on the curve, and each crossing with the curve is marked with a dot and its time. Handy for knowing when to cross the sill of a tidal harbor or a lock, or when the channel has enough water for your draft. The chosen value is kept and follows your other devices.

Where the tides come from

The port data (889 main ports and 294 secondary ports in the October 2026 version) is downloaded when the application is installed and then updated when a new version is released; in the browser version, it is built into the application. All the computation is then done on the device, without a connection, for any date.

The harmonic constants come from SHOM, adjusted in August 2026 to the measurements of its tide gauges (REFMAR), and the corrections for secondary ports come from its tables. The control source is the book Table des marées des grands ports du monde (SHOM, 1982).

Warning: this is not SHOM’s official calculation. In general, the times of high and low water differ by about 15 minutes, and the heights by about 20 cm. For your safety, always consult the official SHOM tide tables for the place where you are.

The computation was enriched in August and October 2026.

Tides do not require a Premium subscription. They are also used for coastal routing and for the SHOM current atlas. See Currents and Weather routing.

See also

↑ Contents

↑ Contents

6 Charts and maps

This chapter presents the NavimetriX base maps and how to orient the map, then the two sources of nautical charts: the hydrographic service charts distributed by Geogarage, and the C-MAP DISCOVER X and REVEAL X vector charts. You will find how to connect your accounts, download zones to navigate without Internet, adjust the display of C-MAP charts and read the object information sheet, and whether or not to enable C-MAP on iPhone and iPad.

6.1 Base maps and orientation

Beginner

The essentials

The base map is the image on which NavimetriX draws the weather, routes, POIs and AIS targets. You choose it in the layers menu, which also lets you orient the map. These two choices are specific to each device: changing the base map on the tablet changes nothing on the computer.

  1. Tap the round orange layers button at the bottom right of the chart (on a phone in landscape, it moves to a top corner of the screen).
  2. In the “Maps” section, choose the base map: “OSM”, “BING”, “Realtime Satellite”, “Geogarage” or “C-MAP”.
  3. Still in “Maps”, the “Orientation” list chooses what is at the top of the screen: “North up”, “Course up (COG)”, “Heading up (HDG)” or “Waypoint up (BTW)”.
  4. In the “Display” section of the same menu, the “Lat/lon grid” checkbox overlays a graduated grid of latitudes and longitudes.

Maps section of the layers menu: OSM, BING, Realtime Satellite, C-MAPMaps section of the layers menu: OSM, BING, Realtime Satellite, C-MAP

Maps section of the layers menu: base maps and the Orientation list unfolded (North up, Course up, Heading up, Waypoint up)Maps section of the layers menu: base maps and the Orientation list unfolded (North up, Course up, Heading up, Waypoint up)

Layers menu on a phone, with the Geogarage (SHOM) base map selected: the map list includes OSM, Bing, Realtime Satellite, Geogarage and C-MAPLayers menu on a phone, with the Geogarage (SHOM) base map selected: the map list includes OSM, Bing, Realtime Satellite, Geogarage and C-MAP

Going further

The available base maps

  • “OSM”: the default base map, a map of land and coastline with shaded relief. It is a general base map, not a nautical chart: no soundings or buoyage.
  • “BING”: satellite images (aerial photographs) of land and coasts.
  • “Realtime Satellite”: recent infrared images of the clouds. The list on the right chooses the source: “Global IR”, “High Res IR” or “NOAA IR”. NavimetriX remembers the last source chosen. These images belong to weather: see Satellite images.
  • “Geogarage”: the nautical charts of hydrographic services (SHOM, NOAA, BSH and the British service…) you subscribe to with Geogarage. The row only appears once you are connected to your Geogarage account, with at least one subscribed layer; the list on the right chooses the layer. See Geogarage charts.
  • “C-MAP”: the C-MAP DISCOVER X or REVEAL X vector charts. When this base map is active, three buttons appear to its right: satellite, relief and high-resolution bathymetry. Satellite and relief are reserved for REVEAL X charts. See C-MAP charts: purchase, account and zones and C-MAP chart settings.

Shaded relief of the land and the seabed only exists in C-MAP REVEAL X charts; on the other base maps, only “OSM” shades the land relief.

On “OSM”, “BING” and the Geogarage base maps, NavimetriX also draws a coastline when you zoom out strongly, to keep the outline of the land readable. It always draws it on infrared images, never on C-MAP, which draws its own coast.

Map orientation

ChoiceWhat is at the top of the screenData used
“North up”north (default value)none
“Course up (COG)”the boat’s course over groundCOG (Course Over Ground, the course followed relative to the ground, given by the GPS)
“Heading up (HDG)”the boat’s headingHDG (Heading, the compass heading, received over NMEA)
“Waypoint up (BTW)”the direction of the active waypointBTW (Bearing To Waypoint, the bearing of the next waypoint)

The map turns smoothly and only follows changes of at least 1°, so it does not jitter. As long as the chosen data is missing (no GPS, no NMEA heading, no active waypoint), the map stays north up. The HDG heading requires a compass connected over NMEA (see NMEA 0183 connection); the BTW bearing requires navigating to a POI or following a route (see Navigating to a POI and following a route).

The orientation is saved on the device and restored at the next launch.

Latitude and longitude grid

The “Lat/lon grid” checkbox in the “Display” section draws the parallels and meridians with their values. The grid spacing follows the zoom: 10° in a wide view, then 5°, then 1° up close. It does not go below one degree.

Charts in night mode

The “Night” theme is chosen in Settings, on the “Theme” row (“Light”, “Dark” or “Night”). It is a setting specific to each device. With the “Night” theme, charts darken to preserve night vision:

  • C-MAP switches to the night variant of the chosen style: “Default” becomes “Night”, “NOAA” becomes “NOAA Night”. The original style returns when you leave the “Night” theme.
  • Geogarage: the colors of the charts are inverted (white becomes black), then slightly darkened.
  • “OSM”, “BING” and infrared images keep their colors, under a more pronounced dark veil.

The same harbor, La Rochelle, with the Light theme on the left and the Night theme on the right, on the OSM base map: under the Night theme, the map remains readable under a dark veilThe same harbor, La Rochelle, with the Light theme on the left and the Night theme on the right, on the OSM base map: under the Night theme, the map remains readable under a dark veil

See also

↑ Contents

6.2 Geogarage charts

Beginner

The essentials

Geogarage charts settings: Logout button, SHOM layer, downloaded zonesGeogarage charts settings: Logout button, SHOM layer, downloaded zones

Geogarage distributes the nautical charts of many hydrographic services (SHOM, NOAA, BSH and the British service…). A Geogarage subscription gives access to all the charts of a service. You subscribe with Geogarage, then enter your Geogarage credentials in NavimetriX: the charts are then displayed online, and you can download zones of them to view without Internet.

  1. Open Settings, then “Geogarage charts”.
  2. Tap “Login” and enter the email address (or username) and password of your Geogarage account. The message “Login successful! You are now connected to Geogarage.” confirms the connection.
  3. In the “Layer” list, choose the service you subscribed to, for example SHOM.
  4. On the chart, open the layers menu (round orange button at the bottom right) and choose “Geogarage” in the “Maps” section. The list on the right lets you change layer.
  5. To navigate offline, go back to “Geogarage charts” and tap “Add New Zone” (see below).

Going further

The Geogarage account

  • The account and subscriptions are managed with Geogarage, not in NavimetriX. A space at the beginning or end of the password is ignored: avoid them.
  • When signed out, the page offers “Sign up to Geogarage” and “Access my account” links, which open the Geogarage website. On iPhone, iPad and Mac, it offers instead a “Need help” link to our FAQ. The login window offers “Forgot password” (or “Need help” on Apple devices).
  • Without an Internet connection, the button shows “Offline” and stays inactive. The list of already known layers and the downloaded zones remain accessible.
  • Your Geogarage username is part of the settings synchronized by your NavimetriX account. The choice of the displayed layer and the downloaded zones remain specific to each device.
  • The first time you display a layer, NavimetriX shows the attribution text of its publisher (source and rights of the charts). It does not appear again afterwards, on any of your devices.

To subscribe, choose a service according to your sailing area and check the coverage of each, see the FAQ Geogarage catalog and How do I get nautical charts?.

Downloading a zone for offline use

Without a download, Geogarage charts are only displayed when the device is connected to the Internet. A downloaded zone is displayed everywhere, even offshore.

Selecting a new Geogarage zone: rectangle with green handles on the chart and “Area selection” panel with the “Max Zoom” settingSelecting a new Geogarage zone: rectangle with green handles on the chart and “Area selection” panel with the “Max Zoom” setting

  1. In “Geogarage charts”, check the chosen “Layer”: the zone will be downloaded from this service.
  2. Tap “Add New Zone”. On a phone, the settings drawer closes to make room for the chart.
  3. A rectangle appears. Move it and adjust its corners to cover your area.
  4. Choose the “Max Zoom”:
    • “18 (All)”: all scales, down to harbor and anchorage plans. The zone is limited to 25 square degrees, for example 5° × 5°.
    • “11 (Offshore)”: only small-scale charts (passage and crossing charts), over a much larger zone, up to 2,500 square degrees, for example 50° × 50°.
  5. If the message “Selected zone is too large” appears, reduce the rectangle or switch to “11 (Offshore)”. Then tap “OK”.

The panel then shows the progress as a percentage and the size already received. Several zones can complement each other: an “All” level over your sailing basin and an “Offshore” level for the crossing, for example.

Progress of a Geogarage zone downloadProgress of a Geogarage zone download

Managing downloaded zones

The “Downloaded Zones” list shows the zones of the chosen layer. While the page is open, their outline is drawn on the chart. Each zone shows its layer, the chosen “Max Zoom” (“all” or “offshore”) and the download date. Its name is green for an “all” zoom, orange for an “offshore” zoom.

  • Center: tap a zone to center the chart on it.
  • Rename: long-press (or long-click) its name, enter the new name and confirm. The name is not synchronized between your devices, nor are the zones.
  • Refresh: when the service publishes a new edition of its charts, the round refresh button to the right of the zone becomes active. Tap it to download the zone again; the old file is deleted once the new one is received, and the chosen name is kept. To refresh several, tick them and tap “Refresh Selected”: they are downloaded one after the other.
  • Delete: tick one or more zones, tap “Delete Selected” and confirm.

If a failure message appears when the request is made, check that the zone is actually covered by the chosen layer: the service may not publish any chart at that location.

See also

↑ Contents

6.3 C-MAP charts: purchase, account and zones

Beginner

The essentials

NavimetriX displays the generation X C-MAP vector charts, DISCOVER X and REVEAL X, purchased as a “Digital License” on the C-MAP store. The purchase is made from C-MAP, with a C-MAP account; NavimetriX then reads the charts of that account. A chart is not downloaded in one block: you choose the zones you need, which then remain available without Internet.

  1. Buy your chart as a “Digital License” on the C-MAP store (the detailed procedure is in the FAQ C-MAP charts in NavimetriX).
  2. In NavimetriX, open Settings, then “C-MAP Charts”, and tap “Account”.
  3. Tap “Sign in to C-MAP”. A login page opens in your browser: enter the email address and password of your C-MAP account, then return to NavimetriX.
  4. Check that the dot on the “Account” button is green. If not, reopen the “C-MAP Account” window: its first sentence says what is missing, and the “Register this device” button restarts the registration.
  5. Open “My Charts” and tap “Add a zone”. Adjust the rectangle on the chart, tap “OK”, tick the layers you want and tap “Download”.
  6. In the layers menu (round orange button at the bottom right), choose “C-MAP” in the “Maps” section.

C-MAP account: green dot, status sentence, signed in as, device registered to this accountC-MAP account: green dot, status sentence, signed in as, device registered to this account

Going further

Which charts?

Only generation X C-MAP charts work: DISCOVER X and REVEAL X. REVEAL X adds to DISCOVER X satellite images, shaded relief and layers on the nature and hardness of the seabed. With DISCOVER X charts only, these layers are greyed out in NavimetriX. The full comparison, the coverage check before purchase and the duration of the update subscription are detailed in the FAQ C-MAP charts in NavimetriX.

The C-MAP account and device registration

The “C-MAP Account” window opens from the “Account” button on the “C-MAP Charts” page. This button carries a dot that shows the state of the account at a glance, and the window starts with a sentence that explains it:

DotSentence in the windowWhat it means
Green“Signed in and device registered: new charts can be downloaded.”Everything is in order.
Orange“Registration of this device not confirmed: new charts cannot be downloaded.”You are signed in, but NavimetriX could not verify the registration of the device with C-MAP, for example because the C-MAP server answered with an error. This does not necessarily mean the device is “not registered”: tap “Register this device”, or sign out and sign in again.
Red“Not signed in to C-MAP: new charts cannot be downloaded.”No session: tap “Sign in to C-MAP”.

Charts that are already downloaded are always displayed, whatever the color of the dot and whether or not your subscription is up to date. Only downloading new zones depends on the account.

  • Sign-in: “Sign in to C-MAP” opens the C-MAP login page in the browser. Once signed in, the window shows “Signed in as:” followed by your address. “Sign out” closes the session.
  • Registration: each device that displays C-MAP charts must be registered to your account. A chart can only be registered on two types of device: a desktop computer or a chartplotter (the fixed navigation display of a boat). C-MAP limits their number per chart, phones and tablets being handled separately; the details are in the FAQ On how many devices can I use my chart?.
  • Freeing a slot: “Unregister this device” removes the device from your account. Note that this deletes all the charts and zones downloaded on this device; NavimetriX asks for confirmation.
  • Other devices: “Manage my devices on c-map.com” opens your C-MAP account on the web, where you can see and remove the other registered devices.
  • The “Need help with your C-MAP account?” link opens our FAQ.

The choice of the “C-MAP” base map is specific to each device: enabling it on one does not enable it on your other devices, and so does not take up a slot on your C-MAP account there.

My Charts

“My Charts” opens from the “C-MAP Charts” page. At the top, “Available charts” lists the charts of your account. For each one:

  • its name (for example CENTRAL AND WEST EUROPE);
  • its type, REVEAL X or DISCOVER X, and its code (for example EW-T-227-R);
  • its status: “Valid until” followed by the subscription end date, or, in red, “Subscription expired on” followed by the date.

An expired chart remains displayed in the zones already downloaded, but no longer allows downloading new ones or updating them.

Below, “Downloaded zones” lists your zones, with the code of the chart they come from. As long as the page is open, their purple outline is drawn on the chart. Tap a zone to center it.

My Charts: available charts, downloaded zone and its outlineMy Charts: available charts, downloaded zone and its outline

Adding a zone

“Add a zone” is only active if you are signed in to your C-MAP account, the device is registered and your account contains at least one chart. Otherwise the button is greyed out and a line just below says why: “Sign in to your C-MAP account to download zones.”, “The registration of this device is not confirmed: zones cannot be downloaded yet.” or “No C-MAP chart licence found on your account.”

  1. Tap “Add a zone”. The settings drawer closes and a rectangle appears on the chart.
  2. Move the rectangle and adjust it with its handles. A zone measures at most 300 miles by 300 miles: beyond that, the message “Zone too large (max 300 × 300 NM)” appears and it must be reduced.
  3. Tap “OK”. NavimetriX checks the zone:
    • if several of your charts cover it, the “Choose a chart” window lists them with the share of the zone each one covers; choose one and tap “Continue”;
    • if part of the zone falls outside your chart, it is reduced to the covered part, and a message indicates the share removed;
    • if no valid chart covers it, or if it is already downloaded, a message says so.
  4. The “Layers to download” window opens. If you wish, give the zone a name (“Zone name (optional)”), tick the layers and tap “Download”. Only the navigation charts layer is ticked by default: it is the only essential one. Satellite images and shaded relief (REVEAL X) are much larger; the size of each layer and the “Total” are shown before you confirm.

A banner shows the progress, and you can keep using the application meanwhile. Once the zone has been received, the detailed chart is displayed there, even without a connection.

Layers to download: navigation charts, Social Map layers, satellite images, shaded reliefLayers to download: navigation charts, Social Map layers, satellite images, shaded relief

Updating, completing or deleting a zone

  • Update or add layers: tap the round refresh button to the right of the zone, in “My Charts”. NavimetriX analyzes the zone, then offers the layers to add or update. Tick them and tap “Download”. With no layer ticked, the button becomes “Save”: it is then used to rename the zone. Do not use “Add a zone” for this.
  • Empty zone: a zone whose download was interrupted stays listed with the mention “no data downloaded”; the same round button downloads it again.
  • Delete: tick one or more zones, tap “Delete selection” and confirm.

See also

↑ Contents

6.4 Enabling C-MAP on iPhone and iPad

Expert

The essentials

On iPhone and iPad, an “Enable C-MAP” switch in the device Settings > Apps > NavimetriX lets you avoid loading C-MAP at all, if you do not use these charts. It is on by default.

Going further

Turning C-MAP off

The C-MAP chart engine takes up memory even when you are not using it. On iPhone and iPad, you can switch it off:

  1. Open the Settings of the iPhone or iPad, select “Apps” then “NavimetriX”.
  2. In the “C-MAP charts” group, turn off “Enable C-MAP” (on by default).
  3. Quit NavimetriX completely and relaunch it: the setting takes effect at the next launch.

With C-MAP off, the chart engine is not loaded: the “C-MAP Charts” page of the Settings, the “C-MAP” base map in the layers menu and the features that depend on it (AutoRouting, object information) disappear. To get C-MAP back, turn the switch on again and relaunch NavimetriX.

iPad Settings, NavimetriX page: “C-MAP charts” group with the “Enable C-MAP” switch and its explanatory textiPad Settings, NavimetriX page: “C-MAP charts” group with the “Enable C-MAP” switch and its explanatory text

See also

↑ Contents

6.5 C-MAP chart settings

Expert

The essentials

Top of the C-MAP settings: chart style, units, depths and safetyTop of the C-MAP settings: chart style, units, depths and safety

The C-MAP settings change the presentation of C-MAP charts, and only of them: weather, routes and AIS targets are not affected. They are in Settings, “C-MAP Charts”, under the “Account” and “My Charts” buttons. The dot on the “Account” button shows the state of your C-MAP account (green: signed in and device registered; orange: registration not confirmed; red: not signed in): it only concerns the download of new zones, never the display of charts already downloaded (see C-MAP charts: purchase, account and zones). When you are signed in to your NavimetriX account, they follow you to your other devices.

  1. Open Settings, then “C-MAP Charts”.
  2. At the top, choose the “Chart style”.
  3. Adjust the “Units”, “Depths and safety”, “Dangers”, “Seabed”, “Additional layers” and “Display” sections.
  4. At the bottom, choose the “Cartography type”.
  5. For the most-used layers, save time with the three quick buttons placed to the right of “C-MAP” in the layers menu.

The “What do the settings below do?” link opens the FAQ C-MAP chart settings, which shows each setting in pictures, before and after.

Going further

Chart style and cartography type

  • “Chart style”: “Default” (day presentation), “Night”, “NOAA” (presentation of US charts) or “NOAA Night”. With the application’s “Night” theme, NavimetriX automatically switches to the night variant of the chosen style, then switches back when you leave the theme (see Base maps and orientation). Since the theme is specific to the device, this switch is not passed on to your other devices.
  • “Cartography type”: “C-MAP cartography” (default value, all the C-MAP content) or “ENC charts only”. This second choice only displays the official electronic navigational charts (ENC) of the hydrographic services, without content specific to C-MAP such as high-resolution bathymetry and shaded relief.

The sections

The list of settings is provided by the C-MAP chart engine; their names may therefore change with versions of this engine. Each depth or height value is entered in the unit shown in its title, the one chosen under “Units”.

SectionWhat you set there
“Units”Units of depth (meters, feet or fathoms) and height (meters or feet)
“Depths and safety”Shallow-water alert (red hatching below the depth set in “Below”), critical air draft (bridges in red up to the value of “Red up to”), depth contour filters and labels, soundings filter
“Dangers”Filters for wrecks, rocks and obstructions: “Hide deeper than” a depth
“Seabed”Seabed area (nature of the seabed in colors, with its legend), crowd-sourced seabed hardness
“Additional layers”High-resolution bathymetry, crowd-sourced bathymetry, crowd-sourced vegetation, shaded relief and its opacity, satellite imagery and its opacity
“Display”Marine protected areas, national text, magnification of text and symbols

A few rules to know:

  • Danger filters: a danger whose depth is not known is never hidden, and a danger that uncovers at low tide remains displayed. These filters lighten the chart, they do not replace a safety margin.
  • Greyed-out rows: a greyed-out row has no effect for now, usually because it depends on a switch that is off (crowd-sourced bathymetry requires high-resolution bathymetry, for example).
  • REVEAL X layers: seabed area, seabed hardness, crowd-sourced vegetation, shaded relief and satellite imagery, with their opacities, are sold with REVEAL X charts. If your account has no valid REVEAL X chart, these rows are greyed out. If you have charts of both types, they stay active but are only displayed on REVEAL X charts. An expired REVEAL X chart no longer counts.

The quick buttons in the layers menu

When “C-MAP” is the active base map, three buttons appear to its right in the “Maps” section of the layers menu. An orange button signals an enabled layer.

  1. Satellite (image icon, REVEAL X): satellite images, over land only: at sea, the nautical chart remains visible. To cover the sea too, choose “Enabled” in the C-MAP settings page, “Satellite imagery” row.
  2. Relief (mountain icon, REVEAL X): shaded relief of the land and the seabed.
  3. HRB (grid icon): high-resolution bathymetry, that is, C-MAP’s detailed depth contours.

Satellite and relief both shade the land: enabling one disables the other. High-resolution bathymetry is independent. These buttons change the same settings as the “C-MAP Charts” page. Without a valid REVEAL X chart, satellite and relief are greyed out. In this case, as with charts of both types, the note “Satellite and relief: REVEAL X charts only” appears under the row.

The three quick buttons to the right of C-MAP: satellite, relief, high-resolution bathymetryThe three quick buttons to the right of C-MAP: satellite, relief, high-resolution bathymetry

Returning to the default presentation

Turn off the alerts and filters, choose the “Default” style and the “C-MAP cartography” type.

See also

↑ Contents

6.6 C-MAP: object information

Expert

The essentials

On a C-MAP chart, each object (buoy, light, sounding, wreck, restricted area…) carries an information sheet: its characteristics, as the chart describes them. The “Inspection” window displays them in one gesture.

  1. Choose “C-MAP” in the “Maps” section of the layers menu.
  2. Long-press the object, or double-click with the mouse.
  3. The “Inspection” window lists on the left the objects found at that spot. Tap one to read its characteristics on the right.
  4. Close the window with the cross at the top right.

Inspection window: lateral buoy, topmark and light, with their characteristicsInspection window: lateral buoy, topmark and light, with their characteristics

Going further

The “Inspection” window

  • Where to tap: the search covers the objects near the touched point; the tolerance follows the scale, tight when you are zoomed in on a harbor, wider in an overview. Zoom in if the window shows “No features found”.
  • Other objects take priority: if the long press lands on an AIS target, a POI or a route, that object is selected, and the “Inspection” window does not open.
  • Content: one tab per object found (lateral buoy, depth contour, sounding, depth area, magnetic variation…), and for the chosen object, its attributes: shape, color, mark category, light characteristics, period, data source… Some objects carry photos: tap one to enlarge it full screen.
  • Position: the bottom of the window gives the position of the touched point, in degrees, minutes and seconds.
  • Placement: on a phone, the window opens at the center of the screen; on a tablet or a computer, next to the touched point.

The sheet can only be read on the “C-MAP” base map. On other base maps, the long press keeps its usual functions.

See also

↑ Contents

↑ Contents

7 POIs, Routes and ZOIs

This chapter explains how to place and manage your points of interest (POIs), draw and edit routes, and navigate to a point or along a route with GPS. It also covers exchanging POIs and routes with other software (GPX, KML, Adrena formats, ECDIS RTZ), the zones of interest (ZOIs) that routing can avoid, and automatic route drawing with C-MAP AutoRouting.

7.1 Create and Edit a POI

Beginner

The essentials

POI creation window: name, icon, position, format, lock, commentPOI creation window: name, icon, position, format, lock, comment

A POI (Point Of Interest) is a point you place on the chart: an anchorage, a race buoy, a mark to round, a harbour. A POI can then serve as a destination, or as a waypoint of a route.

  1. Drag the chart to bring the desired spot under the target, at the centre of the screen. Zoom in to be precise.
  2. Tap the round orange “+” button, at the bottom right, then “Add POI”.
  3. Type the point’s name in “Mark name”, choose an icon if you want one, then tap “OK”.

On a computer, more directly: right-click at the desired spot on the chart, then “Add POI”. The POI is created under the pointer, without going through the target.

Going further

The POI window

FieldPurpose
“Mark name”Name of the POI. Required: “OK” stays inactive while it is empty.
“Icon”Symbol displayed on the chart: anchor, port and starboard buoys, lighthouses, cardinal marks, lateral marks, channel marks, isolated danger or special marks, race buoys, coloured boats, shapes, wreck, rock, MOB, target… “Disabled” displays only a dot.
“Show name on chart”Writes the name next to the POI.
“Latitude” and “Longitude”Position of the POI, pre-filled with the chosen spot. You can correct it with the keyboard.
“Format”Coordinate entry format: degrees and decimal minutes (D°M.m’), degrees, minutes and seconds (D°M’S") or decimal degrees (D.d°). It starts from the format chosen in the units settings.
“Lock position (no drag on map)”Prevents moving the POI by mistake.
“Comment”Free text: anchorage depth, instructions, times…

Edit, move or delete a POI

Tap (or click) a POI on the chart: a menu opens.

  • “Edit POI” reopens the same window. If you are navigating to this POI, the destination follows the new coordinates.
  • “Move POI”: the POI gets bigger, drag it to its new position. On a touch screen, it is displayed slightly above your finger so that it stays visible. If you do not drag within 20 seconds, the move is cancelled. This entry does not appear for a locked POI: unlock it first with “Edit POI”.
  • “Delete POI” asks for confirmation. If you were navigating to this POI, navigation stops; if the target was locked on it, the target returns to the centre of the screen.

The same menu also offers “Begin route” (a route that starts from this POI), “Route to this POI”, “Lock target on this POI” and “Goto”: see Create and edit a route and Navigate to a POI and follow a route. On the C-MAP background, it also offers “C-MAP AutoRouting” (see C-MAP AutoRouting). The anchor POI, placed by “Drop anchor”, has its own entries for the anchor alarm (see Anchor alarm).

A POI’s menu on the chartA POI’s menu on the chart

Zoom level at which details appear

With many POIs, the chart quickly becomes cluttered. The “Show details for zoom over” setting, at the top of the POIs tab of the left drawer, sets the zoom level from which the icon and name appear. Below it, each POI is just a dot. The value ranges from 5 to 18; it is 13 by default, roughly the view of a harbour.

If a POI does not appear

  • Check the “POIs” box in the “Display” section of the layers menu: it shows or hides all POIs.
  • Check the eye to the right of the POI in the POIs tab: it shows or hides that POI alone.
  • If only a dot appears, zoom in further or lower the “Show details for zoom over” setting.

Your POIs are saved with your settings: when signed in to your NavimetriX account, you find them on your other devices (see Syncing between devices).

See also

↑ Contents

7.2 POI List, Import and Export

Beginner

The essentials

POIs tab: sort, filter, details zoom, list and Import, Export, Delete buttonsPOIs tab: sort, filter, details zoom, list and Import, Export, Delete buttons

All your POIs are stored in the POIs tab of the left drawer. There you find a point, centre the chart on it, hide it, and import or export point files.

  1. Open the left drawer (chevron handle at the left edge of the screen), then the “POIs” tab.
  2. Tap a POI’s name to centre the chart on it.
  3. The eye at the right of a line shows or hides that POI on the chart. The “⋮” button offers “Rename” and “Delete”.
  4. To import points, tap “Import” at the bottom of the tab and choose one or more GPX, KML or WP files.
  5. To export, tick the desired POIs then tap “Export” (“Share” on phones and tablets).

Going further

Sort and filter

  • “Sort”: “Alphabetical” or “Distance ↑” (from nearest to farthest). The choice is remembered on the device.
  • Distance and bearing: with a GPS position, each line shows the POI’s distance in your unit (nautical miles by default) and its bearing from the boat, true or magnetic depending on the units settings, for example “228.4 NM • 249°T”. Without a position, a warning indicates that distance functions are disabled: sorting by distance and filtering by distance no longer work.
  • Filter: the “Filter by name or distance…” field keeps the POIs whose name contains the text entered. With a GPS position, it also accepts distances in nautical miles:
InputPOIs kept
2020 miles or less away
>200more than 200 miles away
<50less than 50 miles away
10-100between 10 and 100 miles away

The “?” button at the right of the field recalls these examples.

Import POIs

“Import” accepts three formats, and several files at once:

  • GPX (.gpx), the common exchange format of GPS units and navigation apps;
  • KML (.kml), the Google Earth format;
  • WP (.wp), the Adrena waypoint format.

A point whose name already exists in your list (case-insensitive) is not imported a second time. The final message gives the number of new POIs and ignored duplicates, as well as unreadable files or files with no valid point.

Export and share

Tick the POIs to export. The top box, “Check to select all … POIs”, ticks them all at once, or only those that pass the filter if a filter is entered.

  • On a computer, “Export” opens a save window: choose the GPX or KML format and the file location.
  • On phones and tablets, “Share” creates two files, one GPX, one KML, and opens the system share sheet (messaging, email, files…).

Delete several POIs

Tick the POIs then tap “Delete” and confirm. The anchor POI cannot be deleted while the anchor alarm is armed: disarm it first.

See also

↑ Contents

7.3 Create and Edit a Route

Beginner

The essentials

A route is a series of waypoints joined by segments. It is used to prepare a passage, to follow it with GPS, or as the basis for a weather routing.

  1. Tap the round orange “+” button, then “Create route”. On a computer, you can also right-click on the chart, then “Create route”.
  2. Tap the chart at each waypoint, in order. A point placed near a POI snaps to it. Drag a point to move it; tap a segment to insert a point.
  3. Tap “Finish” in the banner at the top of the screen.
  4. Give the route a name in the “Save route” window and confirm.

The route is stored in the “Routes” tab of the left drawer. A route has at least 2 waypoints.

Going further

While creating or editing

Editing a route: top banner, length and bearing of a segment, a point’s menuEditing a route: top banner, length and bearing of a segment, a point’s menu

The top banner is titled “Create route” (or “Edit route”) and recalls the gestures. Each segment shows its length and bearing.

  • Add a point: tap (click) the chart. Points are named “Waypoint 01”, “Waypoint 02”… until you rename them.
  • Snap to a POI: a point placed near a POI takes its position and name. You can also tap the POI itself.
  • Insert a point: tap an existing segment.
  • Move a point: drag it. On a touch screen, it is displayed slightly above your finger.
  • Edit or delete a point: tap it (right-click on a computer), then “Edit point” or “Delete point”.
  • Abort: “Cancel” leaves without saving anything.

A route never snaps to AIS targets, even when they are displayed.

The waypoint window

“Edit point” opens the waypoint window: its name, the “Show name on chart” box, its latitude and longitude (with the “Format” choice), and two passing settings.

  • The passing type, which routing respects:

    • “Pass through this point” (default): the route goes through it;
    • “Leave to port” or “Leave to starboard”: routing must pass on the correct side of the point, without necessarily touching it.

    For the first and last points, the list is greyed out: they are always pass-through points. On the chart, a point to be left to starboard is green, a point to be left to port is red.

  • “Side:” (“None”, “Port”, “Starboard”): for a mark to be rounded, for example a race buoy, which side to leave it on. This is information for the crew: routing ignores it and keeps passing through the point. This selector is only active with “Pass through this point”.

The same mark can appear twice in a course with a different side at each passage. The side is then displayed in the Route details and in the Course tracking instrument (see Course tracking).

Create a route from your POIs

To chain existing POIs without tapping the chart, open the “Routes” tab and tap “From POI” at the bottom of the panel. The “Create route from POIs” window opens:

  1. Enter the route name.
  2. In the POI list, sorted by distance, name, latitude or longitude and filterable by name, tap the POIs in the order you will pass them. “New POI” creates one on the fly.
  3. In the route’s tab, reorder or remove points if needed, and choose for each one how to pass it, with the label at the right of the line.
  4. Tap “Create route”.

The “Create route from POIs” window: a route name entered, the POI list on the left and three POIs added in passing order on the rightThe “Create route from POIs” window: a route name entered, the POI list on the left and three POIs added in passing order on the right

You can also start from a POI on the chart: tap it and choose “Begin route”. The route starts from that point.

The Routes tab

Each route shows its length and, with a GPS position, the distance and bearing of its starting point (“Start”). “Sort” orders them by “Most recent”, “Alphabetical” or “Distance from start”; the “Filter by name…” field filters them. The eye shows or hides a route on the chart.

A route’s “⋮” button opens its menu:

EntryEffect
“Details”The route’s passage table (see below).
“Edit on Map”Reopens the route for editing on the chart.
“Edit from POIs”Reopens the route in the POIs window.
“Rename”Changes the route’s name.
“Duplicate”Creates a copy named “(copy)”.
“Reverse”Creates a new route sailed in the opposite direction, named “(reversed)”. Points to be left to port become starboard, and vice versa. The original route does not change.
“C-MAP AutoRouting”On the C-MAP background only: see C-MAP AutoRouting.
“Export” (“Share” on phones and tablets)See Import and export routes.
“Delete”Deletes the route after confirmation.

The Routes tab of the left drawer and a route displayed on the chartThe Routes tab of the left drawer and a route displayed on the chart

The route menu on the chart

Tap a route displayed on the chart (a segment or a waypoint): its menu offers “Calculate routing”, “Edit route”, “Hide route” and “Delete route”. Tapped on a waypoint, it also offers “Follow route, start here”. While following, it offers “Go to this mark”, “Stop following” and “Reset XTE” (see Navigate to a POI and follow a route). On the C-MAP background, it also offers “C-MAP AutoRouting”.

Editing the route you are following suspends following for the duration of the edit; it then resumes at the mark reached, whether or not you save.

The route details

“Details” opens the route’s passage table, with its total length and one line per waypoint:

  • DTW (Distance To Waypoint): length of the segment leading to this waypoint from the previous one;
  • BTW (Bearing To Waypoint): bearing of that segment;
  • DFS (Distance From Start): cumulative distance from the start;
  • DTE (Distance To End): remaining distance to the finish.

Under each waypoint’s name, a label indicates how to pass it. Tap it to choose among five entries: “Pass through this point”, “Round, leaving to port”, “Round, leaving to starboard”, “Leave to port” and “Leave to starboard”. This change moves no point: the followed route is updated without interrupting navigation.

Route details: DTW, BTW, DFS, DTE columns and a mark’s passing menuRoute details: DTW, BTW, DFS, DTE columns and a mark’s passing menu

See also

↑ Contents

7.4 Import and Export Routes

Expert

The essentials

NavimetriX reads and writes routes in four formats: GPX, KML, RT (Adrena) and RTZ (the route exchange format of ECDIS, the electronic chart systems of professional ships). Import and export are done from the “Routes” tab of the left drawer.

  1. Open the left drawer, “Routes” tab.
  2. To import, tap “Import” at the bottom of the panel and choose one or more files.
  3. To export, tick the desired routes then tap “Export” (“Share” on phones and tablets). For a single route, the “Export” (or “Share”) entry in its “⋮” menu does the same thing.

Imported routes are added at the top of the list.

Going further

The formats

FormatExtensionWhat it contains
GPX.gpxThe common exchange format of GPS units and navigation apps: names and positions of points.
KML.kmlThe Google Earth format: names and positions of points.
RT (Adrena).rtThe route name, then the names of the marks and how to pass them. No positions.
RTZ.rtzThe ECDIS format, defined by the IEC 61174 standard. One route per file.

The Adrena RT format

An RT file only gives the names of the marks, not their positions. On import, NavimetriX finds each mark among your POIs, by its name: first import the matching WP waypoint file in the POIs tab (see POI list, import and export). A route with a mark that cannot be found is not imported, and a route that is already present is ignored; the final message gives the count.

On export, each mark is written with its passing instruction: pass through the mark, leave it to port or leave it to starboard. A mark to be rounded with a specified side is exported as to be left on that side. The software that reads the file back must know marks with the same names.

The ECDIS RTZ format

  • Import: NavimetriX reads the route name, and the names and positions of the waypoints, and leaves out the rest (times, speeds, permitted cross-track distances per segment, extensions). If the name is already taken by one of your routes, a suffix “(1)”, “(2)”… is added. Rhumb-line segments (constant bearing) are drawn as great-circle arcs, like all NavimetriX routes.
  • Export: one file per route, in RTZ 1.0 format, which any ECDIS compliant with the standard must be able to read. The route name in the file is the file name, as RTZ validators require. Each segment is written as a great circle, and points at 0° N 0° E are ignored. A route must keep at least two points.

Exporting on a computer

“Export” opens a save window: choose the format (GPX, KML, RT or RTZ) and the file name. GPX, KML and RT group all the ticked routes into a single file. In RTZ, several routes give several files, each named after its route, in the chosen folder; an existing file is never overwritten, a number is added to the name.

Sharing on phones and tablets

“Share” prepares all the formats at once: one GPX file, one KML and one RT for all the ticked routes, plus one RTZ file per route. The system share sheet then opens (messaging, email, files…); keep only the file useful to the recipient.

Routes tab of the left drawer and the macOS “Import Route Files” window, with its “Route files (*.gpx *.kml *.rt *.rtz)” filter; file and folder names blurredRoutes tab of the left drawer and the macOS “Import Route Files” window, with its “Route files (*.gpx *.kml *.rt *.rtz)” filter; file and folder names blurred

See also

↑ Contents

7.5 Navigate to a POI and Follow a Route

Beginner

The essentials

NavimetriX can guide you to a POI (“Goto”) or along a route, mark by mark. It then calculates the distance, bearing and cross-track error to the point you are heading for, which can be shown in the instruments and sent to the autopilot. Guidance on the chart requires Navigation mode, reserved for the Premium subscription: turn it on with the “Navigation” switch at the top of the left drawer.

Go to a POI

  1. Tap (or click) the POI on the chart.
  2. Choose “Goto”, then confirm “Navigate to … ?”
  3. To stop, tap the POI again, choose “Stop goto” and confirm.

Follow a route

  1. Display the route on the chart (the eye in the “Routes” tab).
  2. Tap the waypoint to start from, then “Follow route, start here”.
  3. To stop, tap the route, choose “Stop following” and confirm.

Route following: green cross-track corridor and waypoint menu (Go to this mark, Stop following, Reset XTE)Route following: green cross-track corridor and waypoint menu (Go to this mark, Stop following, Reset XTE)

Going further

Go to a POI

In Navigation mode, a dotted line joins the boat to the POI as long as the boat is at sea. The boat’s position at the time of the “Goto” serves as the starting point for the cross-track calculation. If you edit or move the target POI, the destination follows.

A “Goto” replaces the route following in progress. While following a route, the POI menu therefore always offers “Goto”, never “Stop goto”.

Follow a route

  • Start: the boat’s position at launch becomes the origin of the first segment; the first segment therefore starts from where you are, not from where you should have been.
  • Automatic switching: NavimetriX moves on to the next waypoint when the boat comes within 0.1 mile of the target waypoint, or when it crosses the perpendicular to the segment through that waypoint (useful if you pass the mark a little wide).
  • Change mark: while following, tap another waypoint of the route and choose “Go to this mark”. Following resumes towards that point: to skip an abandoned mark, or to go back to a mark validated too early after a GPS position jump.
  • Edit the followed route: following is suspended during the edit, then resumes at the mark reached.

The cross-track corridor (XTE)

The XTE (Cross Track Error) is the distance between the boat and the straight line from the starting point to the target point. In Navigation mode, during a “Goto” or a route following, a corridor is drawn on either side of this line, when the chart is zoomed to harbour view or closer.

  • The distance between the line and each edge of the corridor is set in Settings, “My Boat”, “Cross track” section, “XTE limit” line: from 0 to 2,000 m, 500 m by default (1,000 m wide corridor).
  • “Reset XTE”, in the route menu during following, starts again from the boat’s current position: the reference line now runs from the boat to the target point.
  • An alarm can sound if you leave the corridor: Settings, “Alarms”, cross-track section (see Navigation alarms).

The laylines

Laylines are the two ideal tacking lines to the target point, upwind or downwind, calculated from the wind and the boat’s polar. Green is the starboard tack, red is the port tack. They appear during a “Goto” or a route following, in Navigation mode, when the “Laylines” box in the “Display” section of the layers menu is ticked, and only if the boat is closing on the point (positive VMC, VMC being the speed of approach to the target point). See also the chapter Navigation: GPS, NMEA and AIS.

Lock the target on a POI

The target is the reference point for several chart functions, such as “Route to the target” in the “+” menu. By default, it is the centre of the screen. In a POI’s menu, “Lock target on this POI” fixes it on that POI, even when you move the chart; “Unlock target” puts it back at the centre of the screen. The “Target” list in the layers menu offers the same choices (“Disabled”, “Screen center”, “GPS position” or a POI). Deleting the locked POI brings the target back to the centre of the screen.

Steering the boat

If your autopilot receives NavimetriX’s NMEA data, it can follow the bearing to the target point, then the successive bearings of the route. NMEA output configuration is described in NMEA outputs.

See also

↑ Contents

7.6 ZOIs (Zones of Interest)

Beginner

The essentials

A ZOI (Zone Of Interest) is a polygon drawn on the chart. There are three types:

  • “No-Go Zone”, drawn in red: traffic separation scheme (TSS), wind farm, protected area, area excluded by the sailing instructions… Routing can avoid it.
  • “Slow Zone”, drawn in orange: sargassum field, speed-limited area, dangerous sea… Routing can reduce the boat’s speed in it.
  • “Information”, drawn in blue: an area to flag, with no effect on routing.

To create one:

  1. Tap the round orange “+” button, then “Create ZOI”. On a computer, you can also right-click on the chart, then “Create ZOI”.
  2. Tap the chart to place the vertices of the outline, at least three.
  3. Tap “Finish” in the top banner.
  4. In the “Save zone” window, enter the “Zone name”, choose the “Zone Type” and, if you wish, a comment. Confirm with “OK”.

ZOIs are stored in the “ZOIs” tab of the left drawer.

“ZOIs” tab of the left drawer and the lanes of the Ushant traffic separation scheme drawn in red on the chart“ZOIs” tab of the left drawer and the lanes of the Ushant traffic separation scheme drawn in red on the chart

Going further

The zone window

FieldPurpose
“Zone name”Name displayed in the list.
“Zone Type”“Information”, “No-Go Zone” or “Slow Zone”.
“Speed Factor (0.0 - 2.0)”Slow zones only. Coefficient applied to the boat’s polar speed in the zone: 0.5 halves the speed. 1.0 by default.
“Comment”Free text, for all types: sailing instructions reference, times, instructions…

Edit a ZOI

Tap (or click) a ZOI’s outline on the chart, then “Edit zone” or “Delete zone”.

  • When editing, drag a vertex to move it, or tap the outline to add an intermediate vertex. Tap a vertex (right-click on a computer) then “Delete point” to remove it.
  • The sides must not cross: NavimetriX refuses a polygon whose sides intersect and asks you to move the points.
  • After “Finish”, the zone window reopens: you can change the name, type, speed factor and comment.

The ZOIs tab

  • “Sort”: “Alphabetical”, “Distance ↑” or “Date added”. The “Filter by name…” field filters the list.
  • Tap a zone to centre the chart on it. The eye shows or hides it. The “⋮” button offers “Rename” and “Delete”.
  • Tick zones for the bottom buttons “Export” (“Share” on phones and tablets) and “Delete”. The top box ticks all the listed zones.

ZOIs and routing

Routing only takes no-go zones and slow zones into account, and only if:

  • the zone is displayed (eye on in the ZOIs tab): a hidden zone is ignored;
  • the matching routing setting is on: “Avoid no go zones” and “Slow boat in slow zones”. Both are off by default. See Routing settings.

Import ZOIs from a file

“Import”, at the bottom of the ZOIs tab, accepts two formats:

  • KML (.kml): each polygon becomes a no-go zone, or a slow zone if the file gives it a polar efficiency below 1. The description becomes the comment.
  • .cl10 files (zones exported by Adrena): surfaces become no-go zones; lines (start line, limit) and circles (marks, buoys) become information zones.

Always check the type of each imported zone, and correct it with “Edit zone” if needed.

Import ZOIs from sailing instructions

Sailing instructions often list TSSs and no-go zones as coordinates. Rather than entering them by hand, paste them:

  1. In the sailing instructions document, copy the passage that describes the zones.
  2. In the ZOIs tab, tap “Text”. The “Import from Text” window opens.
  3. Paste the text. Delete unneeded lines and shorten names if necessary: each zone title followed by its points (for example “ZI Cap Finisterre A : 43°31,400N 010°05,150W”) gives one zone.
  4. Tap “Parse Zones”. The list of zones found appears, with the number of points and the extent of each.
  5. Tap “Import … Zone(s)”, or “Back” to correct the text.

Zones imported this way are no-go zones. NavimetriX does its best to read the text, but always check the zones on the chart before relying on them. If you had already drawn a zone at the same place, hide or delete it: only the coordinates in the sailing instructions are authoritative.

Import from Text: pasted text, Parse Zones, then the list of zones found and ImportImport from Text: pasted text, Parse Zones, then the list of zones found and Import

Export and share

ZOIs are exported in KML format. On a computer, “Export” opens a save window; on phones and tablets, “Share” opens the system share sheet.

See also

↑ Contents

7.7 C-MAP AutoRouting

Expert

The essentials

C-MAP AutoRouting draws a detailed route for you between the points you choose: it goes around land and shallows according to the C-MAP chart, and takes your boat’s draft and air draft into account. It needs C-MAP charts, the “C-MAP” background displayed, and downloaded C-MAP zones that cover each of your points.

  1. Display the “C-MAP” background (layers menu, “Maps” section).
  2. Tap the round orange “+” button, then “C-MAP AutoRouting”.
  3. Tap the chart to place the start, any intermediate waypoints, then the finish.
  4. Tap “Finish” in the top banner. The “Calculating C-MAP AutoRouting…” window appears during the calculation; “Cancel” interrupts it.
  5. Give the calculated route a name in “Save route” and confirm. It joins the “Routes” tab.

Route drawn by C-MAP AutoRouting from Le Palais to Quiberon Bay, through the Teignouse channelRoute drawn by C-MAP AutoRouting from Le Palais to Quiberon Bay, through the Teignouse channel

Going further

Where to find it

“C-MAP AutoRouting” only appears when the “C-MAP” background is displayed. It can be started from:

  • the “+” menu;
  • a right-click on the chart, on a computer;
  • a POI’s menu: the route starts from that POI;
  • a route’s menu, on the chart or with the “⋮” button of the “Routes” tab: the existing route is recalculated (see below).

Recalculating an existing route

Started from a route’s menu, AutoRouting takes all of its points as mandatory stops, in order, and calculates the detailed path between them. The result is saved as a new route, offered under the route’s name followed by “(AutoRouting)”. The original route is never modified: the calculated path can be very different, or the calculation can fail.

Draft and air draft

The calculation uses the dimensions entered in Settings, “My Boat”, “Dimensions” section:

  • “Draft”: 2.00 m by default;
  • “Air draft”: 16.00 m by default. It lets the route avoid bridges and obstacles that are too low.

Check these two values before your first AutoRouting.

Zone coverage

Each point of the route must lie within a C-MAP zone that you have downloaded on this device (see C-MAP charts: purchase, account and zones). Otherwise NavimetriX refuses before even starting the calculation and lists the points concerned (“Route point … is not in a downloaded C-MAP zone”), or reports that the whole route is outside your zones.

The straight line between two points may itself leave the zones: that is precisely what the calculation avoids by going around the land. If the calculation fails for this reason, the message tells you between which points the route leaves your zones: download the missing zone and try again.

The calculation is abandoned if it lasts more than 120 seconds, even if the server still answers that it is in progress (message “C-MAP autoroute timed out after 120 s.”).

The result

The calculated route is an ordinary route: its points are called “Waypoint 01”, “Waypoint 02”… and are all pass-through points. You can edit it, reverse it, follow it or export it like any other route (see Create and edit a route). It is a preparation aid: always check it on the chart before following it.

Warning: never use this route as the basis for a NavimetriX weather routing: it contains far too many intermediate points. For a routing, create routes with as few waypoints as possible, to leave the calculation as much freedom as possible. NavimetriX routing is weather routing: it takes the wind and the polar into account. C-MAP AutoRouting is motorboat routing: it goes straight from one point to the next, following segments.

AutoRouting draws a route on the chart, with no weather. For the fastest route according to the wind, use weather routing, which can also take C-MAP charts into account (see Coastal routing with C-MAP charts).

See also

↑ Contents

↑ Contents

8 Polars and Sailchart

The speed polar describes your boat’s performance according to the wind: it is what guides weather routing. This chapter shows how to choose it from the library, create it with iPolar, import it from a file or an ORC certificate, touch it up in the editor and adapt it to your real boat with the efficiencies. It also presents the Sailchart, which says which sail to carry, and the Lost sail function for routing after a breakdown.

8.1 Understand and choose your polar

Beginner

The essentials

Polars window: selected polar, polar menu and the Library, My polars, iPolar, ORC tabsPolars window: selected polar, polar menu and the Library, My polars, iPolar, ORC tabs

The speed polar gives the boat’s speed for each true wind strength (TWS, True Wind Speed) and each angle between the true wind and the boat’s heading (TWA, True Wind Angle). It is what allows weather routing to calculate the fastest route; it is also used for laylines and performance instruments. A poorly chosen polar skews all these calculations.

  1. Open Settings, then “My Boat”.
  2. Tap the “Polar” row, which shows the current polar. The “Polars” window opens.
  3. In the “Library” tab, look for your boat: scroll the list or type part of the name in “Search polar…” (for example “3600” for a Sun Fast 3600).
  4. Tap the polar you want: its name is displayed at the top, opposite “Selected polar”.
  5. Tap “OK” to confirm.

The same “Polar” row exists at the top of the “Routing” settings: it is the same setting.

Going further

The four tabs of the “Polars” window

TabContent
“Library”Nearly 500 polars of well-known boats, supplied with the app. Most come from naval architects or ORC certificates. They can be neither edited nor deleted.
“My polars”Your polars: imported from a file, taken from an ORC certificate, touched up in the editor or degraded after a lost sail. “Import Polar” adds one.
“iPolar”The polars calculated from your boat’s characteristics, and the “Create Polar” button.
“ORC”The current ORC certificate search, by sail number or boat name, to import its polar.

Creation, import, ORC and export are detailed in Create, import and export a polar.

In “My polars” and “iPolar”, tick polars then tap “Delete Selected” to erase them; deletion cannot be undone. If a deleted polar has a Sailchart, NavimetriX offers to keep it in the Sailchart library, to attach it to another polar.

The polar menu

Each polar in the list, as well as the selected polar at the top of the window, has a “⋮” button. Its menu offers:

  • “Edit”: the polar editor (see Polar editor and Report);
  • “Sailchart…”: which sail to carry according to the wind (see Sailchart);
  • “Lost sail…”: a copy of the polar without one sail (see Lost sail);
  • “Export” (“Share” on phone and tablet), with the choice of format.

Synchronisation

If you are logged in to your NavimetriX account, the selected polar and its Sailchart follow you to your other devices, even if it is an imported or touched-up polar.

Working on your polar

Building a reliable polar from your own passages is long work: you need well-calibrated instruments, then you have to sort, filter and smooth thousands of points. A simple method gives most of the result:

  1. Start from a polar close to your boat: library, ORC certificate or iPolar.
  2. Note your real speeds in moderate wind and flat sea: angle and speed upwind, speed on a reach, angle and speed downwind.
  3. Compare them with those of the polar, for example with a constant wind routing, and deduce an efficiency percentage.
  4. Enter this percentage in the routing efficiencies, for light wind and strong wind, and set the minimum upwind angle if your boat does not point as well as the polar says (see Polar efficiency and wind thresholds).
  5. Sail, compare, adjust. To correct the very shape of the polar, use the editor and check the result with its Report.

See also

↑ Contents

8.2 Create, import and export a polar

Beginner

The essentials

If your boat is not in the library, three paths lead to its polar, all from the “Polars” window (Settings, “My Boat”, “Polar” row):

  • iPolar calculates a polar from the boat’s dimensions, in a minute;
  • “My polars” imports the polar file you already have;
  • ORC gets the polar from your boat’s ORC rating certificate.

To create a polar with iPolar:

  1. In the “Polars” window, open the “iPolar” tab and tap “Create Polar”.
  2. Enter a name (at least 3 characters), the length overall, the displacement, the mainsail area and the jib area.
  3. If you know them, add the waterline length and the symmetric and asymmetric spinnaker areas.
  4. Choose the “Navigation style” and the “Polar type”, then tap “Calculate Polar”.
  5. The new polar appears in the list, already selected: tap “OK”.

Going further

iPolar

FieldValues
Polar nameAt least 3 characters. The file takes the suffix _routing or _perf according to the type.
“Length overall (m)”, “Displacement (T)”, “Main sail area (m²)”, “Jib area (m²)”Required.
“Length waterline (m)”, “Sym. spinnaker area (m²)”, “Asy. spinnaker area (m²)”Optional.
“Navigation style”“Cruising” or “Racing”.
“Polar type”“Routing” or “Performance”. The “Routing” type gives speeds equal to 92% of the “Performance” type.

For most cruising boats, “Cruising” and “Routing” give the most realistic polar.

iPolar also creates the polar’s Sailchart: a genoa that is furled as the wind rises and, if you entered their areas, the symmetric and asymmetric spinnakers. You can adapt it afterwards (see Sailchart).

Import a polar file

  1. In the “Polars” window, open the “My polars” tab and tap “Import Polar”.
  2. Choose the file (.pol, .csv or .txt). On computer, the picker opens on the Downloads folder.
  3. The polar appears in “My polars” under the file’s name, with the .pol extension, already selected. Tap “OK”.

The import is tolerant. It reads:

  • angle × strength tables, whatever the separator (tab, semicolon, comma or spaces) and with decimals as a point or a comma: this is the format of most navigation software;
  • Expedition’s pair format, one line per wind strength;
  • CSV files exported by ORC tools, with their lines of optimal upwind and downwind angles.

The file is converted to NavimetriX’s internal format; the original is kept alongside. If the app had to correct something (an empty cell filled by interpolation, for example), the message “Polar imported with warnings:” details what it did, without blocking the import. It is no longer necessary to convert a .csv file to .pol before importing it.

Import the polar of an ORC certificate

A boat rated under ORC already has its polar: it is in its certificate. This function queries the orc.org site and therefore requires an Internet connection.

  1. In the “Polars” window, open the “ORC” tab.
  2. Type a sail number, a boat name or a class name in “Sail number or boat name”, then tap “Search”.
  3. Tap the certificate you want to import its polar into “My polars”.

A single boat can have several current certificates: the list shows each one’s family, “full crew”, “double-handed” or “non-spinnaker”. Take the one that matches your programme.

An ORC certificate covers winds from 4 to 24 knots. The “Extend above 24 kt (extrapolated from similar boats)” box, ticked by default, adds columns up to 60 knots: the app searches its library for the ten polars closest to yours over the common range, and takes up their behaviour in strong wind. These columns remain editable in the editor. The certificate’s identity is kept with the polar.

“Polars” window, iPolar tab: “Create Polar” form with the name, length overall, displacement and sail areas“Polars” window, iPolar tab: “Create Polar” form with the name, length overall, displacement and sail areas

Export a polar

Open the polar’s “⋮” menu, then choose a format under “Export” (“Share” on phone and tablet):

FormatContent
“SailGrib, Adrena (.pol)”The tab-separated table, read by most software.
“Expedition (.txt)”Expedition’s pair format.
“qtVlm (.csv)”Semicolon-separated table.
“Weather4D (.csv)”Comma-separated table.

On computer, the file is saved in your Downloads folder. On phone and tablet, the system share sheet opens. Exported in the “Expedition (.txt)” format, a polar from an ORC certificate regains its exact optimal upwind and downwind angles.

“Polars” window: “⋮” menu of the selected polar, with Edit, Sailchart…, Lost sail… and the export formats“Polars” window: “⋮” menu of the selected polar, with Edit, Sailchart…, Lost sail… and the export formats

See also

↑ Contents

8.3 Polar editor and Report

Expert

The essentials

The polar editor corrects the shape of a polar without a spreadsheet: you move points on a curve and watch the result. Nothing is written, synchronised or used by routing before you save.

  1. Open the “Polars” window (Settings, “My Boat”, “Polar” row).
  2. Open the “⋮” menu of the polar to touch up, then “Edit”.
  3. In the “Curves” view, choose a wind strength and move the curve’s points: with the mouse, drag them; on a touchscreen, tap a point then use the “−0.1” and “+0.1” buttons.
  4. Check the result in the “Slice” and “Targets” views, then in the “Report”.
  5. Tap “Save”, choose a name and confirm. The polar is stored in “My polars”.

Polar editor, Curves viewPolar editor, Curves view

Going further

The five views

ViewWhat it shows
“Curves”Speed by angle, for one wind strength. The curves of neighbouring strengths stay displayed dotted as a reference, and the curve from before your changes appears as an orange ghost. The best VMG (Velocity Made Good, the speed made good along the wind axis) angles upwind and downwind are marked live.
“Slice”Speed by wind strength, for a given angle. This is the view that reveals a bump: a curve touched up apart from the others shows immediately.
“Targets”The best-VMG “Target angles (TWA)” and “Target VMG (kt)”, “Upwind” and “Downwind”, by wind. These are the figures read at the helm: smooth them first.
“Table”The complete table, for inspection and whole-table operations: scale (in %) a column, a row or the whole table, add (“+ row”, “+ column”) or delete a row or a column.
“Report”The automatic analysis of the polar (see below).

Scale several columns

In the “Table” view, tap a wind value at the head of a column to select that column; tap it again to deselect it. To select several neighbouring columns, drag along the wind values, or tap the first then, on computer, Shift-click the last. The button becomes “Scale % · 6-10 kt columns”, for example: the chosen percentage applies to all these columns at once, and a single “Undo” goes back. Handy for degrading light-wind or strong-wind speeds in one go.

The 0 kt column stays at zero, and “Delete column” deletes only one column at a time.

Smoothing, undo, saving

  • “Smooth neighbours while dragging” (“Smoothing” on phone), ticked by default: instead of moving a single point, you gently deform its neighbourhood, nearby angles and neighbouring wind strengths. The “−0.1” and “+0.1” buttons follow this setting.
  • “Undo” and “Redo” go back over your last changes.
  • “Save” asks for a name (“Save as”) and stores the polar in “My polars”. A library polar is never overwritten: you create a copy of it. Keeping the name of a “My polars” polar that you are editing replaces it; taking the name of another “My polars” polar asks for confirmation.
  • “Close” with unsaved changes asks whether to discard them.

On a phone, the editor opens full screen.

The consistency warnings

While you work, the bottom of the editor counts the “Consistency warnings” and quotes the first: a higher speed in lighter wind at the same angle, an isolated spike, an upwind angle that opens as the wind rises, a gybing angle that closes, an upwind speed higher than the beam reach speed… These are the flaws a spreadsheet lets through and a routing amplifies.

The Report

The Report analyses the polar as soon as you open its tab, with no button to press, and gives it a score out of 100: green from 80, orange from 55, red below. If you touch up the polar afterwards, the score is marked “outdated” and the analysis is redone the next time the tab is opened. Each observation is clickable and leads to the relevant view, row or cell.

The analysis covers three levels:

  1. “Internal consistency”: the flaws of the polar itself (speeds inconsistent between wind strengths, spikes, irregular optimal angles, curves too rough overall).
  2. “Fleet comparison”: the polar is compared with the five closest polars in the library, compared on raw speeds. Cells that differ by more than 30% from the median of these neighbours are flagged and highlighted in the “Table” view. A difference is not necessarily an error: your boat may really be faster than its neighbours.
  3. “Physics (iPolar)”: the polar’s shape is checked against what a monohull can physically produce, according to the iPolar generator’s model. The Report gives a match percentage; it warns below 85% and alerts below 75%. This check does not apply to multihulls: if your boat is declared a catamaran or trimaran in “My Boat”, the Report says so.

Report tab: score out of 100, internal consistency, fleet comparison, iPolar physicsReport tab: score out of 100, internal consistency, fleet comparison, iPolar physics

See also

↑ Contents

8.4 Sailchart

Expert

The essentials

A Sailchart answers one question, for each true wind angle (TWA) and each wind strength (TWS): which sail do you carry? It is the digital version of the table a sailmaker supplies with a set of sails (a crossover chart). It is attached to a polar.

The Sailchart never changes the boat’s speed, which comes from the polar alone. It names the sail carried, which lets routing colour the route by sail, show each leg’s sail in its table, count the time spent under each sail and apply a sail change penalty. Underway, an instrument shows the sail to carry (see Which sail to carry). Without a Sailchart, everything works as before, with no sail names.

  1. Open the “Polars” window (Settings, “My Boat”, “Polar” row).
  2. Open the polar’s “⋮” menu, then “Sailchart…”.
  3. If the polar has no Sailchart yet, start from a usual sail set, from another polar’s Sailchart, or import one.
  4. Paint the cells with the sails from the palette, then tap “Save”.

The Sailchart editorThe Sailchart editor

Going further

How it is built

The Sailchart is a grid: the rows are wind angles, the columns wind strengths, and each cell carries a sail code (for example J2, C0, S2). A cell applies to a band, not to a point: the column placed at 12 knots applies from 12 knots up to the next column. A few well-placed bands are enough.

A cell can carry a main sail and alternates, written for example “J2|C0”, for transition bands where two sails are equally good. Routing takes this into account: if the boat is already carrying one of the cell’s sails, it keeps it and pays no change penalty.

Start from something

For a polar with no Sailchart, the editor offers:

  • a usual sail set: “Main + furling genoa (cruising)”, “White sails (main + genoa)”, “Main + genoa + asymmetric spinnaker”, “Main + genoa + symmetric spinnaker” or “Racing (Sun Fast 3200 style)”. These are complete Sailcharts, to be corrected afterwards;
  • another polar’s Sailchart (“or copy the Sailchart of another polar”), handy for several configurations of the same boat, including those filed in the Sailchart library;
  • import of a file (see below).

A polar created with iPolar already has its Sailchart.

Paint

The Sailchart has two layers, as Adrena keeps them: the “Headsails” tab (headsails and spinnakers, the layer the routing reads) and the “Mainsail” tab (the mainsail and its reefs). The palette, the brush and both views follow the layer shown. The mainsail is saved separately in the .sail file, in lines that SailGrib and older versions ignore.

  • Pick a sail in the palette at the top (a single line, which scrolls on small screens): it becomes the brush. Tap a cell to paint it; on a computer you can also paint by dragging the mouse, in the grid as in the polar view. Tapping a row or column header paints the whole band with the brush (sail, alternate or eraser), in a single undo step. On a phone, dragging a finger along a header scrolls the grid instead of painting.
  • Four tools: “Edit” (edits or deletes the selected sail; a right click or long press on its chip does the same), “Add” (a new sail, in the layer shown), “Erase” (the eraser is a brush: it stays active, tapping a cell empties it) and “Alternate” (the sail goes into the cell as an alternate, without replacing the main one).
  • A sail code is unique: a code already taken is refused, when adding as when renaming.
  • A layer with no sail (old Sailchart, template, SailGrib file) says so: tap “Add” to begin.
  • “Bands…” opens the “Angle and wind bands” window: “+ row”, “− row”, “+ column” and “− column” add or remove bands, at the value of your choice (17.5 knots for example). A Sailchart keeps at least three angle bands and two wind bands.
  • “Undo” reverts the last gesture (a brush stroke counts as one step) and goes back to the tab where it was made. When everything is undone, the Sailchart is clean again and “Close” asks nothing. “Esc” and the phone’s back gesture ask the same question as “Close” before discarding changes.

The “Grid” tab shows the table; the “Polar” tab shows the same Sailchart in polar coordinates, both tacks mirrored. The “Single sail” box fills only the chosen sail there and leaves the others in outline, which makes overlaps legible. Nothing is written before “Save”.

Import a Sailchart

The editor’s “Import” button accepts:

  • .sail: the NavimetriX and SailGrib format;
  • .txt: a table of the same structure, like Expedition’s;
  • .se: an Adrena Sailect crossover. A Sailect crossover is a set of files, one per sail: select them all at once. The app rebuilds a single Sailchart, places the bands on the real boundaries drawn by the sailmaker and takes up each sail’s code and colour; where two zones overlap, the cell gets a main sail and an alternate. Headsails, spinnakers and the mainsail (with its reefs) are each rebuilt in their own layer; the mainsail appears under the “Mainsail” tab.

The import replaces the grid shown; save to keep it.

Library, export and deletion

  • “To library” files a copy of the Sailchart under the name of your choice in the “Sailchart library”, from where it can be attached to any polar. When you delete a polar, NavimetriX also offers to keep its Sailchart there.
  • “Export” (“Share” on phone and tablet) offers two formats: “NavimetriX format (with alternates)” and “Compatible format (primary sail only)”, for software that reads only one sail per cell. On computer, the file goes to your Downloads folder. NavimetriX reads Adrena crossovers but does not write them.
  • “Delete” returns the polar to the no-Sailchart state, after confirmation.

The Sailchart follows its polar, including in synchronisation between your devices.

See also

↑ Contents

8.5 Lost sail

Expert

The essentials

A torn sail changes the polar: in the zones where you carried it, the boat will be slower with the sails that remain. “Lost sail…” creates a copy of the polar that takes this into account, and selects it. Your original polar is never modified.

This function requires a Sailchart: it is what says where you carried each sail (see Sailchart).

  1. Open the “Polars” window (Settings, “My Boat”, “Polar” row).
  2. Open the polar’s “⋮” menu, then “Lost sail…”.
  3. Tap the lost sail in the row of dots.
  4. Set the “Keep” slider: the share of speed you keep in this sail’s zones.
  5. Tap “Apply”.

Lost sail: choice of sail, Keep slider, affected zones on the SailchartLost sail: choice of sail, Keep slider, affected zones on the Sailchart

Going further

The preview

As soon as you choose a sail, the window shows on the Sailchart the zones affected, and summarises: the number of Sailchart cells and polar points concerned, and the sails that take over these zones.

The “Keep” slider

It goes from 40 to 100%, in steps of 5%, and is 90% by default. In the cells where the lost sail was the main sail, the polar’s speeds are multiplied by this percentage. Elsewhere, the polar does not change.

What is created

  • A new polar, filed in “My polars” and named after the original, for example “sunfast3200 (without S2).pol”. It becomes the selected polar.
  • Its Sailchart, adjusted: in the cells where the lost sail was the main sail, the cell’s alternate takes its place if it had one, otherwise the sail of the neighbouring cell. In the cells where it was only an alternate, it is simply removed.

Once the sail is repaired or replaced, select the original polar again in the “Polars” window.

If the polar has no Sailchart, the window says so and invites you to create one first through the “⋮” menu, “Sailchart…”.

See also

↑ Contents

8.6 Polar efficiency and wind thresholds

Expert

The essentials

A theoretical polar is often optimistic: it describes a well-tuned boat, with a trained crew, on flat sea. The efficiencies correct this without touching the polar: they are percentages applied to the polar’s speeds during routing. They are used only by weather routing.

  1. Open Settings, then “My Boat”. Under the “Polar” row, check the “Light wind threshold” (10 knots by default) and the “Strong wind threshold” (20 knots by default).
  2. Open Settings, then “Routing”. Under the “Polar” row, set the “Speed scale under … knots” (80% by default) and the “Speed scale over … knots” (90% by default). Their label repeats your two thresholds.
  3. If you reduce sail at night, also set the “Speed scale at night” (100% by default).

Going further

The settings

SettingWhereValuesDefault
“Light wind threshold”“My Boat”, under the polar0 to 30 knots10 knots
“Strong wind threshold”“My Boat”, under the polar5 to 50 knots20 knots
“Speed scale under … knots”“Routing”60 to 160%80%
“Speed scale over … knots”“Routing”60 to 160%90%
“Speed scale at night”“Routing”60 to 160%100%
“Minimum upwind angle”“Routing”0 to 70°45°
“Maximum downwind angle”“Routing”130 to 180°165°

The thresholds are stored with the polar because they describe the boat; the efficiencies, with the routing.

How the efficiency is calculated

  • Below the light wind threshold, the polar’s speed is multiplied by the “under” efficiency.
  • Above the strong wind threshold, by the “over” efficiency.
  • Between the two thresholds, the efficiency moves in a straight line from one to the other. By default, the efficiency is 80% up to 10 knots of wind, 90% from 20 knots, and it progresses in a straight line between the two: 85% at 15 knots. For example, at 12 knots: 80% + (12 − 10) ÷ (20 − 10) × (90% − 80%) = 82%. The thresholds and the efficiencies can be set (thresholds in Settings > “My Boat”).
  • If you set the strong threshold equal to the light threshold (the app does not allow setting it below), the efficiency switches from one to the other at once, with no transition.
  • At night, the night efficiency is multiplied with the previous one. Night here is nautical night, between nautical dusk and dawn, calculated for the position and time of each point of the routing. At 100%, it has no effect.

Other coefficients are added in some cases, always by multiplication: the slow zones’ speed factor (see ZOIs (zones of interest)) and the “Polar crossed sea efficiency” (see Routing settings).

The limit angles

Here again, theoretical polars are often optimistic. Example: the theoretical polar of a Sun Fast 3200 gives an optimal VMG angle close to 36° in 12 knots of wind (VMG is the speed made good along the wind axis). In practice, on flat sea offshore, this boat points on average at about 45°. So 45° is what you should enter as the minimum angle to the wind.

  • “Minimum upwind angle” cuts the polar below this angle: the routing does not make the boat point closer to the wind. Useful when the polar promises an upwind heading your boat cannot hold.
  • “Maximum downwind angle” prevents the routing from sailing deeper than this angle. It is mostly a matter of safety: offshore, you do not want to sail too deep (by default, not beyond a wind angle of 165°), to avoid gybes, especially under autopilot.

Setting your efficiencies

My Boat: the polar and the light wind and strong wind thresholdsMy Boat: the polar and the light wind and strong wind thresholds

Compare your real speeds with those of the polar, in light wind then in strong wind, and enter the average difference in the two efficiencies. Place the thresholds where your boat’s behaviour really changes: a light boat may leave its light-air regime earlier, a heavy boat later. The full method is described in Understand and choose your polar.

See also

↑ Contents

↑ Contents

9 Weather routing

Weather routing calculates the fastest route between two points from the wind, current and wave forecasts and your boat’s polar, under the routing constraints: wind limits, wave limits, no-go zones (ZOIs, zones of interest) and, with C-MAP charts, water depth under the keel and cardinal marks. This chapter explains the principle of isochrones, how to start a routing from the Routing window or directly from the chart, all its settings, coastal routing with C-MAP charts, the search for the best start, multi-GRIB routing and ensemble routing. It finally shows how to read a routing, get its AI briefing, and manage and study your routings.

9.1 Routing principles and isochrones

Beginner

The essentials

Weather routing looks for the fastest route between a start and a finish. It combines the wind forecast by a GRIB file (a weather forecast file), your boat’s polar (its speed according to the wind strength and the angle at which it receives it) and, if you choose them, current and sea state.

The calculation advances by isochrones. An isochrone (“same time”) is a line joining all the positions the boat can reach after the same amount of time. The routing chains them step by step to the finish: the optimal route follows from them.

To see a routing’s isochrones:

  1. Tap the round layers button, at the bottom right of the chart, and tick “Isochrones” in the “Display” section.
  2. Open the left drawer, “Routings” tab.
  3. Tap (or click) the routing you want: an orange bar appears on its left and its isochrones are displayed on the chart.
  4. Tap it again to hide them.

The “Isochrones” checkbox in the “Display” section of the layers menuThe “Isochrones” checkbox in the “Display” section of the layers menu

Isochrones are displayed for only one routing at a time, the selected one. A routing that has just finished is selected automatically and the “Routings” tab opens.

Going further

How the calculation advances

NavimetriX uses the isochrone method: at each time step, the app draws the curve of the positions the boat can reach after the same amount of time, starting from the start.

The calculation respects your settings: polar efficiencies, upwind and downwind angles, tack, gybe and sail change penalties, engine, no-go zones and slow zones, wind and wave limits and, with a C-MAP chart, shallows and buoyage. All these settings are described in Routing settings and Coastal routing with C-MAP charts.

During the calculation

The isochrones appear on the chart as the calculation proceeds. The chart follows the isochrone front and the timeline advances with it, at most twice a second. At the top of the chart, the “Cancel routing” button stops the calculation. Under this button, a label says what the routing is doing when nothing is moving yet on the chart: “Initializing the routing…”, “Preparing the C-MAP charts…” (with a percentage) or “Polishing the route…”.

At the end, a window gives the result, for example “Reached destination”, or the reason for stopping.

What the isochrones show

  • The isochrones are drawn in blue.
  • On each isochrone, a blue dot marks the point through which the best route passes. If the route does not pass through it, it is the point closest to the finish, in distance over water. These points serve as pivot points to test another route option: see Study your routing and pivot points.
  • Where the route crosses an isochrone, and at the start, the finish, the waypoints and the tacks and gybes, a dot and a wind barb mark the route. How to read them is detailed in Read a routing.

The isochrone step

The step is the time between two isochrones. It is set in the right drawer “Settings”, “Routing” section, “Isochrone duration” row: “auto” by default, or a fixed value from 5 to 360 minutes, in steps of 5 minutes.

In auto mode, the step is short at the start and lengthens along the passage:

Time since the startStep at most
First hour20 min
Up to 24 h1 h
Up to 48 h1 h 30
Up to 72 h2 h
Up to 5 days3 h
Beyond6 h

The step is also shortened on short route legs. For a routing from a pivot point, the count restarts from the pivot point. We strongly advise keeping auto mode: reducing the isochrone time step does not necessarily calculate a better routing. A fixed step that is too short can stop the calculation with the message “Routing calculation stopped as it reached the maximum number of isochrones before the destination. Set the isochrone duration to auto.”

Routing duration

The “Maximum duration” setting (“Routing” section of the settings) limits the duration covered by the routing, from 1 to 30 days (30 by default). The routing also stops at the end of the GRIB file’s forecasts.

Without a Premium subscription, a routing covers at most 2 days. Beyond that, the calculation stops with the message “Routing calculation stopped as we reached the routing max duration of 2 days for non Premium users”.

When the calculation stops before the finish

The end message gives the cause. The most frequent:

  • “the boats left the area covered by the wind GRIB”: download a GRIB that covers the whole route;
  • “the most recent isochrone is empty”: most often the route passes too close to land or to a constraint; modify the route or relax the wind and wave limits;
  • “there is not enough wind to sail and the motor is disabled”: allow the engine or change the start time;
  • “every way forward is blocked by land”, “by no-go zones” or “by shallows or restricted areas of the C-MAP chart”;
  • “we reached the end of the weather forecast”.

If a mandatory waypoint is on land, the app flags it and recentres the chart on that point when you close the message, so that you can move it.

See also

↑ Contents

9.2 Start a routing

Beginner

The essentials

A routing is calculated on a route (at least a start and a finish) with a wind GRIB file downloaded to the device. The polar used is the one chosen in “Settings”, “My Boat”.

  1. Tap the “+” button at the bottom right of the chart, then “Calculate Routing”. The “Routing” window opens.
  2. In “Models”, choose the “Wind” GRIB. If you wish, add a “Current” GRIB and a “Waves” GRIB.
  3. In “Start”, set the start date and time, or tap “Now”.
  4. In “Route”, choose the route to follow.
  5. Tap “Calc Routing”.

The isochrones are drawn on the chart during the calculation. At the end, the routing is displayed and the “Routings” tab of the left drawer opens.

The Routing window: weather files, start and routeThe Routing window: weather files, start and route

If something is missing, the window does not open and a message says so: “Please download a GRIB file with wind forecast data before launching a routing.” or “Please create a route before launching a routing.”

Going further

The other ways to open the window

  • From a route on the chart: tap (or click) a segment or a point of the route, then choose “Calculate routing” in its menu. The window opens with that route already chosen.
  • From a POI: “Route to this POI”, in the POI’s menu, opens the window on a route from the boat to the POI. See Routings started from the chart.

Models: wind, current, waves

Each list offers only the GRIBs downloaded on this device that cover at least part of the route: a waypoint inside the GRIB’s area, or a segment that crosses it. When you start from the boat’s position, that position counts too.

  • Wind (required). On opening, the window chooses the GRIB displayed on the chart, if it contains wind. On the right, a percentage applies to the GRIB’s wind speed, from 80 to 150% (100% by default). Above 100%, the routing counts more wind than the file forecasts, which is useful if you find the model too weak.
  • Several wind GRIBs: the small “+” under the “Wind” row adds a row for a second model, and so on as long as other wind GRIBs are available; the “−” removes a row. Each row has its own percentage. How it works is detailed in Multi-GRIB routing.
  • Current: “None”, “SHOM atlases” (the tidal current atlases) or a current GRIB. The percentage, from 80 to 150%, applies to the current speed.
  • Waves: “None” or a sea state GRIB. Waves are used for the height limits and the crossed sea set in Routing settings.

If the chosen wind GRIB is an ensemble GRIB, only one wind row remains possible and the bottom button becomes “Calculate ensemble routings”.

When the calculation starts, if the wind GRIB shown on the map is not the first wind GRIB of the routing, the display moves to it: you watch the wind the routing is computed with. A current or sea state GRIB on screen, or a map with no GRIB, is left alone.

To get started, route with wind alone first, then add current and waves if the area warrants it.

Start at a given date

The date and time are set in the two fields under “Start”; the “Now” button enters the current time. They are expressed in the time zone chosen in “Settings”, “General”, “Time zone” (UTC or local time).

The window remembers the last chosen date for 36 hours, as long as that start is in the future (or if you changed it less than 30 minutes ago). Otherwise, it starts again from the current time.

The start must fall within the period covered by the wind GRIB, and the first point of the route within its area. Otherwise a message gives the file’s forecast period, or the out-of-area position, and the calculation does not start.

Start now, from the boat

The “Now from my position” switch appears only when the app receives a real position of the boat (the device’s GPS or NMEA, usually in Navigation mode). An approximate position derived from the IP address is not enough.

When you turn it on:

  • the date and time disappear: the start is the time of launch;
  • the route the boat is following is chosen, if it is in the list;
  • a “Next Waypoint” row appears. It offers the waypoint the boat is heading for; change it if you have already passed some points.

The routing then starts from the boat’s position and joins the route at that waypoint, ignoring the previous points. This is how to redo a routing at sea, after a deviation from the route or the arrival of a new GRIB run. If the position disappears in the meantime, the message “Cannot start routing: boat position is not available” is displayed.

Best start

The “Best start” switch tries several start times and keeps the fastest. Its “Window” and “Step” settings are described in Best start.

Route

The “Route” list offers the routes visible on the chart. A hidden route (eye closed in the “Routes” tab) does not appear there, unless no route is visible: the first route is then offered. To create or edit a route, see Create and edit a route.

Route marks to be left to port or to starboard are rounded like gates. If a mark sits in a sharp turn (55° or less between the two segments), the app offers before the calculation to turn it into a waypoint: see Coastal routing with C-MAP charts.

Other settings

The “Other settings” row, at the bottom of the window, opens the routing settings (polar, efficiencies, penalties, engine, limits…) without leaving the window. They are the same as in “Settings”, “Routing”: see Routing settings.

During and after the calculation

  • Only one routing is calculated at a time.
  • The “Cancel routing” button, at the top of the chart, stops the calculation.
  • A current or wave file that cannot be found on the device does not prevent the calculation: a message says the routing is calculated without current or without waves.
  • If the polar cannot be read, a message invites you to choose another in “Settings”, “My Boat”.
  • Without a Premium subscription, the routing covers at most 2 days.
  • In the browser version, the first routing first downloads the “Coastal data for routing (one-time download)”.

How the calculation works and how to read the isochrones are described in Routing principles and isochrones.

See also

↑ Contents

9.3 Routing settings

Expert

The essentials

The routing settings adjust the calculation to your boat and to the way you sail. They are in two places, which show the same values:

  • in the right drawer “Settings”, “Routing” section;
  • in the “Routing” window, “Other settings” row.

They are shared between the devices of your account. The default values are fine for a first routing. The three settings that change the result the most are the polar efficiencies, the minimum upwind angle and the manoeuvre penalties.

The “Routing” section of the settings drawerThe “Routing” section of the settings drawer

In percentage fields, a value below 100% is shown in red and a value above in green.

The wind, current and wave GRIBs, and their percentages, are not here: they are chosen in the “Routing” window (see Start a routing).

Going further

Polar and efficiencies

SettingValuesDefault
“Polar”a polar from the library or importedsunfast3200.pol
“Speed scale under 10 knots”60 to 160%80%
“Speed scale over 20 knots”60 to 160%90%
“Speed scale at night”60 to 160%100%
“Minimum upwind angle”0 to 70°45°
“Maximum downwind angle”130 to 180°165°
  • Polar: the same as in “Settings”, “My Boat”. To choose or create it, see Polars and Sailchart.
  • Efficiencies (the “Speed scale” rows): most polars are theoretical and optimistic. The efficiency multiplies the polar’s speeds. The first applies below the light wind threshold, the second above the strong wind threshold; between the two, the app moves from one to the other in proportion to the wind. The two thresholds (10 and 20 knots by default) are set in “My Boat”, under the polar (“Light wind threshold”, “Strong wind threshold”), and the row labels follow their values.
  • Night efficiency: during nautical night, from nautical dusk to nautical dawn, it is multiplied with the efficiency above. Night is calculated for the position and time of each point of the routing. Useful if you reduce sail at night. Efficiencies combine by multiplication: wind-based efficiency × night efficiency × slow-zone factor. For example, with an efficiency of 90% and a night efficiency of 90%, at night the efficiency is 90% × 90% = 81%.
  • Minimum upwind angle: the routing does not make the boat point closer to the wind than this angle, even if the polar allows it. Count on 40° with a full crew and 45° when singlehanded or cruising.
  • Maximum downwind angle: the routing does not make the boat sail deeper than this angle, to avoid dead downwind and accidental gybes.

Isochrones and duration

SettingValuesDefault
“Isochrone duration”auto, or 5 to 360 min in steps of 5auto
“Maximum duration”1 to 30 days30 days

The auto step mode is detailed in Routing principles and isochrones. Without a Premium subscription, the duration of a routing is limited to 2 days, whatever this setting.

Manoeuvre penalties

SettingValuesDefault
“Tack penalty”0 to 600 s, in steps of 530 s
“Gybe penalty”0 to 600 s, in steps of 530 s
“Sail change penalty”0 to 600 s, in steps of 10120 s

A penalty is the time lost by a manoeuvre: during this time, the boat does not advance along its route (it keeps drifting with the current). Without a penalty, the router would tack as soon as the gain is positive, however small; with a penalty, it prefers fewer, longer boards. Enter the real time it takes you, crew included, to manoeuvre and regain speed.

The sail change penalty only applies if your polar has a Sailchart (the table that says which sail to carry according to the wind): without it, the routing does not know the sails. It is added to that of a tack or gybe made at the same time. Staying within a band where the sail carried is still allowed does not count as a change.

Engine

SettingValuesDefault
“Allow engine use”yes or nono
“Start engine under”0 to 30 knots, in steps of 0.13.0 knots
“Motoring speed”0 to 30 knots, in steps of 0.16.0 knots

With the engine allowed, the routing starts the engine where the sailing speed falls below the threshold, and the boat then moves at the motoring speed. The engine is used only to head for the finish: within 45° of the shortest path over water. Legs under engine are shown dotted on the chart. Without the engine, a calm can stop the calculation (“there is not enough wind to sail and the motor is disabled”).

Zones

SettingDefault
“Avoid no go zones”no
“Slow boat in slow zones”no

These zones are ZOIs (zones of interest) that you draw on the chart. In a ZOI’s window, the “Zone Type” is “Information”, “No-Go Zone” or “Slow Zone”.

  • A no-go zone (traffic separation scheme, wind farm…) is avoided by the routing when the first setting is on.
  • A slow zone carries a “Speed Factor (0.0 - 2.0)” that multiplies the boat’s speed inside it, when the second setting is on. A factor above 1 speeds the boat up. This factor is multiplied with the efficiencies described above. If two slow zones overlap, only the first counts.

To create ZOIs, see ZOIs (zones of interest). The settings that follow in this block (shallows, under-keel clearance, tide, distance to dangers, restricted areas, cardinals) require a C-MAP chart: they are described in Coastal routing with C-MAP charts.

Constant wind

SettingValuesDefault
“Constant wind”yes or nono
“Constant wind speed”0 to 100 knots12 knots
“Constant wind direction”0 to 359°, in steps of 5180°

Constant wind replaces the GRIB wind everywhere with a fixed wind, for example the one you read on the anemometer and wind vane. It is used to study the effect of current in a bay or a race. A wind GRIB is not required. If a wind GRIB is selected, the start must nevertheless be within its area and period.

Current

Current is chosen in the “Routing” window, “Current” row: “None”, “SHOM atlases” or a current GRIB, with a percentage from 80 to 150% applied to its speed.

Wind and wave limits

SettingValuesDefault
“Heave to over limit”yes or nono
“Upwind max wind speed”15 to 100 knots60 knots
“Downwind max wind speed”15 to 100 knots60 knots
“Waves max height”0 to 30 m, in steps of 0.56.0 m
  • The upwind limit applies to a wind received less than 90° from the bow, the downwind limit beyond 90°.
  • The wave height is that of the total sea (significant height). It only applies if a wave GRIB is chosen in the “Routing” window.
  • By default, the routing avoids places where a limit is exceeded. If the whole area ahead of the boat exceeds them, the calculation stops (“the wind is above the maximum wind set in the routing settings everywhere ahead”).
  • With “Heave to over limit”, the boat stops (zero speed) while the wind drops back below the limit, instead of making a long detour. On a long passage, a few hours hove to are often better than a detour of several days.

Do not overuse limits: set too low, they prevent the routing from succeeding.

Crossed sea

SettingValuesDefault
“Waves min height for crossed sea”0 to 5 m, in steps of 0.52.0 m
“Polar crossed sea efficiency”0 to 100%75%

There is crossed sea when the wind sea and the swell both exceed the minimum height and their directions are between 45° and 135° apart. The boat’s speed, under sail or engine, is then multiplied by the crossed sea efficiency.

You need a wave GRIB that gives wind sea and swell separately (GFS Wave, MFWAM, Copernicus, DMI WAM). With a file that gives only the total sea, such as ECMWF Wave or IFREMER’s WW3, there is never crossed sea.

Reset

The “Reset routing parameters to default” button, at the bottom of the section, returns this page’s settings to their factory values. Note that it also sets the maximum duration to 16 days and the wind percentage of the “Routing” window to 115%, and turns off current and waves. The C-MAP settings are not touched.

See also

↑ Contents

9.4 Coastal routing with C-MAP charts

Expert

The essentials

Warning: the skipper, as master of the vessel, remains solely responsible for their navigation. Routing is only an aid. Check your route, then check it again, before setting off. Never rely on a routing without having checked it yourself on the chart.

With a C-MAP chart (DISCOVER X or REVEAL X), the routing reads the chart: it goes only where your boat floats, keeps its distance from dangers and respects the buoyage. The options are in “Settings”, “Routing” section, in the zones block.

  1. Enter your boat’s “Draft” in “Settings”, “My Boat” (2.00 m by default).
  2. In “Settings”, “Routing”, turn on “Avoid shallow waters (C-MAP)”.
  3. Check the “Under-keel clearance” and the “Min distance to dangers”.
  4. Leave “Use the tide for the depth”, “Avoid restricted areas (C-MAP)” and “Pass cardinals on the right side (C-MAP)” on.
  5. Start the routing as usual (see Start a routing).

Before the isochrones, the “Preparing the C-MAP charts…” label shows a percentage: the app is preparing the depths of the route’s area.

A routing from La Trinité to Cherbourg with “Avoid shallow waters (C-MAP)”: Raz de Sein, Pointe Saint-Mathieu and the Chenal du FourA routing from La Trinité to Cherbourg with “Avoid shallow waters (C-MAP)”: Raz de Sein, Pointe Saint-Mathieu and the Chenal du Four

These options exist only on devices where C-MAP is available: iPhone and iPad, Android, macOS, Windows and Linux, not in the browser version. On iPhone and iPad, the “Enable C-MAP” switch in the iOS Settings app must be on. To buy a chart and download your zones, see C-MAP charts: purchase, account and zones.

Going further

The settings

SettingValuesDefault
“Avoid shallow waters (C-MAP)”yes or nono
“Under-keel clearance”0 to 5.0 m, in steps of 0.10.5 m
“Use the tide for the depth”yes or noyes
“Min distance to dangers”0 to 500 m, in steps of 1030 m
“Avoid restricted areas (C-MAP)”yes or noyes
“Pass cardinals on the right side (C-MAP)”yes or noyes

The other five settings affect the calculation only if “Avoid shallow waters (C-MAP)” is on. The distance to dangers is shown in your short-distance unit.

The C-MAP coastal routing settings: shallow waters, tide, restricted areas and cardinal marksThe C-MAP coastal routing settings: shallow waters, tide, restricted areas and cardinal marks

Avoid shallows

The router reads land, depth areas, rocks, wrecks and obstructions from the C-MAP chart. A route segment is accepted only if the depth found along its whole length is at least equal to the draft plus the under-keel clearance. The chart is read finely near coasts, banks and ports, and more coarsely offshore, where there is water everywhere.

The minimum distance to dangers widens this caution: nothing within this distance of a segment may be shallower than the boat needs. Near a waypoint of your route (a departure port, a finish set against the coast), the chart is read without this margin, over twice the chosen distance, otherwise the route could never leave or enter it.

The tide in the depth

The chart’s soundings are given relative to chart datum. With “Use the tide for the depth”, the router adds to the sounding the lowest water height forecast during the leg, at the nearest tide station. A passage that dries at low water can thus be used at mid-tide.

  • The tide is taken into account over the first 5 days of the routing at most; beyond that, the sounding is taken as is.
  • If no tide station is close enough, the sounding is taken as is.

Not counting the tide is always on the safe side.

Restricted areas

With “Avoid restricted areas (C-MAP)”, the chart areas where entry is prohibited, restricted or to be avoided (wind farms, firing areas…) are treated like land.

Cardinals, isolated dangers and lateral buoyage

With “Pass cardinals on the right side (C-MAP)”, the router adds to the chart’s dangers:

  • a 0.2 NM band on the danger side of each cardinal mark;
  • a 0.1 NM circle around each isolated danger mark;
  • a 0.1 NM band on the outer side of lateral marks, where the chart gives the direction of buoyage, and the edges of buoyed channels, which link marks on the same side.

Channel edges do not count within one mile of a waypoint of your route: a port at the edge of a channel must be able to be left or reached by crossing it.

Course marks become gates

This applies with or without a C-MAP chart. In a route, a point can be “Pass through this point”, “Leave to port” or “Leave to starboard” (see Create and edit a route).

A mark to be left to port or to starboard does not pull the route onto itself: it becomes a gate, a half-line starting from the mark on the side where you must pass. The route must cross all the gates, in order and on the correct side, and can round the mark as widely as the wind requires.

Sharp turn: rounding a mark caught in a turn of 55° or less between the two segments makes the routing take a detour. At launch, the app flags it: “Sharp turn at … Rounding such a mark makes the routing take a detour. Turn it into a waypoint?”

  • “Pass through and calculate” turns the mark into a waypoint in the route, then starts the calculation.
  • “Keep and calculate” keeps the mark as it is.

A mark placed on a chart danger cannot become a waypoint: it remains a mark to be rounded, and the message says so.

When the chart could not be read

The router prepares the depths from your C-MAP zones and the C-MAP chart server. At the end of the calculation, if the chart could not be read over part of the route covered by your charts, the result window says so: “The C-MAP chart could not be read over … of the route. Over this portion, the route was NOT checked against depths and dangers.” It gives the cause:

  • the chart is one of yours but the zone is not downloaded on this device: download it, then restart the calculation;
  • the zone is downloaded but the chart server did not respond: restart the calculation.

In waters that are not part of your charts, nothing is flagged: the route is simply not checked against depths there.

Messages specific to coastal routing

  • “Routing impossible: the start (or the finish) is on land or in too little water for the draft on the C-MAP chart.”: move the point to deeper water.
  • “Routing impossible: no passage through the water was found between the start and the finish.”: place them in open water, or check the draft and the safety distance.
  • “Routing calculation stopped as every way forward is blocked by shallows or restricted areas of the C-MAP chart.”: reduce the distance to dangers, check the draft, or modify the route.

Limits

  • Ensemble routing never reads the C-MAP chart, even with these options on.
  • The final, polished route is also subject to these constraints.
  • Coastal routing does not replace lookout or reading the chart: it only knows what the chart contains.

The routing’s route report gives, leg by leg, the water depth, the water under the keel, the nearest danger and the tide: see Read a routing. To simply plot a safe path between waypoints, without weather, see C-MAP AutoRouting.

See also

↑ Contents

9.5 Routings started from the chart

Beginner

The essentials

When underway, you sometimes want to know right away how to get over there. Several entries start a routing from the boat, at the current time, without setting a date or a route:

  1. Switch to Navigation mode (“Navigation” switch at the top of the left drawer): the boat must have a position.
  2. Display on the chart a wind GRIB that covers the boat and the target point.
  3. Choose an entry:
    • on computer, right-click on the chart then “Route to this point”;
    • on all devices, “+” button then “Route to the target” (the target is by default the centre of the screen);
    • in a POI’s menu, “Route to this POI”.

The calculation uses the settings of your last routing: current, waves, polar, C-MAP options. If something is missing, a message says what.

The chart menu with “Route to this point” and the resulting routingThe chart menu with “Route to this point” and the resulting routing

Going further

Route to this point, to the target

“Route to this point” (right-click, computer) and “Route to the target” (“+” menu) start the calculation directly, without a window.

  • The point of “Route to this point” becomes a POI when the calculation starts. It carries the date and time of the click (for example “Oct 7, 09:22”, followed by “UTC” if the app is set to UTC) and has no icon: its name is enough to find it. The routing has the same name.
  • The target of “Route to the target” is that of the navigation tools: the centre of the screen by default, or the position fixed in its settings (see Navigation tools on the chart).
  • The wind GRIB is the one displayed on the chart. Failing that, it is that of the last routing, provided it is on this device.
  • The route is not saved in the list of routes: it lives in the routing, under a name starting with an arrow (“→Oct 7, 09:22”, or “→47°30N 3°05W” for the target).

What is checked before the calculation, with the message displayed if it is not the case:

ConditionMessage
Navigation mode on“A routing to a point starts from the boat, now. Turn on Navigation mode first.”
No other calculation in progress“A routing is already being calculated. Wait for it to finish, or stop it.”
Boat position known (live position or last position received; never the approximate position from the IP address)“The boat position is not known, so no routing can start from the boat.”
Point more than 0.1 NM from the boat“This point is less than 0.1 NM from the boat.”
A wind GRIB on the device“No wind GRIB to route with. …” or “The wind GRIB of the last routing is not on this device. …”
The boat and the point inside the GRIB’s area“The boat is outside the area of the … wind GRIB. …” or “This point is outside the area of the … wind GRIB. …”
The forecast covers the current time“The … forecast runs from … to …, not now. Download a more recent forecast, then route again.”

The best start search does not apply to these routings: they start now.

Route to this POI

“Route to this POI”, in a POI’s menu, goes through the “Routing” window:

  1. The app creates in the list of routes a two-point route, from the boat (“Start”) to the POI, named “→” followed by the POI’s name. If this route already exists, it is updated rather than duplicated.
  2. The “Routing” window opens on this route, with “Now from my position” on and the POI as “Next Waypoint”.
  3. Check the GRIBs and tap “Calc Routing”.

A boat position is required. If the app only has the last position received (the GPS link has dropped), the route starts from that position, at the time set in the window.

Calculate a routing from a route’s menu

Tap (or click) a route on the chart, then “Calculate routing” in its menu: the “Routing” window opens with that route chosen. What follows is described in Start a routing.

Route from a pivot point

To force a new routing through an isochrone point and compare two options, see Study your routing and pivot points.

Recalculate a routing

In the “Routings” tab, a routing’s ⋮ menu offers “Recalculate”. The entry is for when a more recent forecast is available:

  1. it takes the routing’s route (in its current state, if you have edited it since), its weather files and its start time;
  2. it downloads again the GRIBs for which a more recent run exists;
  3. it starts the calculation with your current settings.

A routing that started from the boat restarts from the current position, now. The differences from the original routing can then be read in the “Inputs” tab of the routing’s details (see Read a routing).

When recalculation is not possible, the entry is greyed out and the reason is written below it:

Reason shownMeaning
“a calculation is running”another calculation is running
“inputs not recorded”routing too old, its inputs were not kept
“ensemble routing”recalculation does not apply to ensemble routings
“route deleted”the routing’s route no longer exists
“no boat position”routing that started from the boat, with no current position
“several wind files”multi-GRIB routing, its files cannot be found again
“no weather file” or “wind file missing”the wind GRIB is no longer in the list
“start outside the weather file”the wind GRIB found does not cover the start
“no newer weather data”no more recent run exists
“start in the past”the start time has already passed
“start beyond the new run”the new run does not cover the start time

See also

↑ Contents

9.6 Best start

Expert

The essentials

Leaving a few hours earlier or later can shorten a passage significantly. The best start search calculates the same routing for several start times and keeps the fastest.

  1. Open the “Routing” window (“+” button, “Calculate Routing”) and set your GRIBs and your route as usual.
  2. In “Start”, set the date and time of the first start to try.
  3. Turn on “Best start”.
  4. Set the “Window” (over how many hours to search) and the “Step” (the interval between two starts tried).
  5. Tap “Calc Routing”.

At the end, the fastest routing is displayed on the chart and a table compares all the starts tried.

The “Best start” window at the end of the search: the fastest passage at the top, then the table of starts tried with the fastest in boldThe “Best start” window at the end of the search: the fastest passage at the top, then the table of starts tried with the fastest in bold

Going further

The settings

SettingValuesDefault
“Best start”yes or nono
“Window”1 to 120 h24 h
“Step”15 to 360 min, in steps of 1560 min

“Best start” runs a complete routing for each possible start time, from the chosen time to that time plus the window, every “Step”. By default, that makes 25 routings (24 hours, one per hour, both ends included: from the chosen time to the same time the next day). The number of starts is limited to 200; beyond that, the end of the window is not tried.

The switch stays in the position you chose for the following routings: remember to turn it off to return to a simple routing.

With “Now from my position”, the first start is the current time and each trial starts from the boat’s position.

Each start is calculated without being displayed. A panel, at the bottom right, tracks progress:

  • “Best start”;
  • “Start 3/25” followed by the date and time of the start in progress;
  • a progress bar;
  • the number of starts completed and the fastest passage found so far (“fastest so far …”).

The “Cancel routing” button, at the top of the chart, stops the search: the message “Best start search cancelled” is displayed and no routing is kept.

The search takes roughly the time of one routing multiplied by the number of starts: widen the step for a first search, then narrow it around the best slot.

The result

When all the starts are calculated, the fastest becomes the saved routing, with no new calculation, and the “Best start” window opens:

  • at the top, “Fastest passage: leave …, … under way”;
  • a table with one row per start tried: “Start”, “Passage” (the duration), “Arrival” and “Distance”;
  • the fastest row is highlighted, and the table opens centred on it;
  • a start whose routing does not reach the finish shows “—” and “not reached”.

If no start in the window reaches the destination, only the message “Best start: no start in the window reaches the destination” is displayed.

What is not covered

The search does not apply:

  • to a routing from a pivot point, which necessarily starts at the time of its point;
  • to “Route to this point” and “Route to the target” routings, and to the recalculation of a routing to a point, which start now.

Each start must fall within the wind GRIB’s period. If the window goes past the end of the forecast, the last starts do not reach the finish.

See also

↑ Contents

9.7 Multi-GRIB routing

Expert

The essentials

Multi-GRIB routing combines several wind files in a single routing: a fine model for the start, a long-range model for the rest.

To start one, tap the small “+” under the “Wind” row of the “Routing” window and choose a second wind GRIB.

Going further

How the app chooses the file

With several wind GRIBs, the app chooses, for each point and each moment of the calculation, the best file that covers that point at that moment, according to three criteria, in this order:

  1. the finest grid (a 0.025° GRIB takes precedence over a 0.25° GRIB);
  2. with equal grids, the most recent run;
  3. with equal runs, the most recently downloaded file.

The models are therefore not blended but chained: when the boat leaves the area or period of the fine model, the calculation switches to the next one. The order of the rows in the window does not matter. Each row has its own wind percentage.

Example: a passage from Lorient to A Coruña with AROME 0.025° for the start and ARPEGE or ICON Europe for the rest, once AROME reaches the end of its forecast range. A single routing replaces two successive routings.

If only the first GRIB seems to be used, it is often because both files cover the same area and the same period: the finer one then wins everywhere. Multi-GRIB is useful when the files complement each other, in area or in duration.

When the routing uses several models, the “Wind Model” column of the routing table shows which one was used for each leg (see Read a routing). A multi-GRIB routing cannot be recalculated with “Recalculate”.

See also

↑ Contents

9.8 Ensemble routing

Expert

The essentials

Ensemble routing starts from an ensemble model, which provides several weather scenarios calculated from slightly different starting conditions. NavimetriX calculates one optimal route per scenario and overlays them: when the routes tighten, the forecast is reliable; when they spread apart, it is uncertain.

“Routing” window with a GEFS 0.50° GRIB chosen as wind: the bottom button becomes “Calculate ensemble routings”“Routing” window with a GEFS 0.50° GRIB chosen as wind: the bottom button becomes “Calculate ensemble routings”

For an ensemble routing:

  1. Download a GRIB from an ensemble model: GEFS 0.50° (a control run and 30 members) or ECMWF IFS ENS 0.25° (a control run and 50 members). These models require the Premium subscription.
  2. Open the “Routing” window and choose this GRIB as the wind. The bottom button becomes “Calculate ensemble routings”.
  3. Set the start and the route as usual, then start the calculation. An Internet connection is required: each member is downloaded during the calculation.

Completed GEFS ensemble routing on a passage from La Rochelle to the Azores: the routes of the 31 members in colour, the members’ dots at the timeline’s time, and the green confidence corridor, and the Routings tab with the “(Ensemble)” row and “31/31 routings”Completed GEFS ensemble routing on a passage from La Rochelle to the Azores: the routes of the 31 members in colour, the members’ dots at the timeline’s time, and the green confidence corridor, and the Routings tab with the “(Ensemble)” row and “31/31 routings”

Going further

How an ensemble routing proceeds

  1. The app downloads the control run over the area and forecast times of your GRIB, then calculates its optimal route. This is the main routing.
  2. It downloads then calculates each member, one by one.
  3. The routes appear on the chart as they are done.

A panel, at the bottom right, tracks progress: “Control run” or “Member 12/30”, the two steps “Download” and “Calculate” with their progress, an overall bar and the number of members “completed”. At the end, a message gives the number of routes calculated.

Ensemble routing in progress: the routes of the first members overlay on the chart, and the bottom right panel shows “Member 16/30” with the “Download” and “Calculate” stepsEnsemble routing in progress: the routes of the first members overlay on the chart, and the bottom right panel shows “Member 16/30” with the “Download” and “Calculate” steps

Ensemble routing finished: the members’ routes cover the passage, and a message announces “Ensemble routing complete: 30 member routes calculated.”; the Routings tab shows the “(Ensemble)” row with “31/31 routings”Ensemble routing finished: the members’ routes cover the passage, and a message announces “Ensemble routing complete: 30 member routes calculated.”; the Routings tab shows the “(Ensemble)” row with “31/31 routings”

The “Cancel routing” button, at the top of the chart, stops everything and deletes the ensemble routing in progress (“Ensemble routing cancelled.”).

During the calculation, the app unticks the “Isochrones” checkbox in the layers menu to lighten the display: tick it again afterwards if you want to see isochrones again.

Particularities of the ensemble calculation:

  • it does not read the C-MAP chart, even if the coastal routing options are on;
  • the route is not polished (see Routing principles and isochrones);
  • only one wind row is possible: no multi-GRIB with an ensemble model (see Multi-GRIB routing);
  • an ensemble routing cannot be recalculated with “Recalculate”.

Read the result on the chart

  • The “spaghetti”: each member is drawn in its own colour, the colours being spread around the whole colour wheel. Tight routes: the optimal route passes through the same place whatever the scenario. Spread routes: it depends strongly on how the weather actually evolves. Two distinct bundles: two scenarios, two strategies.
  • The positions: a dot in each member’s colour shows where the boat would be at the timeline’s time. Scroll through time to see the routes diverge.
  • The confidence corridor: a semi-transparent green band covers the standard deviation on either side of the mean route (about two routes in three pass through it). Before this calculation, the 20% of members furthest from the mean are discarded, so that an extreme scenario does not distort the corridor. The corridor appears only once the calculation is finished, with at least three members. Over a GRIB displayed in colour, its transparency makes it hard to see: untick “Color map” in the layers menu to make it stand out.

In the “Routings” tab, the routing’s name is followed by “(Ensemble)”, and a row gives the number of routings (for example “31/31 routings”) with the shortest and longest durations.

The Ensemble tab of the details

The routing’s ⋮ menu, “Details”, opens the routing’s details, with an “Ensemble” tab reserved for this type of routing:

  • “Ensemble Summary”: the number of “Members”, the share that reached the finish (“Reached Finish”) and the state of the “Control Run” (“Finished”, or its distance to the finish).
  • A histogram: the “Sailing Duration Distribution” when more than half of the members arrive, with the earliest and latest arrival times; otherwise the “Distance to Finish Distribution”.
  • “Key Statistics”: distance covered (DFS), mean speed over ground (SOG), duration (min, max, mean, median, standard deviation), earliest and latest ETA, duration of the control run against the ensemble mean, remaining distance to the finish (DTF).
  • “Wind Conditions”: mean wind, maximum wind, and mean of the members’ maximum winds.

If the control run is clearly faster than the ensemble mean, the “ideal” forecast is probably optimistic. If a good share of the members do not arrive, it is a warning sign.

See also

↑ Contents

9.9 Read a routing

Beginner

The essentials

A finished routing is displayed on the chart, in its colour, and is found in the “Routings” tab of the left drawer.

  1. Select it by tapping it in the “Routings” tab: an orange bar appears on its left.
  2. Follow the boat along the route by dragging the timeline, or tap the route directly where you want: the timeline moves to the time when the boat passes there. The play button, at the start of the timeline, makes time run by itself.
  3. Read the values bar, at the top of the chart: wind, boat speed and heading at the timeline’s time, in the routing’s colour.
  4. Tap a value in the bar to display its graph over the whole duration of the routing; tap it again to close it.
  5. To see everything, open the routing’s ⋮ menu in the “Routings” tab, then “Details”.

A routing displayed on the chart, with the routing values bar at the topA routing displayed on the chart, with the routing values bar at the top

Going further

On the chart

  • The optimal route is drawn in the routing’s colour.
  • Where it crosses an isochrone, and at the start, the finish, the waypoints and the tacks and gybes, a dot and a wind barb of the same colour mark it. The barb gives the wind used by the calculation on the leg that follows: its strength and direction, averaged over the isochrone step. If the routing takes current into account, a black arrow also gives the current. With no isochrones displayed, all the points of the route are marked. The “Wind” and “Current” settings and the density, under the colour legend, choose what is marked (see below).
  • Legs made under engine are dotted.
  • The eye, to the right of each routing in the “Routings” tab, shows or hides it on the chart.

Colours: by routing, by sail, by speed

At the top of the “Routings” tab, the “Colour” selector offers three readings, valid for all routings:

  • “Routing”: each routing in its own colour, that of its name in the list (default);
  • “Sail”: each leg in the colour of the sail carried. A legend recalls the code of each sail, with a grey gear-shaped dot for the engine. The routing’s polar must have a Sailchart; otherwise the legend says “No Sailchart on the selected polar”;
  • “Speed”: a gradient from blue (“slow”) to yellow (“fast”), on the scale specific to each routing.

The choice is shared between your devices. The sail set is saved with each routing: if you later change polar or Sailchart, an older routing keeps the sails of its calculation.

The “Colour” selector on “Sail”, its legend and a routing coloured by sailThe “Colour” selector on “Sail”, its legend and a routing coloured by sail

Markers on the route

Under the colour legend, in the “Routings” tab, an untitled row holds three settings:

  • “Wind”: shows or hides the wind barbs along the route;
  • “Current”: shows or hides the current arrows (they exist only if the routing takes current into account);
  • a density field, from 25 to 100% in steps of 25: it thins out the markers placed at the time of the isochrones and at the crossings. The start, the finish, the waypoints, the tacks and the gybes are always marked. The field is greyed out when “Wind” and “Current” are both off, and only those points remain.

By default “Wind” and “Current” are on and the density is 100%. These settings apply to all routings and are shared between your devices. A current arrow shrinks below 1 knot, and it is not drawn below 0.1 knot.

The values bar and its graph

The bar shows the values of the leg the boat is sailing at the timeline’s time. It shows only what the routing contains:

ValuesWhen they appear
“Sail”the polar has a Sailchart
TWD, TWS, TWA, AWS, AWA, SOG, COGalways (true wind, apparent wind, speed and course over ground)
“Gust”the wind GRIB provides gusts
STW, CTW, SOC, DOCthe routing takes current into account (speed and heading through the water, speed and direction of the current)
“Waves”, “Wave Dir”, “Wave Per”a wave GRIB is used
CAPE, “Precip”, “Cloud”, “Pressure”, “Temperature”the wind GRIB contains these parameters
“Under keel”coastal routing with a C-MAP chart
“Tide”a tide station is close to the route and “Use the tide for the depth” is on
“Engine”a leg under engine exists
  • “Tide” shows where the tide stands, as a percentage between low water (0%) and high water (100%), with a rising or falling arrow; failing that, the water height.
  • “Under keel” gives the water under the keel at its tightest on the leg (lowest sounding, lowest tide during the passage), preceded by “≥”. The value turns yellow when this water is less than the under-keel clearance, and red if the boat would touch the bottom.

Tapping a value opens its graph under the bar: the curve over the whole duration of the routing, and a red cursor at the timeline’s time. Tap or drag your finger on the graph to move the time.

The tidal coefficient is not in the bar: it is in the routing table.

The routing details

“Details”, in the routing’s ⋮ menu, opens a window (a separate window on computer, a full-screen panel on phone, tablet and browser). It has four tabs, five for an ensemble routing: “Routing”, “Statistics”, “Ensemble”, “AI briefing” and “Inputs”. “Details” is unavailable during a calculation.

Routing tab: the table

One row per leg of the route, with the “Time” frozen on the left, and one column per data item. Columns with no data are removed (engine never used, no waves, a single wind model…). On phone, the headers are abbreviated to acronyms (TWS, TWD…).

Depending on the routing, the table gives: true and apparent wind, speed and heading over ground and through the water, current, distance to the finish and to the waypoint, the sail configuration, the engine (⚙), total sea, wind sea and swell, “Crossed Sea” (⚠️ when there is some), gusts, pressure, air temperature, precipitation, CAPE, cloud cover, and the “Wind Model” when several GRIBs were used.

A few reading tips:

  • the wind angle (TWA) is followed or preceded by a chevron that indicates the tack, in red or green (orange or teal in colour-blind mode);
  • wave, pressure or rain values missing from the GRIB are shown as “-”.

The coastal route report. The table can add, leg by leg, the columns below. “Water Depth”, “Under keel” and “Nearest Danger” require a C-MAP chart and “Avoid shallow waters (C-MAP)” on. “Distance to Coast” is also shown without C-MAP. The three tide columns are shown, with or without C-MAP, as soon as a tide station is close to the route and “Use the tide for the depth” is on (yes by default):

ColumnContent
“Water Depth”the lowest sounding on the leg, tide included (“≥”), “Land or rock” if the leg touches land
“Under keel”the water remaining under the keel
“Nearest Danger”the distance to the nearest danger
“Distance to Coast”the distance to land
“Tide height”the tide height, with the trend (↑ ↓) and the position between low and high water in %
“Tide Harbour”the tide station used
“Tidal Coefficient”the coefficient

A coloured value flags the leg to watch: water under the keel less than the under-keel clearance (yellow), boat that would touch the bottom (red), danger closer than the set minimum distance (yellow). See Coastal routing with C-MAP charts.

Statistics tab

  • Start and finish, length of the routing and of the route, “Lengthening” (the ratio of the two), engine time and “Wave model”.
  • “Sail usage” (with a Sailchart): for each sail, the share of time, the duration and the distance covered.
  • “Wind Speed/Angle Distribution”: a cross table of wind strengths (in 5-knot bands) and wind angles, as a percentage of time. It shows at a glance whether the passage will be mostly upwind or downwind, and in what wind.

Ensemble tab

Reserved for ensemble routings: see Ensemble routing.

AI briefing tab

A weather analysis of the routing written by an artificial intelligence: see AI briefing.

Inputs tab

All the calculation parameters: polar and efficiencies, angles, isochrone steps, wind, current and wave GRIBs with their run, percentages, start, route, penalties, engine, zones, limits, sail set. For a routing restarted with “Recalculate”, a header says “Recalculation of the routing of …” and the number of changed inputs, and each changed value shows the old one in brackets (“(was … )”).

In the “Routings” tab, each row also summarises the routing: start, finish, duration, length of the optimal route and its ratio, as a percentage, to the plotted route, date of the calculation.

See also

↑ Contents

9.10 AI briefing

Beginner

The essentials

The AI briefing is an expert reading of the weather and strategy of your routing, written in a few dozen seconds by an artificial intelligence from the routing data. It requires the Premium subscription, an Internet connection and being logged in to your NavimetriX account.

  1. In the “Routings” tab of the left drawer, open the ⋮ menu of the routing, then “Details”.
  2. Choose the “AI briefing” tab.
  3. Tap “Request AI briefing”.
  4. Wait: a message says the AI is analysing the routing and gives an estimate of the time remaining.
  5. Read the briefing, and tap “Export as PDF” to keep or share it.

“AI briefing” tab of a routing’s details: the briefing displayed with its numbered headings, the “Refresh AI briefing” and “Export as PDF” buttons at the top, the AI warning and the “Usage” counter at the bottom“AI briefing” tab of a routing’s details: the briefing displayed with its numbered headings, the “Refresh AI briefing” and “Export as PDF” buttons at the top, the AI warning and the “Usage” counter at the bottom

Warning: the briefing is generated automatically. It may contain inaccuracies, even errors. Always check the official forecasts and use good seamanship: the skipper alone remains responsible for the safety of the boat and crew.

Going further

What the briefing contains

The app sends the AI server a summary of the routing: the optimal route leg by leg (time, position, heading, speed, wind) and, when the GRIBs provide them, gusts, CAPE (the energy available for thunderstorms), pressure, cloud, rain, temperature, sea state, crossed sea, the sail carried and engine hours. The briefing is written in the language of the app and structured in four parts:

  1. general situation and trends;
  2. weather forecast along the route: wind, pressure, cloud, rain, thunderstorms, CAPE index;
  3. analysis of the routing;
  4. risks: front, gusts, thunderstorms, sea state…

It may also offer links to an isobaric chart and to the coastal and offshore bulletins of Météo-France.

Keep, refresh, cancel

  • The briefing is saved with the routing: when you reopen the tab, it is still there. It is deleted along with the routing.
  • When a briefing exists, the button becomes “Refresh AI briefing”: tap it to request a new one, for example after a recalculation.
  • During generation, “Cancel Request” stops the request.
  • Without a Premium subscription, the button stays greyed out and the message “AI briefing requires Premium subscription” is displayed.

The credit of 300 briefings a year

Generation uses artificial intelligence servers billed by usage. Each Premium subscriber has 300 briefings a year, over a sliding window of 365 days: each briefing counts for one year, then no longer counts. The counter is shared by all the devices of your account.

At the bottom of the tab, “Usage” shows the number of briefings used out of 300; tap it to see the detail (used, remaining). When the credit is exhausted, a message says so and no briefing can be requested until an older request expires.

The PDF export

“Export as PDF” becomes active as soon as a briefing is displayed. The document, in A4 format, is always printed on a white background, whatever the theme of the app:

  • the first page: the title “Weather briefing”, the routing, the boat, the polar and the weather model; the key figures (start, duration, distance, average speed, minimum, average and maximum wind, maximum gust, maximum sea, maximum CAPE, sail changes, number of segments); the route chart, coloured by sail and marked with wind barbs; the graph of wind and boat speed, with the sails carried below it;
  • the briefing pages, with the AI text;
  • graphs along the route: wind direction, wind angle, sea state (sea and swell), pressure;
  • statistics: time spent by wind force, by wind angle and by sail.

Each page notes in its footer that the document was generated by an artificial intelligence.

A preview opens first (“Briefing PDF”), with a page and zoom bar. Then:

  • on phone and tablet, “Share” opens the system share sheet (email, messaging, files…);
  • on computer, “Save” offers to save the PDF in the Downloads folder, under the routing’s name followed by “_briefing.pdf”.

See also

↑ Contents

9.11 Manage routings (Routings tab)

Beginner

The essentials

All your routings are found in the left drawer, “Routings” tab. They are saved and shared between the devices of your account.

For each routing, the list shows its name in its colour, the start, the finish, the duration, the length of the optimal route with its ratio, as a percentage, to the plotted route, and the date of the calculation. On the right:

  • the eye shows or hides the routing on the chart;
  • the ⋮ button opens its menu: “Details”, “Convert to route”, “Recalculate”, “Rename”, “Export” (“Share” on phone and tablet) and “Delete”.

Tapping the row selects the routing (orange bar on the left) and displays its isochrones if the “Isochrones” checkbox of the layers menu is ticked.

The Routings tab and a routing displayed on the chartThe Routings tab and a routing displayed on the chart

Going further

A routing’s menu

EntryEffect
“Details”opens the table, the statistics, the AI briefing and the routing inputs (see Read a routing)
“Convert to route”creates a route to follow from the routing (below)
“Recalculate”restarts the routing with a more recent forecast (see Routings started from the chart)
“Rename”opens “Rename routing”, with the “Routing name:” field
“Export” or “Share”exports this routing alone (below)
“Delete”deletes the routing after confirmation

“Details”, “Convert to route” and “Rename” are unavailable during a calculation.

Convert a routing to a route

A route taken from a routing has hundreds of points. “Convert to route” simplifies it into a route to follow, which you can edit, follow with the autopilot or send to your instruments.

Warning: look at a routing ten times before entrusting it to an autopilot. We do not recommend it.

The “Convert to route” window offers:

SettingValuesDefault
“Name”freethe routing’s name followed by “(route)”
“Heading tolerance”0 to 30°5°
“XTE margin”0.1 to 10.0 nm0.4% of the routing length, between 0.1 and 10 nm
  • The heading tolerance groups legs whose heading varies by less than this value.
  • The XTE margin (cross-track error) is the maximum deviation allowed between the simplified route and the routing’s route.

Under the settings, “… points → … waypoints” shows live how many waypoints the route will keep. The simplification never cuts across land or no-go zones and, if C-MAP coastal routing is on, it respects the same shallows, distances to dangers and buoyage as the routing.

Tap “Create route”: the route appears at the top of the “Routes” tab, and a message confirms the number of waypoints. You can then hide the routing with its eye. To follow the route, see Navigate to a POI and follow a route.

Export and share

One routing: ⋮ menu, “Export” or “Share”. Several routings: tick their boxes, to the left of the rows, then tap “Export” or “Share” in the bottom bar.

Three formats exist:

  • .nxrouting (“NavimetriX routings”): the complete routing, as it was calculated. It opens in another NavimetriX installation, including on another account, and is displayed there identically;
  • GPX: the optimal route, point by point, for a chartplotter or other software;
  • KML: the route for Google Earth and mapping tools.

On computer, a save window opens on the Downloads folder, with a name of the form “navimetrix_routings_YYYYMMDD_HHMM”; the format follows the chosen extension (.gpx, .kml or .nxrouting). On phone and tablet, “Share” sends all three files at once through the system share sheet.

Import

Tap “Import” in the bottom bar and choose one or more .nxrouting files. The app checks that they really are NavimetriX routings, then:

  • displays “The routing “…” has been imported.”, or reports that it already exists;
  • selects the last imported routing and centres the chart on it.

Import is not possible during a calculation (“A routing is being calculated. Import the file once it is finished.”).

Delete

  • One routing: ⋮ menu, “Delete”, then confirm.
  • Several routings: tick them, then “Delete” in the bottom bar.

Deletion also removes the routing’s AI briefing. It applies to all the devices of the account.

See also

↑ Contents

9.12 Study your routing and pivot points

Expert

The essentials

A calculated routing is more than a line on the chart: you can read it back, then restart from one of its points to test another option.

A pivot point is a point on an isochrone through which a new routing is forced to pass. It is the quickest way to compare two options, for example passing inside or outside a traffic separation scheme.

Going further

Study a routing that is already calculated

To read a routing back, follow the boat along the route, the leg-by-leg table, the statistics and the calculation inputs: all of this is described in Read a routing. Routings are found and managed in the “Routings” tab: see Manage routings.

The isochrones show where the boat can be at each time step. On each one, a blue dot marks the point through which the best route passes. If the route does not pass through it, it is the point closest to the finish, in distance over water. These points serve as pivot points to test another route option. See Routing principles and isochrones.

Route from a pivot point

A pivot point is a point on an isochrone through which a new routing is forced to pass. It is the quickest way to compare two options, for example passing inside or outside a traffic separation scheme.

  1. Display the routing’s isochrones (“Isochrones” checkbox in the layers menu, then tap the routing in the “Routings” tab): see Routing principles and isochrones.
  2. Choose the point:
    • on computer, move the mouse: the optimal route to the nearest isochrone point is displayed. Click that point, then “Routing from this point”;
    • on tablet and phone, move the chart: the point follows the target at the centre of the screen. Then tap “+”: the “Calculate Routing” entry there becomes “Routing from this point”.
  3. The new routing starts from the chosen routing at the pivot point and continues to the finish.

A routing from a pivot point takes its route, start time and weather files from the chosen routing, not those set in the “Routing” window. It is refused if those files are no longer on the device, or if they have been updated with a more recent forecast: the two pieces of route would then come from two different forecasts. The message invites you to recalculate the routing first.

Good to know

See also

↑ Contents

↑ Contents

10 Navigation: GPS, NMEA and AIS

This chapter covers everything you need underway: the boat’s position, from the device’s GPS or an external GPS, receiving your instruments over NMEA 0183 (one or several links), the data NavimetriX reads and calculates, the outputs to the autopilot and displays, and the sentence log. It also describes AIS targets, received on board or over the Internet, sharing to the network, and the chart tools: target, vectors, cross-track corridor, laylines and measurements.

10.1 Device GPS and external GPS

Beginner

The essentials

NavimetriX takes the boat’s position either from the device’s GPS (phone, tablet) or from an NMEA stream (navigation instruments, USB or Bluetooth GPS, Wi-Fi gateway). The choice is made in the right-hand “Settings” drawer, “GPS & NMEA” section, “GPS source” row:

  • “Internal”: the device’s GPS (default setting on phone and tablet);
  • “NMEA”: the position from the NMEA stream (default setting on computer, which has no GPS).

To navigate with your phone’s GPS:

  1. Check that the “GPS source” is set to “Internal”.
  2. Allow location access for NavimetriX when the system asks.
  3. Turn on the “Navigation” switch at the top of the left drawer (Premium subscription).
  4. The arrow to the right of “Navigation” turns green when the position is good.

The Navigation switch turned on and the GPS indicatorThe Navigation switch turned on and the GPS indicator

Going further

Outside Navigation mode, the device’s GPS only provides a position every 30 seconds. In Navigation mode, it switches to one position per second (every 2 seconds in power-saving mode), in high accuracy on mobile. When you turn it on, a “Navigation Mode ON” window reminds you of these changes.

On Android, a permanent notification keeps the GPS, NMEA and alarms alive when the app goes to the background. On phones and tablets, the app checks when you turn it on that background location permissions are granted and guides you if they are not.

The accuracy indicator

The small arrow to the right of the “Navigation” switch shows the position status:

ColorMeaning
GrayNavigation mode off
Green (blue in color-blind mode)accuracy of 15 m or better, or accuracy not provided by the source
Orangeaccuracy between 15 and 50 m (the shade slides from green to red)
Redaccuracy of 50 m or worse, no position for 10 seconds, or no first position yet

The indicator applies to the position source in use, internal GPS or NMEA. To be warned of a loss of position, set the corresponding alarm (see Navigation alarms).

Satellites

The “GNSS satellites” instrument draws the sky as seen by the receiver: each satellite in its place (azimuth, elevation), colored by constellation (GPS, GLONASS, Galileo, BeiDou, QZSS), distinguishing those used to compute the position. The “Satellites in view” and “Satellites used” tiles give the counts.

  • With the internal GPS, this data only exists on Android. iOS does not provide it, and a computer has no receiver: the values stay at “—”.
  • With an NMEA GPS, it comes from the receiver’s sentences (GSV, GGA, GSA).

Only the satellites of the position source in use are displayed. To add the instrument, see Instrument types.

USB GPS on a computer

USB GPS devices (“GPS mice”) work on macOS, Windows and Linux. NavimetriX reads the NMEA sentences the GPS sends on its serial port. NMEA requires the Premium subscription.

  1. Install the GPS driver if needed (often FTDI or Prolific).
  2. In “Settings”, “GPS & NMEA”, tap “Scan NMEA devices”, then “Start Scan”. On a computer, the scan tries each serial port at 9600, 4800, 38400 and 115200 baud.
  3. Tap “Apply settings”: the port, baud rate and GPS source are set, and the “NMEA” switch is turned on.

By hand: “GPS source” on “NMEA”, “NMEA” switch on, “NMEA Protocol” on “SERIAL”, then the “Serial port” (COM3, COM4… on Windows, cu.usbserial… on Mac) and the “Baud rate”: 4800, 9600 (default), 38400 or 115200. Many NMEA 0183 GPS devices transmit at 4800.

The serial port only exists on computers: on phones and tablets, “SERIAL” is grayed out. Received sentences scroll in the “Incoming NMEA sentences” console, at the bottom of the page (see NMEA 0183 connection).

Bluetooth GPS on Windows

Once paired in Windows (“Settings”, “Bluetooth & devices”), a Bluetooth GPS appears as a COM port, for example “Standard Serial over Bluetooth link” in Device Manager. The settings are those of a USB GPS: “GPS source” on “NMEA”, “NMEA” on, “NMEA Protocol” on “SERIAL” and that COM port. If the GPS appears on two ports and the first receives nothing, try the other.

The Mac and its “position”

A Mac has no GPS: macOS deduces its position from Wi-Fi networks or the IP address. This position may center the chart at startup, but it is never taken as the boat’s position in Navigation mode. On a Mac, navigate with a USB GPS, NMEA instruments or a phone’s GPS relayed over the local network (see NMEA outputs).

The approximate position from the IP address

At the very first launch, or when no real position has been received yet, the app may request an approximate position over the Internet, deduced from the IP address, to center the chart. It keeps it for one hour at most.

This position is only a landmark:

  • it is never used in Navigation mode: when you turn that mode on, it is discarded and the boat waits for a real position;
  • as soon as a real position (GPS or NMEA) has been received during the session, it is never used again, even if the link drops: the boat stays at its last known position, shown as old;
  • it is never used as the starting point of a routing “from the boat”.

When the NMEA source goes silent

In simple mode, with “GPS source” on “NMEA”, the device’s GPS takes over (except on a Mac in Navigation mode, see above) if the “NMEA” switch is off or if the stream no longer provides a position, and a message announces it (“Position: switched to Internal (NMEA lost)”, then “Position: back on NMEA”). Advanced mode lets you fine-tune this fallback order: see Multiple links and position source.

See also

↑ Contents

10.2 NMEA 0183 connection

Beginner

The essentials

NMEA 0183 is the text language of onboard instruments: each device sends sentences (for example $GPRMC for position, $IIMWV for wind). NavimetriX receives them over the Wi-Fi of a gateway or multiplexer (UDP or TCP), or over a USB cable on a computer. On a computer, NMEA data can also arrive over a network cable (Ethernet), exactly as over Wi-Fi, provided the computer is on the same network as the gateway. An NMEA 2000 network goes through a gateway that converts it to NMEA 0183.

NMEA requires the Premium subscription. It does not exist in the browser version.

  1. Connect the device to the Wi-Fi of your NMEA gateway (not the marina’s).
  2. Open the right-hand “Settings” drawer, “GPS & NMEA” section.
  3. Tap “Scan NMEA devices”, then “Start Scan”.
  4. When a stream is found, tap “Apply settings”: the protocol, address and port are filled in, and the “NMEA” switch is turned on.
  5. Check that sentences are scrolling in the “Incoming NMEA sentences” console, at the very bottom of the page.

The “GPS & NMEA” page in simple modeThe “GPS & NMEA” page in simple mode

Going further

The page settings (simple mode)

SettingValuesDefault
“GPS source”“Internal” or “NMEA”Internal on mobile, NMEA on computer
“NMEA”switchoff
“NMEA Protocol”“UDP”, “TCP”, “SERIAL”, “DEMO”UDP
“Server IP address”gateway address10.0.0.1
“Server port”1 to 6553510110
“Serial port” (SERIAL)detected ports
“Baud rate” (SERIAL)4800, 9600, 38400, 1152009600
  • “GPS source”: “NMEA” takes the position from the stream, “Internal” from the device’s GPS (see Device GPS and external GPS).
  • The “NMEA” switch controls all NMEA reception and output on this device. It is specific to each device. It also appears in the window shown when you turn Navigation mode on or off, and the app remembers your choice for each direction: NMEA on while underway and off in port, for example.
  • UDP: the gateway broadcasts its sentences on the network, and NavimetriX listens to the port on all of the device’s networks. For reception, only the port matters: the IP address is only used by the NMEA outputs. This is the preferred choice: several devices receive the same stream.
  • TCP: NavimetriX connects to the gateway, at the IP address and port given. Some gateways only accept a limited number of TCP clients.
  • SERIAL: a gateway or GPS plugged in by USB, on computer only (macOS, Windows, Linux). On phones and tablets, the choice is grayed out.
  • DEMO: replays a recorded passage, to discover the app ashore. Choosing it turns on the “NMEA” switch. Demo data is never saved in the NMEA log.

“Advanced mode”, at the bottom of the block, opens separate links for GPS, AIS and three additional links: see Multiple links and position source.

Scanning for NMEA streams

“Scan NMEA devices” opens the “NMEA Device Scanner”. “Start Scan” tries the settings of common gateways:

  • over UDP, it listens at the same time on the usual ports: 10110 (the standard port), 50000 (NKE Wi-Fi box), 11101 (PredictWind DataHub), 2000 (Digital Yacht), 5000 (EM-TRAK), 1456 (Yacht Devices), 60002 (Actisense W2K-1), 24000 (Ocean Signal), 40000 (AdvanSea), 1024 (PIXEL EXOCET);
  • over TCP, it tries the default address and port of each known gateway: ShipModul MiniPlex, NKE Wi-Fi box, Digital Yacht, EM-TRAK, Vesper Marine, Garmin Cortex, AMEC, Navico GoFree (B&G, Simrad, Lowrance), Actisense W2K-1, Comar, Brookhouse, Ocean Signal, Yacht Devices, AdvanSea, Weatherdock;
  • on a computer, it also tries each serial port at 9600, 4800, 38400 and 115200 baud.

Each stream found is displayed with its protocol, address, port and the list of sentences received, which lets you recognize the device. In simple mode, the scan stops at the first stream found; “Apply settings” sets it on the page and turns on “NMEA”. If the stream contains a position, the “GPS source” switches to “NMEA”; if it contains AIS, targets are drawn from it. A scan log is displayed below (“Clear Log” empties it).

The NMEA device scanner after a successful scanThe NMEA device scanner after a successful scan

The scan only knows the default addresses: a gateway that the onboard router has given a different address is only found over UDP. In that case, set the page by hand.

The “Incoming NMEA sentences” console

At the bottom of the page, the console shows what is actually passing over the link. It is the diagnostic tool: if sentences are scrolling, the link is good.

  • At the top, the link status, for example “UDP: 10110 (listening)”, “TCP: 10.0.0.1:10110 (waiting)”, “NMEA disabled” or “Demo mode”.
  • Received sentences are displayed in green, those NavimetriX sends (NMEA outputs) in orange, the most recent at the top. The console keeps the last 200 lines.
  • The “Input” and “Output” boxes filter the two directions and each shows the number of messages per second.
  • “Pause” freezes the display (“Resume” restarts it), “Copy” copies the console lines to the clipboard, each marked [IN] or [OUT], to send to support for example, “Clear” empties the console.

The two “Port” messages

Two warnings may appear under the “Port” field:

  • “Port already used by another input” (in red): two NavimetriX links target the same port, and this one is not listening. Give it another port. The relay port must also differ from the ports being listened to.
  • “Port also used by another app” (in yellow, for information only): other software is listening on this port on the same device. If the gateway broadcasts to the whole network, both receive everything. If it only sends to a single recipient, only one of the two will receive the data: close the other software. This is often the explanation for a correctly set link that receives nothing.

Nothing arriving?

  1. Check the Wi-Fi: the gateway’s, not the marina’s.
  2. Check that the “NMEA” switch is on.
  3. Check the protocol and port in the hardware manual, or run a scan.
  4. Look at the console: if it is empty, the link receives nothing; if sentences are scrolling, the link is good and the problem is elsewhere.

Special cases

  • Starlink antenna: put the multiplexer in Wi-Fi client mode on the Starlink router’s network, note the IP address it receives (preferably a fixed one), then set “TCP”, that address and the multiplexer’s port. Disable Wi-Fi client isolation on the router. The details are in the FAQ below.
  • NKE Wi-Fi box: the scan tries its UDP port 50000 and its TCP address 192.168.56.1, port 50000. If nothing scrolls, update the box and, on a recent iPhone or iPad, switch its Wi-Fi to open mode: see the FAQ.
  • USB on a computer: gateways seen as a standard serial port generally need no driver; otherwise, install the manufacturer’s (often FTDI or Prolific).
  • Several devices on board: over UDP, each device receives the gateway’s stream. With UDP to a single address, with TCP or over USB, one device can relay what it receives on the local network for the others (advanced mode, “Relay on local network”): see NMEA outputs.

See also

↑ Contents

10.3 Multiple links and position source

Expert

The essentials

On many boats, the navigation instruments, the GPS and the AIS receiver are separate boxes, each with its own Wi-Fi or port. Advanced mode lets you listen to them all at the same time, without a multiplexer.

  1. In “Settings”, “GPS & NMEA”, turn on “Advanced mode” (at the bottom of the block).
  2. The page reorganizes into six tabs: “GPS”, “Instruments”, “AIS”, then “Extra 1”, “Extra 2”, “Extra 3”.
  3. Set each link in its tab: protocol, address, port. Or tap “Scan NMEA devices”: the scan suggests a role for each stream found.
  4. In the “GPS” tab, choose the “GPS source”, the link that provides the position.

Advanced mode: six tabs and the scanAdvanced mode: six tabs and the scan

Going further

TabLink titleUse
“GPS”“GPS”a dedicated GPS
“Instruments”“Navigation instruments”wind, depth, log, heading, and often the position
“AIS”“AIS receiver”a separate AIS receiver or transponder
“Extra 1” to “Extra 3”“Additional link 1” to “3”everything else: barometer, man overboard receiver, a stand-alone sensor
  • Each link has its own “NMEA Protocol”, address and port, or serial port and baud rate. An unused link is set to “None”.
  • By default each link listens on a different port: 10110 for the instruments, 10111 for the GPS, 10112 for the AIS, then 10113 to 10115. Two links on the same port would not work (see the “Port already used by another input” message in NMEA 0183 connection).
  • The “NMEA” switch in the “Instruments” tab controls all links: when it is off, nothing is received or sent.
  • “DEMO” mode only exists for the instruments. During a demo, the other links stay silent, so that real data is not mixed with replayed data.
  • With UDP, TCP and SERIAL, each link can relay what it receives on the local network (“Relay on local network”, “Relay port”, 10111 by default), for example so that a computer connected over TCP or USB feeds the tablets, or to relay a device that only sends its data over UDP to a single IP address. See NMEA outputs.

Measurements (wind, depth, log, heading, pressure…) are taken wherever they arrive. AIS targets from all links are merged: a vessel appears only once, whichever link received it.

Warning: going back to simple mode does not just hide the tabs, it switches off the GPS, AIS and additional links. Their settings are kept and come back when you turn advanced mode on again.

The position source

The position, on the other hand, can only come from one link at a time, otherwise the boat would jump from one point to another. In advanced mode, the “GPS source” in the “GPS” tab offers:

  • “Internal”: the device’s GPS. On a Mac, the position deduced from Wi-Fi or the IP address is never used in Navigation mode;
  • “Instruments”: the position arrives with the instruments, the most common case;
  • “GPS”: the dedicated GPS link. Its settings only appear in the tab in this case;
  • “AIS”: a transponder with its own built-in GPS.

The dedicated GPS link only works if “GPS source” is set to “GPS”: choosing another source stops it.

“GPS source” in advanced mode“GPS source” in advanced mode

Automatic fallback

SettingDefault
“Automatic fallback”on

If the designated source stays silent too long, NavimetriX looks for another position rather than leaving you without one. A link is considered silent after three times its usual position sending interval, with a minimum of 10 seconds and a maximum of 2 minutes: a GPS sending one position per second is therefore declared lost after 10 seconds.

The fallback order is: the designated source, then the instruments, the AIS, the dedicated GPS (if it is the designated source), additional links 1 to 3, and finally the device’s GPS. Only a link that provides a real position can be chosen: an AIS receiver without GPS is never used.

A banner announces each switch (“Position: switched to … (… lost)”), then “Position: back on …” when the original source returns.

Disabling the fallback is only useful to see immediately that a GPS has dropped, even at the cost of losing the position. In simple mode, the fallback exists too: with “GPS source” on “NMEA”, the device’s GPS takes over if the instruments no longer provide a position.

The AIS source

In the “AIS” tab, the “AIS source” says whether a dedicated AIS receiver exists:

  • “Instruments”: the AIS sentences arrive with the instruments, there is no dedicated AIS link (it is stopped);
  • “Dedicated”: the “AIS receiver” link is set and listened to.

AIS targets require the Premium subscription. Their display is described in AIS targets.

Scanning in advanced mode

In advanced mode, the scan does not stop at the first stream: it looks for all of them, then suggests a role for each based on what it contains (AIS: “AIS”; only a position: “GPS”; instrument data: “Instruments”). A list to the right of each stream lets you change this role, choose “Link 1” to “Link 3”, or “Ignore”. A role can only hold one stream: assigning it to one removes it from the stream that had it.

“Apply settings” sets each link. If an instruments stream also contains the position or AIS, the “GPS source” or “AIS source” switches to “Instruments”, unless a dedicated GPS or AIS receiver was found.

Speed reference and true wind

Advanced mode adds a calculation block, “Speed reference” and “True wind”. It is described in Received data and calculations. Going back to simple mode resets these two settings to their default value.

See also

↑ Contents

10.4 Received data and calculations

Expert

The essentials

NavimetriX reads NMEA 0183 sentences for position, heading, speed, wind, depth, rudder, XDR sensors and AIS. It calculates the true wind, leeway, current, VMG and waypoint data itself.

Two advanced mode settings on the “GPS & NMEA” page change these calculations:

  • “Speed reference”: “Surface” (the log speed, the default) or “Ground” (the GPS speed, when the log is fouled);
  • “True wind”: “Computed” by NavimetriX (the default) or taken from the “Instruments” when they send it.

The “NMEA barometer offset” in the “Barometer” block corrects the error of an NMEA barometer.

To see what is really arriving, look at the “Incoming NMEA sentences” console at the bottom of the page (see NMEA 0183 connection).

Going further

Sentences read

SentenceData
RMCposition, speed over ground (SOG), course over ground (COG), time and date
GGAposition, time, satellites used, accuracy
GLLposition
VTGspeed and course over ground
GNS, GSAsatellites used, accuracy
GSVsatellites in view
HDGmagnetic heading, converted to true heading using the declination
HDMmagnetic heading
HDTtrue heading
VHWspeed through water (STW) and heading
VBWspeed through water, only if VHW is not arriving
ROTrate of turn
MWVapparent wind (reference R) or true wind (reference T)
VWRapparent wind
VWTtrue wind
MWDtrue wind direction and speed
DPTdepth, with the offset set on the depth sounder
DBTdepth below the transducer
RSArudder angle
MTWwater temperature
MDAatmospheric pressure, air and water temperatures
XDRheel, roll, rudder angle, temperatures, pressure, batteries
VDMAIS targets

The magnetic declination is calculated at the boat’s position with the World Magnetic Model (WMM), every 10 seconds.

For DPT depth, the offset sent by the depth sounder is added, as on the onboard display: positive, it gives the depth below the surface; negative, the depth below the keel. A depth of 0.0 is read as “no bottom” (many depth sounders send it when they lose the bottom).

Not read: RMB, WPL, APB, XTE, BOD and BWC (the distance, bearing, VMC and time to the waypoint are calculated by NavimetriX from your route or your “Goto”), VLW (trip log), ZDA (time only) and VDO (your own boat’s AIS position).

When a value arrives in several sentences

Every 10 seconds, NavimetriX checks which sentences are actually arriving and, for some data, keeps only one, in this order:

DataOrder
HeadingHDG, otherwise HDT, otherwise VHW
Apparent windMWV, otherwise VWR
True wind receivedMWD, otherwise MWV
DepthDBT, otherwise DPT
Speed through waterVHW, otherwise VBW

If the selected sentence stops arriving, the next one takes over at the next check. Position sentences (RMC, GGA, GLL, VTG) and AIS sentences are always read.

With several links (advanced mode), position and time come only from the link chosen in “GPS source” (see Multiple links and position source). For other data, if two links send the same sentence, the instruments win, then the GPS, the AIS and additional links 1 to 3. AIS targets and XDR and MDA measurements are taken from all links, measurement by measurement: a barometer sent in XDR on an additional link is not masked by an instrument system that sends the rudder angle in XDR.

XDR sensors

The XDR sentence carries measurements from various sensors. NavimetriX recognizes:

MeasurementTypeUnitSensor name
HeelAD (degrees)PTCH
RollADROLL
Rudder angleADcontains RUDDER
Water temperatureCC, F or Kcontains WATER
Air temperatureCC, F or Kcontains AIR
Atmospheric pressurePB (bars, between 0.8 and 1.1)free
Voltage of a battery bankUVbank name
Current of a bank (negative when discharging)IAbank name
State of chargeother than PP (percentage)bank name, or contains SOC

Names are read without regard to case, except PTCH and ROLL, which must be exact. A pressure in bars outside 0.8 to 1.1 bar (oil, hydraulic) is ignored. Detailed formats and examples are in the FAQ below.

What NavimetriX calculates

  • True wind (speed, angle, direction) from the apparent wind corrected for heel, the reference speed corrected for leeway, and the heading.
  • Leeway (the angle between the boat’s centerline and her course through the water), estimated from heel and speed.
  • Current (speed and direction), from the difference between the movement over the ground (GPS) and the movement through the water (log and heading).
  • VMG and performance relative to the polar.
  • Waypoint data (distance, bearing, VMC, time remaining) from the route being sailed or the “Goto”.

The displayed values are damped according to the “Instruments”, “Damping” settings (see Instrument types).

Speed reference

SettingValuesDefault
“Speed reference”“Surface” or “Ground”Surface

The speed reference feeds the calculation of true wind, leeway, VMG and efficiencies relative to the polar. “Surface” (the log speed) is the physical choice. “Ground” (the GPS speed) is a stopgap when the log is fouled: true wind and performance then remain usable, at the cost of the effect of the current. The measured speed through water is still displayed as such.

True wind

SettingValuesDefault
“True wind”“Computed” or “Instruments”Computed

By default, NavimetriX recalculates the true wind itself. With “Instruments”, it displays the true wind that your instruments send (MWV reference T, VWT, MWD), with the correction tables they apply: you then see the same wind as on their displays. NavimetriX uses the true wind values sent by the instruments as long as they are fresh (received less than 5 seconds ago) and falls back to the calculation for missing or stale quantities. This row only appears in advanced mode.

These two settings only exist in advanced mode. Going back to simple mode resets them to “Surface” and “Computed”.

Barometer correction

SettingValuesDefault
“NMEA barometer offset”-15.0 to +15.0 hPa, in steps of 0.10.0 hPa

The correction is added to the pressure received over NMEA. It is saved with your account and applies on all your devices. On a device that has its own barometer, two more rows appear: “Use the device sensor” and “Device sensor offset”.

“Calibrate online” sets the correction of the source in use from the sea-level pressure forecast by the weather model at your position. It needs a real GPS position (not the approximate position from the IP address) and Internet. The correction takes the sensor’s height into account: it only applies where it was taken, and a note appears when you have changed location. “Erase history” empties the pressure history, after confirmation.

The barometer and barograph are described in Barometer and barograph.

See also

↑ Contents

10.5 NMEA outputs

Expert

The essentials

The NMEA Outputs pageThe NMEA Outputs page

NavimetriX can also send NMEA 0183 to the instruments: the device’s position for a plotter without GPS, navigation sentences for the autopilot, performance data for NKE or PIXEL displays. Outputs go out over the configured NMEA link: they therefore require the Premium subscription and an active link.

  1. Set up reception first (see NMEA 0183 connection).
  2. In “Settings”, “GPS & NMEA”, tap “NMEA Outputs”, at the bottom of the page.
  3. Turn on the sentences you want.
  4. Check the output in the “Incoming NMEA sentences” console: the sentences sent appear there in orange.
  5. With an NKE box, initialize it once so that the displays receive this data: see Initializing the NKE box.

Going further

When and where outputs go

  • Sentences are sent once per second, as soon as an NMEA link is active. They are spread across the second so as not to saturate slow gateways (such as the NKE Wi-Fi box).
  • They go out over the instruments link. If there are no instruments (a boat with only a GPS and an AIS), they go out over the first active link.
  • In UDP, they are sent to the “Server IP address” and the port of the link. After a scan, “Apply settings” writes the address of the gateway found there. If you set up the link by hand, make sure this is the gateway’s address: otherwise the sentences show in orange in the console but reach nothing.
  • Waypoints and routes (WPL, RTE) preferably go out over the dedicated GPS link when it is active: a plotter often only accepts these transfers on its own link.
  • Without a valid boat position, only the barometer pressure is sent, so as never to send false values to the autopilot. Nothing is sent either during a track replay or while following another boat.

Internal sensors to NMEA

The “Internal Sensors to NMEA” block sends the boat’s position (generally that of the device’s GPS) to the instruments:

SentenceContent
RMCposition, course, speed
GLLposition only
GGAposition, fix quality, satellites
VTGcourse and speed
XDR / MDAdevice barometer, pressure (only on a device that has a barometer)

RMC and VTG carry undamped speed and course: the plotter or autopilot does its own damping. The pressure goes out every 5 seconds, corrected by the “Device sensor offset”. Only the device’s barometer is sent: an NMEA barometer is already on the network.

Autopilot

Warning: when these boxes are ticked and an autopilot receives these NMEA sentences, it changes the boat’s course. This is very convenient, but must be used with the greatest caution.

The “Auto Pilot” block sends the navigation sentences toward a waypoint. They only go out when a destination is active: a “Goto” to a POI or a route being followed (see Navigating to a POI and following a route).

SentenceContent
APBautopilot: bearing, cross-track error, steering
BODbearing from origin to waypoint
BWCbearing and distance to the waypoint
RMBwaypoint, cross-track error, VMG
XTEcross-track error
WPLwaypoint position
RTEroute: list of waypoints

The cross-track error (XTE) is the distance between the boat and the line joining the previous waypoint to the next. Waypoint names are sent in capitals and limited to 10 characters, without accents or commas: a name that is too long makes some instruments reject the whole sentence. Check your autopilot’s manual to see which sentences it expects; APB and RMB are the most common.

NKE outputs

“NKE Outputs” sends proprietary NKE sentences:

  • “Gyrographic”, “Performance data”: the polar’s target speed, the target VMG angle and the speed efficiency;
  • “Multigraphic”, “Dynamic data”: up to eight values, one per “Channel 1” to “Channel 8”.

For each channel: “–” (nothing), STW_TGT (target speed), STW_EFF (speed efficiency), VMG, VMG_TGT (target VMG), VMG_TGT_ANG (target VMG angle), VMG_EFF (VMG efficiency), BTW (bearing to waypoint), DTW (distance to waypoint), VMC (velocity made good to the waypoint), TTG (time to go), D2LL and T2LL (distance and time to the layline).

These headings do not reserve the data for Gyrographic and Multigraphic displays. NavimetriX sends its sentences to the NKE box (Wi-Fi Box or USB Box), which converts them into channels on the Topline bus, the network of NKE instruments. The displays on the bus then read these channels, in particular Multigraphic and Multidisplay units, first generation and II alike. The “Auto Pilot” block sentences follow the same path:

Turn on in NavimetriXData available on NKE displays
BWC or RMBdistance and bearing to the waypoint (“Distance to Waypoint”, “Bearing to Waypoint”)
APB, RMB or XTEcross-track error (“Cross-Track Error”)
“Dynamic data”channels 1 to 8
“Performance data”target speed, optimum wind angle and efficiency, depending on the display

To show this data on the display:

  • Multigraphic II and Multidisplay II: choose the value in the “GPS” group for distance, bearing and cross-track error, and in the “Customs” group (dynamic channels) for channels 1 to 8. The Waypoint and XTE pages are available when a waypoint is active on the bus.
  • First-generation Multigraphic and Multidisplay: channels 1 to 8 are named DYN1 to DYN8. They appear on the 4+4 page of the Multigraphic and on the 4/4 and 1/1 pages of the Multidisplay.

“Channel 1” in NavimetriX corresponds to DYN1, and so on up to “Channel 8”.

The NKE autopilot uses the same data in its GPS mode (XTE, with BWC or RMB): the warning in the “Autopilot” section above applies.

Initializing the NKE box

The box has to learn which sentences it receives: it only passes on to the bus the channels created during an initialization. Without this step, the sentences leave NavimetriX but do not reach the displays. It only needs to be done once.

  1. Connect the device to the box and set up the link with “Scan NMEA devices” (see NMEA 0183 connection): the scan also fills in the address the outputs are sent to. For a Wi-Fi Box set up by hand: “TCP”, address 192.168.56.1, port 50000.
  2. In “NMEA Outputs”, turn on the sentences and channels you want, then start a destination (a “Goto” to a POI or a route being followed): without a destination, the waypoint data is not sent.
  3. In the “Incoming NMEA sentences” console, check that everything goes out, in orange: BWC or RMB for the waypoint, PNKEP for the performance data and one PNKEA line per active channel ($PNKEA,AA,1, for “Channel 1”). The box only creates the channels whose sentences it sees, and NavimetriX does not send a value that is unavailable: targets need a polar and wind, the time to go (TTG) needs a boat getting closer to the destination.
  4. Press and hold the INIT button of the box:
    • 3 seconds (3 beeps) for a first initialization: the list of NMEA channels is created anew;
    • 6 seconds if the box already has NMEA channels to keep, for example those of a wired GPS: the new ones are added to the existing ones.
  5. The box listens for 10 seconds while beeping, ends with a long beep, then gives one beep per channel created. If no beep follows the long one, it has not received any NMEA sentences: check the link and start again.

The channels created stay in the box’s memory and come back at each start-up. Repeat the 6-second initialization only if you later turn on another sentence or channel.

Data already supplied by an instrument on the bus, such as a Topline GPS, keeps priority: the equivalent NMEA channel is not created.

If NavimetriX is connected to the wired NMEA input of a Multigraphic II or Multidisplay II rather than to a box, the initialization is started from the display: parameters, maintenance, external devices, NMEA input.

PIXEL outputs

“PIXEL Outputs” sends data to PIXEL EXOCET displays, over UDP to the display’s “IP address” (192.168.100.251 by default):

  • “Performance”: polar speed and percentage achieved, polar VMG and percentage achieved, target VMG angle and speed;
  • “Waypoint”: bearing, distance and time remaining to the active waypoint;
  • “Current”: the current forecast at the boat’s position, taken from the displayed current GRIB, otherwise from the current atlases, multiplied by the percentage set beside it (80 to 150%, 100% by default).

Relay on local network

Three relays make data available to the other devices on board, without Internet, as a UDP broadcast on the local Wi-Fi network. The relay port is 10111 by default; it must not be a port that one of the device’s links listens on.

  • “Relay device GPS on local network” (visible when “GPS source” is “Internal”): the phone sends its position. A computer without GPS listens to it as an NMEA link over UDP on this port (in advanced mode, as the dedicated GPS link).
  • “Relay device barometer on local network” (“Barometer” block, on a device that has a barometer): the device’s pressure, for a computer or instruments without a barometer.
  • “Relay on local network” (advanced mode, for a UDP, TCP or SERIAL link): what the link receives is re-sent for the other devices. A computer connected to the instruments by USB, or that takes up a gateway’s only TCP slot, can thus feed the whole boat. With UDP, the relay is for devices that only send their data to a single IP address, the device’s own: without it, the other devices on the network would not receive it. Demo data is never relayed. When it is on, the sentences NavimetriX computes for its NMEA and NKE outputs are also broadcast on the local network, on the same port as the received stream; nothing is broadcast in demo mode.

Both devices must be on the same Wi-Fi network; some routers isolate their clients from one another. The app must stay open on the device that relays.

Sharing without a local network

To follow the boat from ashore, the remote cockpit goes through the Internet: see Remote cockpit.

See also

↑ Contents

10.6 NMEA log

Expert

The essentials

NavimetriX records all the NMEA sentences received in one file per day: it is the black box of your passages. These files can then be replayed in the app, exported for external tools or sent to support.

The settings are in “Settings”, “GPS & NMEA”, in the block below “Barometer”:

  1. “Enable NMEA logging”: on by default.
  2. “Log retention”: how many days to keep the files.
  3. “Compress logs after”: after how many days to compress them.
  4. “Export log files” (“Share log files” on phones and tablets): choose files and save or send them.

“Export NMEA Logs” window: list of navimetrix_nmea_YYYYMMDD files with size and date, two files ticked, “Select All”, “Cancel” and “Export” buttons“Export NMEA Logs” window: list of navimetrix_nmea_YYYYMMDD files with size and date, two files ticked, “Select All”, “Cancel” and “Export” buttons

Going further

Settings

SettingValuesDefault
“Enable NMEA logging”yes or noyes
“Log retention”1 to 365 days60 days
“Compress logs after”1 to 30 days7 days

Recording is grayed out in “DEMO” mode: demo data is never recorded.

What is recorded

  • All the sentences received, from all links. Sentences that do not come from the instruments carry an origin marker in standard NMEA format: the file remains readable by NMEA tools, and a replay knows where each sentence came from.
  • When the position comes from the device’s GPS, it is recorded too, as RMC sentences, at most one per second: a passage made with the phone’s GPS can therefore also be replayed.

Files are named navimetrix_nmea_YYYYMMDD.txt, one per day. A file that exceeds 100 MB is closed and a new one begins. After the “Compress logs after” delay, the file is compressed (.txt.gz); after the “Log retention”, it is deleted. An uncompressed daily file can weigh several tens of megabytes; compressed, it is only a fraction of its size.

Exporting or sharing

“Export log files” (or “Share log files”) opens the list of files, with the size and date of each:

  1. Tick the files you want, or tap “Select All”. The number of files and the total size are displayed.
  2. Tap “Export” (computer) or “Share” (phone and tablet).
  • On a computer, the files are copied to the Downloads folder. Compressed files are decompressed there, as .txt.
  • On phones and tablets, the files are compressed and then sent together through the system share sheet (email, messaging, files…): a day of sailing thus stays under the maximum size of an attachment.

Today’s file is completed just before the export, so that the copy is up to date.

Replaying logs

The “Tracks” tab of the left drawer imports NMEA logs (including compressed ones) and turns them into tracks, with their navigation log. See Importing and exporting tracks.

Exported files can also be read with external NMEA players.

Copying the console for support

For a quick diagnosis, the “Incoming NMEA sentences” console, at the bottom of the page, is often enough: tap “Copy”, then paste the text into your message. Each line is marked [IN] (received) or [OUT] (sent); the console keeps the last 200 lines. See NMEA 0183 connection.

See also

↑ Contents

10.7 AIS targets

Beginner

The essentials

AIS (Automatic Identification System) is the system through which vessels broadcast their identity, position, course and speed over VHF. NavimetriX displays these vessels, the targets, and calculates for each one the CPA (the minimum distance at which it will pass you) and the TCPA (the time remaining before this closest point of approach).

Targets arrive in two ways:

  • through your AIS receiver or transponder, over the NMEA link (!AIVDM sentences): Premium subscription, “NMEA” switch on (see NMEA 0183 connection);
  • over the Internet, without any equipment: see Internet AIS and sharing.

To see them:

  1. In the right-hand “Settings” drawer, “AIS” section, check that “Display AIS targets” is on (it is by default). The “AIS targets” box in the layers menu does the same thing.
  2. Tap a target to select it: its name (or its MMSI, the vessel’s identification number) and its average speeds are displayed, along with its track.
  3. Long-press a target to open its detailed sheet.
  4. Open the “AIS” tab of the left drawer for the list of all targets.

Scaled vessel silhouettes, at high zoomScaled vessel silhouettes, at high zoom

Going further

Display settings

SettingValuesDefault
“Display AIS targets”yes or noyes
“Display boat name & speed”yes or nono
“Remove lost targets after”1 to 60 min20 min
“COG vector length”0 to 60 min, in steps of 510 min
“Display track”“All” or “Selected”Selected
“Track length”0 to 360 min, in steps of 510 min
“Hide Class B AIS targets”yes or nono
  • Name and speed: a label next to each target. Handy offshore, cluttered near the coast.
  • Lost targets: a target that stops sending messages gradually fades, then disappears after the set delay.
  • COG vector: a line in the direction of the target’s course over ground, whose length represents the distance covered in that time.
  • Track: the recent path of the targets, for all of them or only for those you have selected.
  • Class B: class B transponders mostly equip pleasure craft, class A commercial ships. Hiding them declutters the chart in a crowded race start.

CPA and TCPA alarms

The CPA (Closest Point of Approach) is the predicted minimum distance of approach between two vessels. The TCPA (Time to CPA) is the time remaining before that point.

SettingValuesDefault
“Alarm if CPA less than”0 to 20.0 nm, in steps of 0.10.5 nm
“Alarm if TCPA less than”0 to 60 min10 min
“Sound alarm”yes or nono
“Draw CPA line”yes or nono

A target goes into alarm when both conditions are met for 15 seconds in a row: its CPA is below the threshold and so is its TCPA (the closest approach is still to come). The target’s icon turns red (a different icon in color-blind mode). “Sound alarm” adds a sound. “Draw CPA line” draws on the chart the point where the target and your boat will be at the moment of closest approach.

Collision alarms do not exist in the browser version, which cannot keep watch in the background. The other navigation alarms are described in Navigation alarms.

On the chart

  • Tapping a target selects it (a circle surrounds it) and displays its track; tapping again deselects it.
  • Long press: selection and detailed sheet.
  • At high zoom, when a vessel’s real length exceeds a few millimeters on the screen, its silhouette is drawn to scale and in its orientation, from the dimensions it broadcasts: you can see where it really is relative to its antenna.

Icons

IconMeaning
Triangleclass A vessel
Chevronclass B vessel
Greentarget received by your AIS receiver
Bluetarget received over the Internet
Redtarget in collision alarm
Dedicated shapesclass A vessel fishing, at anchor or restricted in her ability to maneuver
Specific symbolaid to navigation (AtoN, real or virtual), base station, search and rescue aircraft
Distress symbolSART beacon (MMSI starting with 970, 972 or 974)

A vessel that also broadcasts weather appears in light blue; a base station or an aid to navigation that broadcasts weather appears as a cyan square. In-situ weather stations are described in In-situ stations and weather boats.

The detailed sheet

A long press opens the target’s sheet. Depending on what the vessel broadcasts, it contains:

  • the MMSI, flag, name, navigation status (underway, at anchor, fishing…), position;
  • the instantaneous speed over ground and the speed averaged over 5 and 20 minutes, the course over ground and the heading;
  • when your boat’s position is known: the distance and bearing, the CPA and TCPA, and whether you will cross ahead of or astern of the target;
  • the age of the last position;
  • additional information: call sign, IMO number, vessel type, length, beam, draft, destination;
  • for a target that broadcasts weather: wind, gusts, pressure, temperatures, current;
  • a link to the vessel’s page on VesselFinder (Internet).

The sheet can be moved, and switches to two columns in landscape.

The AIS tab list

The “AIS” tab of the left drawer lists the targets. At the top, the “Targets” / “Fleet” selector: the fleet compares selected boats with yours (see AIS fleets).

Each row gives the MMSI and name, the instantaneous speed over ground and over 5 and 20 minutes, the course over ground, the distance, the bearing, the CPA and the TCPA. A colored bar on the left summarizes the status:

ColorStatus
Greennormal
YellowCPA and TCPA below twice the alarm thresholds
Redalarm active
GrayCPA cannot be calculated
Orange (the app’s color)your boat
  • “Sort”: “by risk ↓” (default: targets with the lowest CPA and TCPA first), “by MMSI”, “by name”, “by CPA”, “by TCPA”, “by distance”, “by sog ↓”, “by sog5mn ↓”, “by sog20mn ↓”. Sorting by average speed is very useful in racing.
  • Filter: the “Filter by name, MMSI, alarm or class (A/B)” field accepts part of a name, digits of the MMSI, “A” or “B” for the class, and “alarm” to keep only the targets in alarm.
  • Tapping a row centers the chart on the target and selects it.
  • The flag on the right of a row adds the target to the active fleet, or removes it.

See also

↑ Contents

10.8 Internet AIS and sharing

Beginner

The essentials

Without an AIS receiver on board, NavimetriX can display the vessels that the shore stations of the AISHub network receive and publish on the Internet. Conversely, your boat can share what it receives and measures, and even make itself visible to other NavimetriX users without a transponder.

We recommend that all users share their AIS feed, so that coverage is as good as possible for everyone.

These features require the Premium subscription and an Internet connection. In the browser version, only the display of Internet AIS is available.

To see Internet AIS:

  1. In “Settings”, “AIS” section, check that “AIS over Internet” is on (it is by default).
  2. Zoom in far enough on the chart: Internet targets are only requested from the approach to a harbor, when the chart covers a few miles.
  3. The targets appear in blue, unlike targets received on board, which are green.

AIS targets received over the Internet off the Lorient roadstead and the Île de Groix: the target list in the left drawer (AIS tab), the “AIS Info” sheet of a selected target and the target triangles on the chart; names and MMSI numbers blurredAIS targets received over the Internet off the Lorient roadstead and the Île de Groix: the target list in the left drawer (AIS tab), the “AIS Info” sheet of a selected target and the target triangles on the chart; names and MMSI numbers blurred

Warning: Internet targets are for information only. They go through shore stations and the network, with a delay, and do not cover everything. They do not replace an AIS receiver for safety.

Going further

How Internet AIS works

SettingDefault
“AIS over Internet”on
  • Targets are requested within a radius around your boat when you are navigating (Navigation mode, GPS position, speed above 0.8 knots), otherwise around the center of the screen. The radius is 50 nautical miles by default, automatically reduced in very busy areas.
  • When the view is wider than a harbor approach, Internet targets are removed from the chart, and a message invites you to zoom in.
  • They are displayed even outside Navigation mode.
  • During a track replay or while following another boat, Internet AIS is switched off.

For everything else, Internet targets behave like targets received on board: selection, detailed sheet, list, alarms. See AIS targets.

Sharing the AIS data received on board

SettingDefault
“Share AIS data”on

If you have an AIS receiver, NavimetriX sends the targets it receives back to the AISHub network, along with the AIS position of your own boat if your transponder sends it. This improves the network’s coverage where you sail. Sharing only works with Internet, never in “DEMO” mode.

Sharing the weather data from your boat

SettingDefault
“Share weather data”on

Every 10 seconds, NavimetriX sends the weather measured on board (true wind, gusts, pressure, air and water temperatures) over the Internet as an AIS weather message. True wind must be available (instruments with a wind vane and anemometer). The message carries your boat’s MMSI if it is entered in “My Boat”, otherwise an identifier specific to the device. Never in “DEMO” mode, nor during a replay or while following another boat.

Vessels that broadcast their weather appear on the chart in light blue, and their sheet shows a “Weather” block.

Sharing my position without a transponder

SettingLocationDefault
“Share my position”“Settings”, “My Boat”, “AIS broadcast” blockoff

For a boat without an AIS transponder: every 10 seconds, NavimetriX sends your position as a class B transponder would, with the name and type of the boat. This position is sent to the NavimetriX servers. It is never transmitted on VHF.

Conditions: Premium subscription, Internet, a valid GPS position; never in “DEMO” mode, nor during a replay or while following another boat. Enter the name and, if you have one, the MMSI of your boat in “My Boat” (see My boat).

This broadcast does not make your boat visible to other vessels equipped with AIS: it does not replace a transponder.

Following a boat remotely

To follow the boat instrument by instrument from another of your devices, signed in to the same account, use the remote cockpit (“GPS & NMEA” page, “Remote cockpit” block): see Remote cockpit. For a friend or family member, share the link to the current track instead, which can be followed live: see Sharing a track.

See also

↑ Contents

10.9 Chart navigation tools

Beginner

The essentials

The chart carries several navigation tools. The most useful:

  • The target: the cross at the center of the screen. It designates the point read by the automatic measure, the weather values and “Route to the target”.
  • The automatic measure: tick “Auto measure” in the layers menu; each time the chart is moved, an arrow links the boat to the target with the distance, bearing and time to get there.
  • Manual measures: “+” button, then “Add a measure”. Drag the ends; tap the label in the middle to delete the measure.
  • In Navigation mode: the COG vector (course over ground) and the heading line ahead of the boat, the cross-track corridor and the laylines to the waypoint of a “Goto”.

Navigation mode with a “Goto” to a POI upwind: red COG vector, green heading line, route corridor, green laylines to the POI and a manual measure with its distance and its two bearingsNavigation mode with a “Goto” to a POI upwind: red COG vector, green heading line, route corridor, green laylines to the POI and a manual measure with its distance and its two bearings

Going further

The target

By default, the target is at the center of the screen: drag the chart underneath it and zoom to place it precisely. In the layers menu, “Forecast display” section, the “Target” list offers:

  • “Disabled”: no more target on screen;
  • “Screen center” (default);
  • “GPS position”: the target follows your boat;
  • one of your visible POIs: the target locks onto it. The lock can also be set in a POI’s window.

The target can be set at any time, with or without a GRIB loaded. On tablets and phones, it is also used to choose an isochrone point for a routing from a pivot point (see Studying your routing and pivot points).

COG vector and heading line

In Navigation mode, two markers extend from the boat. They are set in “Settings”, “My Boat”:

SettingValuesDefault
“COG vector”, “Duration”0 to 300 min60 min
“COG vector”, “Arrow”yes or noyes
“COG vector”, “Color”your choicered
“Heading line”, “Length”0 to 300 NM60 NM
“Heading line”, “Color”your choicegreen
  • The COG vector follows the course over ground. Its length is the distance covered during the set duration, at the current speed over ground: 30 minutes at 6 knots gives a 3-mile vector. It therefore lengthens and shortens with speed.
  • The heading line follows the boat’s heading (HDG), over a fixed length. It only appears if NavimetriX receives a heading (compass from the instruments).

The cross-track corridor (XTE)

The cross-track error (XTE) is the distance between the boat and the line joining the starting point to the target waypoint. In Navigation mode, with a “Goto” in progress, the chart draws a semi-transparent corridor on either side of this line, bordered on the port side and the starboard side. It appears from the view of a harbor.

SettingLocationValuesDefault
“XTE” (width on each side)“Settings”, “Alarms”, “Cross-Track Error” (or “My Boat”, “XTE limit”)0 to 2000 m, in steps of 10500 m
“Active”“Alarms”, “Cross-Track Error”yes or nono
“Sound”“Alarms”, “Cross-Track Error”list of sounds

The corridor is displayed whether the alarm is enabled or not. When enabled, the alarm sounds when the boat leaves the corridor. See Navigation alarms.

Laylines

A layline is the closest-hauled (or deepest downwind) course that leads straight to the waypoint without tacking again: once on it, it is time to tack or gybe. It depends on the wind, the current and the boat’s polar (best VMG angles).

Laylines are displayed when:

  • Navigation mode is active;
  • a waypoint is targeted by a “Goto”;
  • the boat is moving and getting closer to the waypoint (they disappear if you move away from it);
  • the “Laylines” box in the layers menu is ticked (the default).

The green layline corresponds to the starboard tack, the red one to the port tack (colors adapted in color-blind mode). The “Distance to layline” and “Time to layline” instruments give the distance and time remaining before the tack. Their smoothing is set in “Instruments”, “Damping”, “Laylines and waypoint” group (see Instrument types).

Manual measures

A measure is an arrow between two points, which stays on the chart until you delete it.

  • Create: “+” button, “Add a measure”. If the boat is moving, the measure starts from the boat and follows it; otherwise, it starts from the center of the screen. On a computer, right-clicking the chart also offers “Add a measure”, which starts from the clicked point.
  • With two fingers (touch screen): place two fingers on the chart and hold them still for a little over half a second: a measure is created between the two fingers.
  • Read: the distance in the middle, and a double bearing at the ends: the bearing from the origin to the end, and the reciprocal bearing, each with a small direction arrow. When the arrow is too short on screen, the bearings, then the label, are hidden.
  • Adjust: drag an end. It snaps to a POI, an AIS target or the boat, then follows moving targets; the label then shows the name of the object it is attached to.
  • Delete: tap (click) the label in the middle (on a computer, a red cross appears on hover), or tap an end then “Delete measure”.

The automatic measure

SettingLocationDefault
“Auto measure”layers menu, “Display” sectionno

Each time the chart is tapped or moved, an arrow links the boat to the target at the center of the screen, then fades out two seconds after the last gesture. It needs a boat position. The label gives:

  • the distance and bearing;
  • the time to reach the point, calculated from your averaged speed over ground (30 seconds by default, “Laylines and waypoint” damping) and projected toward the point. It only appears if the boat is getting closer to the point (at least 0.3 knots toward it) and if it takes less than 99 hours; under 3 minutes, it is given to the second;
  • with true wind on board, the wind angle at which this course would be sailed, with the tack (“P” or “S”), and the sail to carry if your polar has a Sailchart. These two values are the first to disappear when space is short.

The cursor measure (computer)

SettingLocationDefault
“Cursor measure”layers menu, “Display” sectionno

On a computer, a line links the boat to the mouse pointer, with the distance, bearing and time to get there, without moving the chart. Over a POI, it measures to the POI and names it. The box does not exist on a touch screen, where a finger does not hover over the chart.

See also

↑ Contents

↑ Contents

11 Instruments

Instruments display the boat’s data in real time, received from the GPS and the navigation instruments. This chapter explains how to build the instrument bar and place instruments on the chart, then presents each of the 19 instruments. Three pages cover the richest ones in detail: Course tracking, the instruments that tell you which sail to carry, and the barometer with its ten-day barograph.

11.1 Instrument bar and instruments on the chart

Beginner

The essentials

Instruments display the boat’s data in real time: position, speed, wind, depth, performance. They are arranged in a bar, at the top of the screen when the window is taller than it is wide, in a column at the side otherwise. Each instrument can also be placed on the chart, where it can be freely moved and resized.

  1. Add: tap the round orange “+” button at the bottom right, then “Add instrument”. Choose an instrument in the grid, then “Add to instrument bar” or “Add to chart”.
  2. Place at a precise spot: right-click (computer) or long-press (tablet, phone) on the chart, then “Add instrument”. The chosen instrument is placed where you touched.
  3. Set: right-click or long-press the instrument. Its settings open, with a preview that follows your changes.
  4. Move: drag a tile along the bar to change its rank, or across the bar to place it on the chart. Released on the bar, an instrument from the chart takes its place there.
  5. Delete: “Delete” button in the instrument’s settings, then confirm.

The instrument bar in a column to the right of the chartThe instrument bar in a column to the right of the chart

Values are displayed in Navigation mode, during a Replay, or as soon as an NMEA connection sends data. NMEA is the protocol through which the boat’s electronics (navigation instruments, anemometer, depth sounder, GPS) transmit their measurements. Navigation mode and the NMEA connection both require the Premium subscription. In Navigation mode, the device’s GPS is enough for position, speed over ground and course over ground; wind, speed through water or depth come from the instruments, over NMEA.

Going further

The “Add instrument” grid

Each card in the grid shows an animated preview of the instrument, fed by the boat’s real data. The same instrument can be added several times: an orange badge shows how many copies are already displayed. You can, for example, place several “Numeric value” tiles, each with its own data.

An instrument added to the bar is placed at the head of the bar, to be visible immediately. If instruments were hidden, adding one shows them again.

The “Add instrument” grid, opened from the right-click menuThe “Add instrument” grid, opened from the right-click menu

An instrument’s settings

Right-clicking or long-pressing an instrument opens its settings window directly: the instrument’s name, a large preview, then the settings specific to its type (see Instrument types). You will always find:

  • “Square tile background”, for round dials: the dial is displayed on a square tile rather than on a disc;
  • “Delete”, which removes this copy after asking for confirmation;
  • “Close”.

Most settings apply to this copy only: two “Numeric value” tiles show two different pieces of data. A few toggles are shared by all copies of a type: the wind angle (TWA or AWA) and the boat speed (STW or SOG) of the “Wind dial”, the angle of the “Close-hauled wind” instrument, the window and average of the “Wind plot”.

Reordering, placing on the chart, resizing

  • Change the order: drag the tile along the bar; a slot opens where it will be inserted. On a touch screen, a long press first “lifts” the tile: a quick swipe scrolls the bar without moving anything.
  • Place on the chart: drag the tile across the bar. It becomes a floating instrument. On the chart, a grid and alignment lines appear while you move it.
  • Put back in the bar: release the floating instrument on the bar, where you want it.
  • Resize the bar: with a mouse, drag its edge on the chart side; a double click makes the size automatic. On a touch screen, a small handle on the border does the same, and a double tap makes the size automatic.
  • Resize a tile in the bar: rectangular tiles (graphs, Course tracking…) have a handle in their lower right corner.
  • Resize an instrument on the chart: corner handle with a mouse, two-finger pinch on a touch screen.

Round dials stay round on the chart, unless you have ticked “Square tile background”.

On tablets and phones, the layout (bar and floating instruments) and the size of the bar are remembered separately in portrait and landscape: each orientation keeps its own arrangement.

The Settings > Instruments page

Open Settings with the “‹” handle at the right edge of the screen, then “Instruments”.

SettingEffectValuesDefault
“Visible”Shows or hides all instruments, bar and chartYes / noNo
“Bar visible”Collapses the bar only; instruments placed on the chart stay displayedYes / noYes
“Tile titles”Tile titles as acronyms (SOG, TWA, BTW…) or as names (Speed over ground…)“Acronyms”, “Names”Acronyms on a screen under 7 inches, names elsewhere
“Damping”Smoothing of values, see below
“Sparkline duration”Period covered by the small curve of numeric tiles5 to 60 min5 min
“Orientation”Bar at the top or in a column“Auto”, “Horizontal”, “Vertical”Auto

In “Auto”, the bar goes to the top when the window is taller than it is wide, and in a column otherwise.

The “Visible” choice is remembered separately for Navigation mode on and off. The window shown when you switch Navigation mode also offers the “Show instruments” box.

The sparkline is ticked or unticked tile by tile, in the settings of each “Numeric value”. It is only drawn in Navigation mode, and only for data that lends itself to it: never for a time, a position or a name, for example.

Predefined layouts

At the bottom of the same page, “Load” offers four ready-made layouts, and those you have saved:

  • “GPS”: GPS time, speed and course over ground, latitude, longitude, name, distance, bearing and time to the waypoint;
  • “Cruising”: Wind dial, speed over ground, course over ground, speed through water, true wind direction and speed, depth, distance, bearing and time to the waypoint;
  • “Upwind”: Close-hauled wind, Wind plot, Polar performance, then speed through water, true wind angle and speed, VMG, heading, distance and time to the layline;
  • “Downwind”: Wind dial, Polar performance, then speed over ground, speed through water, true wind direction and speed, VMG, downwind target angle, waypoint VMC.

VMG is the speed of approach along the wind axis; VMC, the speed of approach toward the waypoint; the layline, the line from which you reach the mark on a single tack.

“Save configuration” saves the complete layout under a name: bar order, settings of each tile, instruments placed on the chart with their size and position. “Delete configuration” erases a saved layout.

Layouts are specific to each device: they do not sync between your phone and your computer, whose screens have nothing in common.

Damping

The Damping page, one time per group of valuesThe Damping page, one time per group of values

Settings > Instruments > “Damping” sets the smoothing of values, group by group, from 0 (no smoothing) to 60 seconds. The time chosen is that of a moving average.

GroupSettingValues concernedDefault
Boat“Heading”HDG1 s
“Boat speed”STW3 s
“Speed and course over ground”SOG, COG5 s
“Heel”Clinometer: heel, roll3 s
“Depth”Depth, depth graph3 s
Wind“Apparent wind”AWA, AWS5 s
“True wind”TWA, TWS5 s
“True wind direction”TWD10 s
Computed values“Current”Current speed and direction, frozen when the boat turns30 s
“Performance”VMG, VMC, targets and efficiencies10 s
“Laylines and waypoint”Distance and time to layline, TTG, ETA, time at cursor30 s

The “Default values” button restores these original values. Dials, alarms, laylines and the recorded track follow the damped values; only the RMC and VTG sentences sent out as NMEA output keep the raw speed and course. These settings depend on the boat’s sensors, not on the device: they are tied to your account.

Acronyms: HDG heading, STW speed through water, SOG speed over ground, COG course over ground, AWA and AWS apparent wind angle and speed, TWA, TWS and TWD true wind angle, speed and direction, TTG time to go, ETA estimated time of arrival.

See also

↑ Contents

11.2 Instrument types

Beginner

The essentials

NavimetriX offers 19 instruments. The simplest display a value, the others draw a dial, a curve or a table. Each can be added as many times as you like, in the bar or on the chart (see Instrument bar and instruments on the chart).

  1. For a specific value (speed, heading, depth…), take a “Numeric value” and choose its data.
  2. For two related values (wind strength and direction, waypoint distance and bearing…), take a “Dual tile”.
  3. To read the wind at a glance, take the “Wind dial”, the “Close-hauled wind” or the “Wind plot”.
  4. To follow a trend, take a “Chart (history)” on the data of your choice.
  5. To set an instrument, right-click or long-press it.

Many instruments need the data from the boat’s instruments, received over an NMEA connection (Premium subscription). Those that compare your speed with a target also need a polar, the file that gives the boat’s expected speed for each wind strength and angle.

Going further

A few acronyms come up everywhere. TWA, TWS and TWD: true wind angle, speed and direction. AWA and AWS: apparent wind angle and speed, the wind you feel on board. STW: speed through water, measured by the log. SOG and COG: speed and course over ground, given by the GPS. HDG: heading. VMG: velocity made good, the speed of approach along the wind axis. XTE: cross-track error, the lateral distance from the planned route.

Values
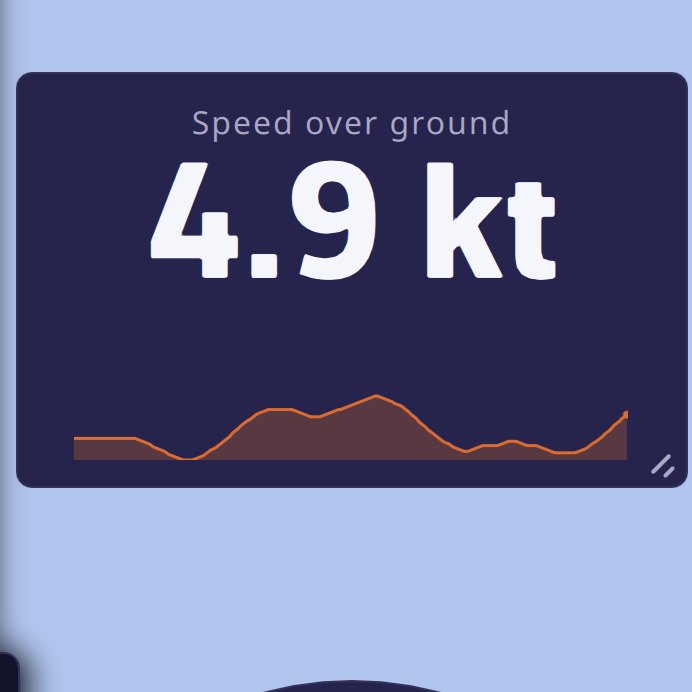
A Numeric value on speed over ground: title, large figure, unit and trend sparklineA Numeric value on speed over ground: title, large figure, unit and trend sparkline

Numeric value. A title, a large figure, its unit and, optionally, a trend sparkline. Settings:

  • “Displayed data”: one of 47 pieces of data, grouped in families: GPS position and time, route and waypoint (active route, distance, bearing, time, arrival time, VMC, cross-track error), satellites and accuracy, speeds over ground averaged over 5 and 20 minutes, onboard measurements (speed through water, heading, true and apparent wind, VMG, current, depth, rudder angle, water and air temperatures, pressure), performance (target speed and VMG, efficiencies, target upwind and downwind angles and VMG), “Sail” (see Which sail to carry), distance and time to the layline;
  • “Mini-graph”: the small curve under the figure, whose duration is set in Settings > Instruments.

Dual tile. Two values in a single tile. The “Contents” setting offers ten pairs: “True wind”, “True wind angle”, “Apparent wind”, “Speed and course over ground”, “Speed through water and heading”, “Current”, “Waypoint”, “Waypoint arrival”, “Layline”, “Depth and water temperature”. It also offers three comparisons with the polar’s target: “STW % of target”, “VMG % of target” and “TWA error to VMG target”. A bar then shows the gap; it turns green when you are within 10% of the target (or 5° for the TWA error), orange beyond.
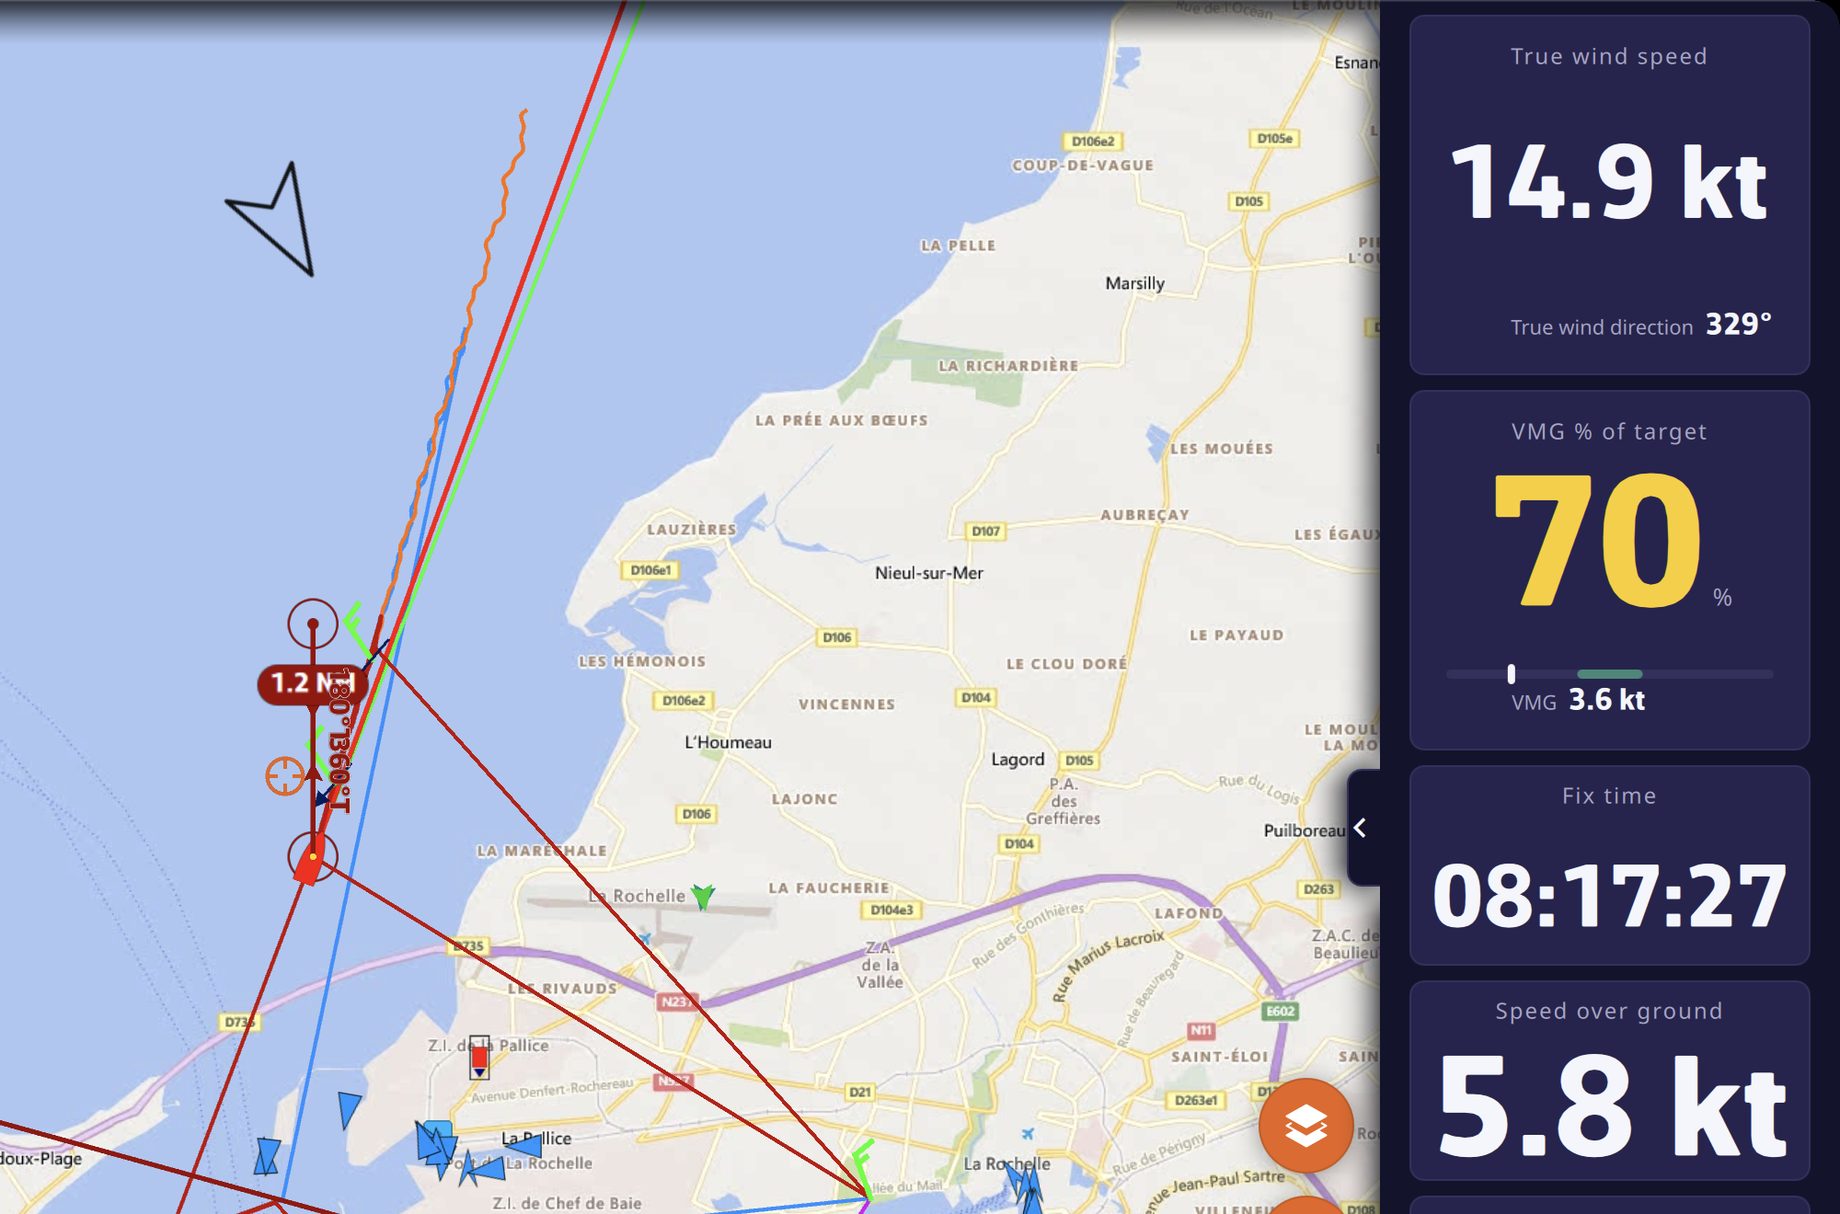
Two Dual tiles at the head of the instrument barTwo Dual tiles at the head of the instrument bar

Wind and heading
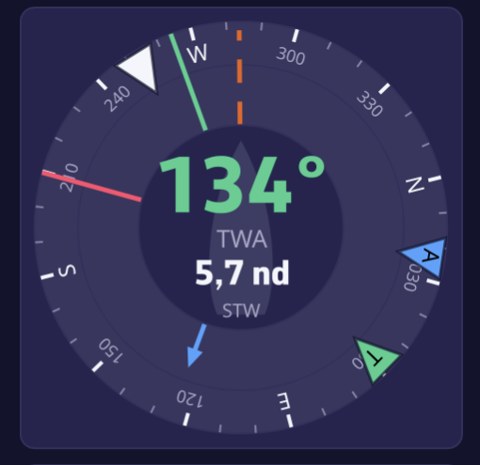
The Wind dialThe Wind dial

Wind dial. A compass rose that turns with the boat’s heading. At the center, the true wind angle and the boat speed. On the rose: the true wind arrow, green or red depending on the tack, the apparent wind arrow in blue, the course over ground dotted, the bearing to the waypoint, the current arrow, and the starboard (green) and port (red) laylines when a waypoint is active. Settings: “Wind angle” (TWA or AWA at the center) and “Boat speed” (STW or SOG).
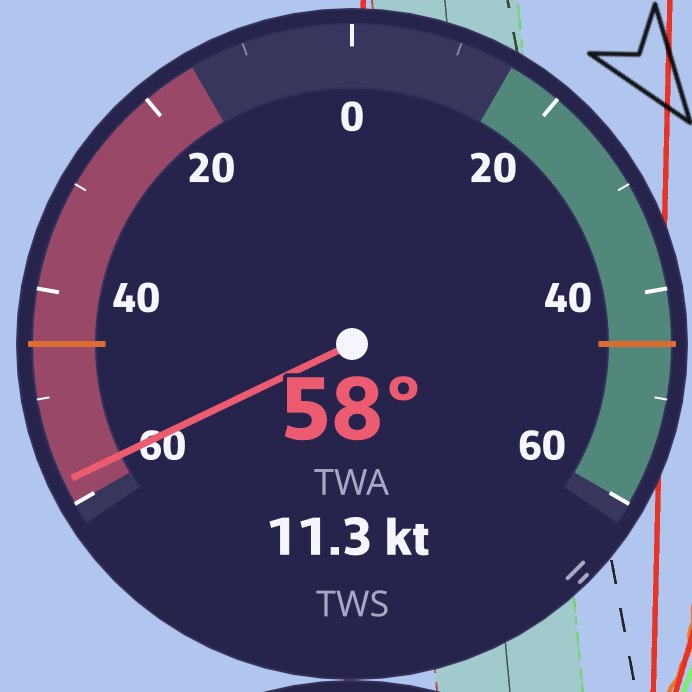
The Close-hauled wind: the wind angle needle on the expanded fan, with the wind angle and speed at the bottomThe Close-hauled wind: the wind angle needle on the expanded fan, with the wind angle and speed at the bottom

Close-hauled wind. A ±60° fan on an expanded scale, for steering upwind. The wind angle needle takes the color of the tack; two markers show the optimal upwind angle taken from the polar. At the bottom, the wind angle and speed. Setting: “Wind angle” (TWA or AWA).
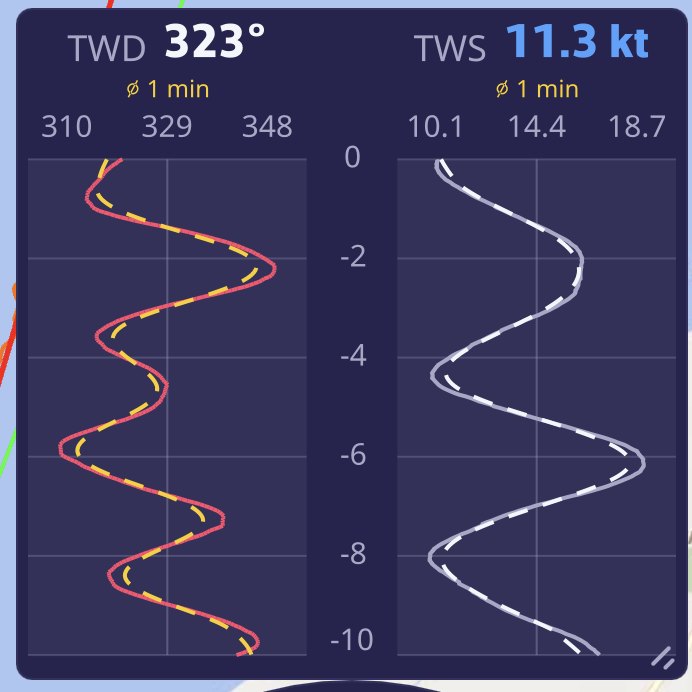
The Wind plot: true wind direction (TWD) and speed (TWS) side by side, with their dotted trendThe Wind plot: true wind direction (TWD) and speed (TWS) side by side, with their dotted trend

Wind plot. The histories of the true wind direction (TWD) and speed (TWS), side by side, with their smoothed trend dotted. The direction curve is red when you are on port tack, green on starboard tack. The tile is drawn in columns when it is tall, in stacked strips when it is wide. Settings: “Time window” (5 min, 10 min, 30 min, 1 h or 3 h; 10 min by default) and “Moving average” of the trend (Off, 30 s, 1 min, 5 min or 15 min; 1 min by default). The history is kept when you move or recreate the instrument.
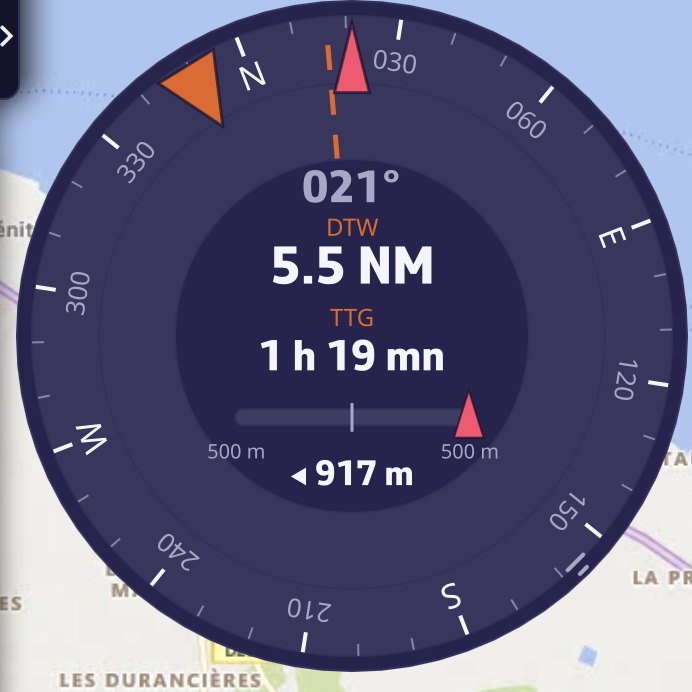
The Steering compass toward a POI: bearing to the waypoint, distance, time remaining and cross-track error barThe Steering compass toward a POI: bearing to the waypoint, distance, time remaining and cross-track error bar

Steering compass. A heading-up rose at the top, with a bow marker, the course over ground dotted, the bearing to the waypoint and the laylines. At the center, the heading. When you are heading to a POI or following a route, it also displays the distance (DTW) and time (TTG) to the waypoint, and a cross-track error bar. The scale of this bar is the corridor of the cross-track alarm (500 m if that alarm is not set).

Performance
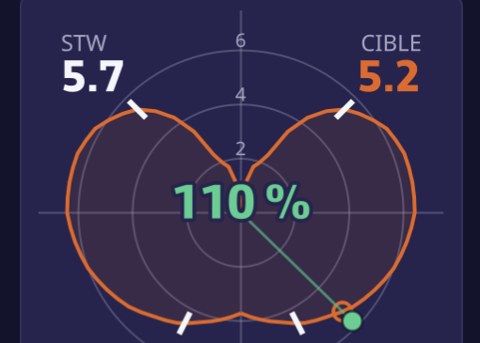
The Polar performanceThe Polar performance

Polar performance. The curve of your polar for the current wind strength, a dot for your speed and angle (colored by tack), the target on the curve, and at the center the percentage of the target achieved. A polar is required; during a Replay, the curve is that of the polar of the boat that recorded the track, when the track contains it.
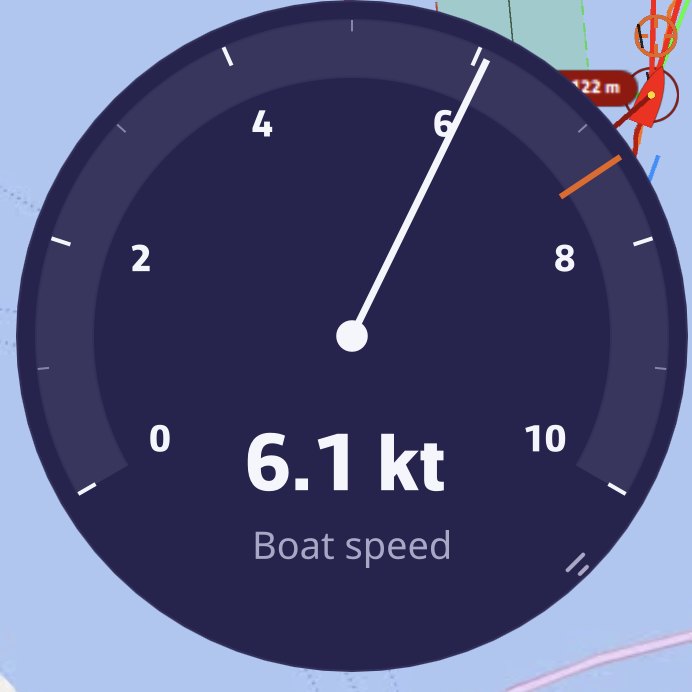
The Needle gauge on boat speed, with the polar’s target speed markerThe Needle gauge on boat speed, with the polar’s target speed marker

Needle gauge. A 240° needle meter for a speed of your choice (“Displayed data”: speeds over ground, speed through water, true and apparent winds, VMG, current, VMC, targets). Its scale grows in steps of 5 and never shrinks, to stay steady to the eye. On boat speed, the default value, it takes the speed over ground if the log says nothing, and marks the polar’s target speed.

Sailchart. Your position on the polar’s Sailchart, with the track of the last few minutes. See Which sail to carry.

Course tracking. What remains to be sailed, mark by mark. See Course tracking.
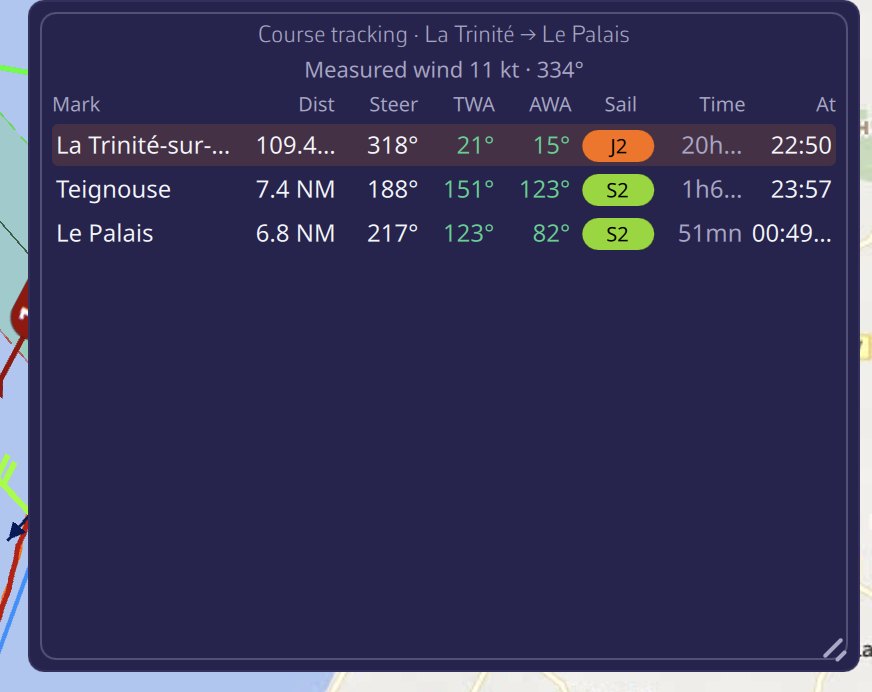
Course tracking: for each mark, the distance, heading, wind angles, sail, duration and time of passageCourse tracking: for each mark, the distance, heading, wind angles, sail, duration and time of passage

On board
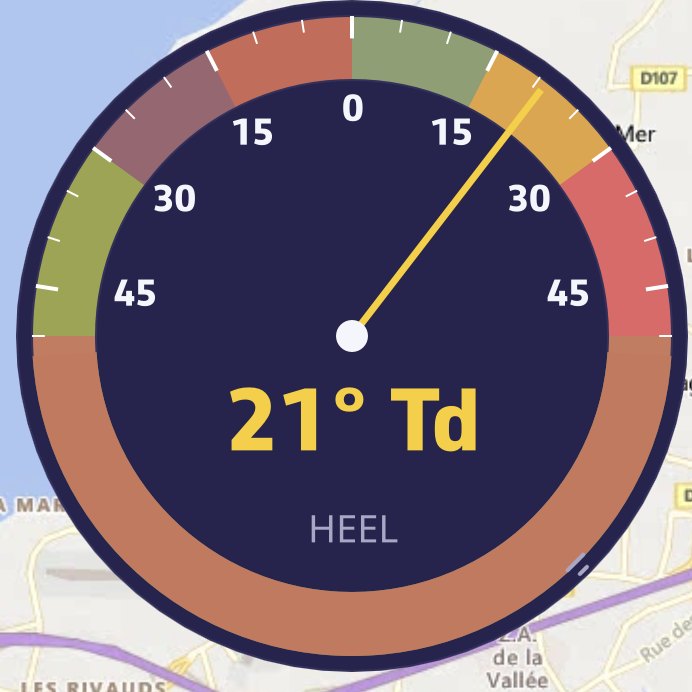
The Clinometer: heel on the ±50° arc and its side, here on starboard tackThe Clinometer: heel on the ±50° arc and its side, here on starboard tack

Clinometer. Heel on a ±50° arc, with three zones: green up to 15°, orange from 15 to 30°, red beyond. The value is followed by the side. It reads the heel sent by the instruments, or failing that the roll.
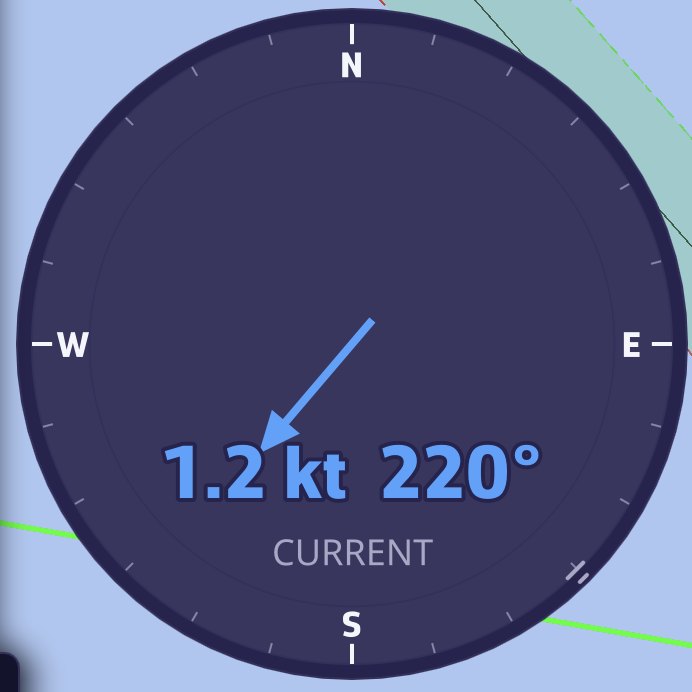
The Current rose: 1.2 kt at 220°, the arrow shows where the current is settingThe Current rose: 1.2 kt at 220°, the arrow shows where the current is setting

Current rose. A north-up rose; the arrow shows where the current is setting, its length follows its speed. Speed and direction are written at the center.
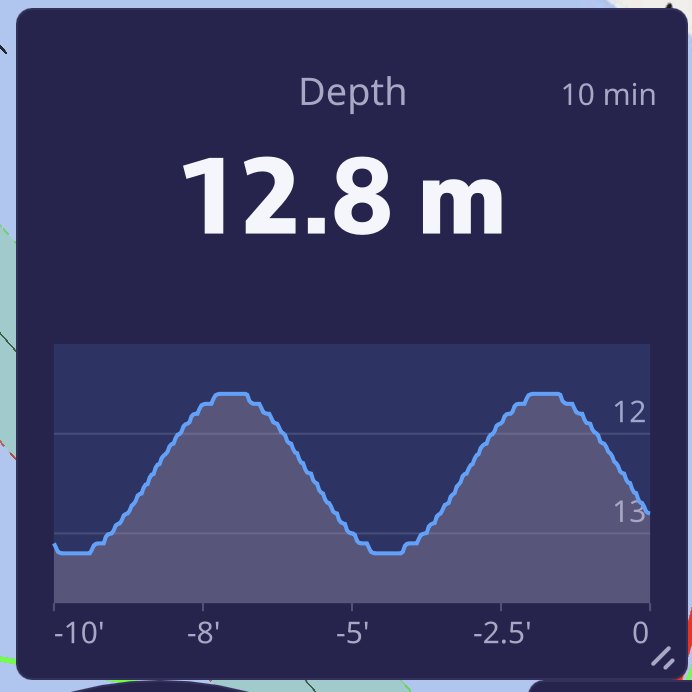
The Chart on depth, in depth sounder style: 13.1 m and the curve of the last 10 minutesThe Chart on depth, in depth sounder style: 13.1 m and the curve of the last 10 minutes

Chart (history). The curve over time of any numeric data. Settings:

  • “Displayed data”: depth by default, with then a depth sounder rendering (bottom, water column, draft);
  • “Time window”: 5 min, 10 min (default), 30 min, 1 h or 3 h;
  • “Moving average”: Off (default), 30 s, 1 min, 5 min or 15 min;
  • “Marker”: a horizontal reference line. “Auto” chooses it according to the data (draft for depth, alarm threshold for wind, 1013 hPa for pressure, 100% for efficiencies); “Manual” lets you enter the value;
  • “Curve color”: remembered for each data and shared by all your devices.

The history, taken every 2 seconds over 3 hours, survives restarts. The tile is laid out according to its shape: horizontal plot when it is wide or square, vertical when it is tall.
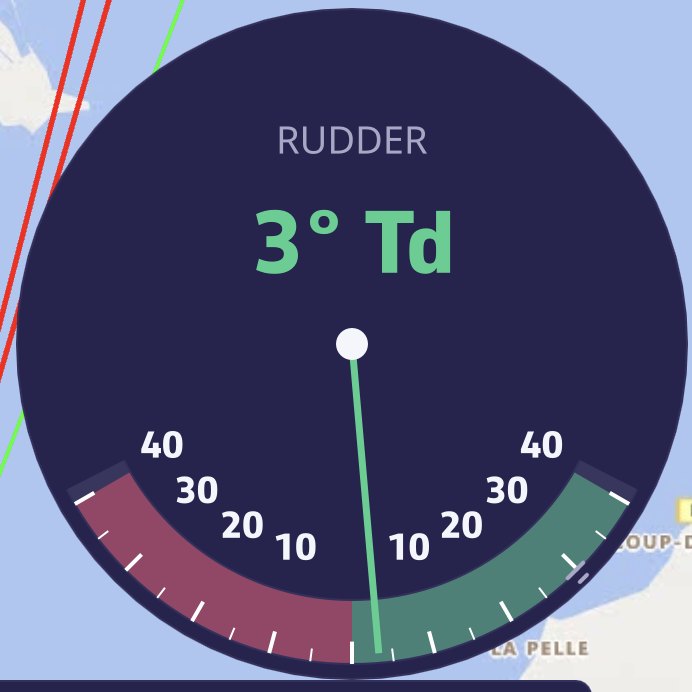
The Rudder angle: 1° to starboard on the ±40° arcThe Rudder angle: 1° to starboard on the ±40° arc

Rudder angle. A ±40° arc, port in red on the left, starboard in green on the right. It needs a rudder angle sensor (NMEA RSA or XDR sentence).
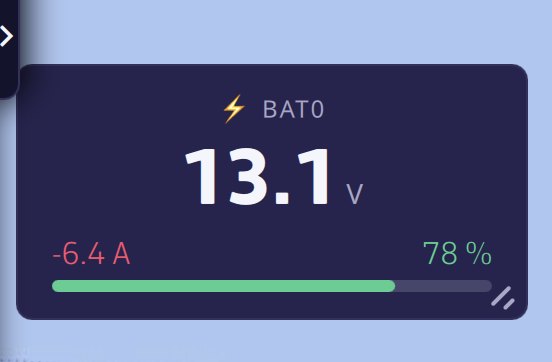
The Energy tile: voltage, discharge current and state of charge of the bankThe Energy tile: voltage, discharge current and state of charge of the bank

Energy (battery). The voltage, current (negative when discharging) and state of charge of a battery bank, received through NMEA XDR sentences. “Battery bank” setting: “Automatic” (the first bank received) or a specific bank.
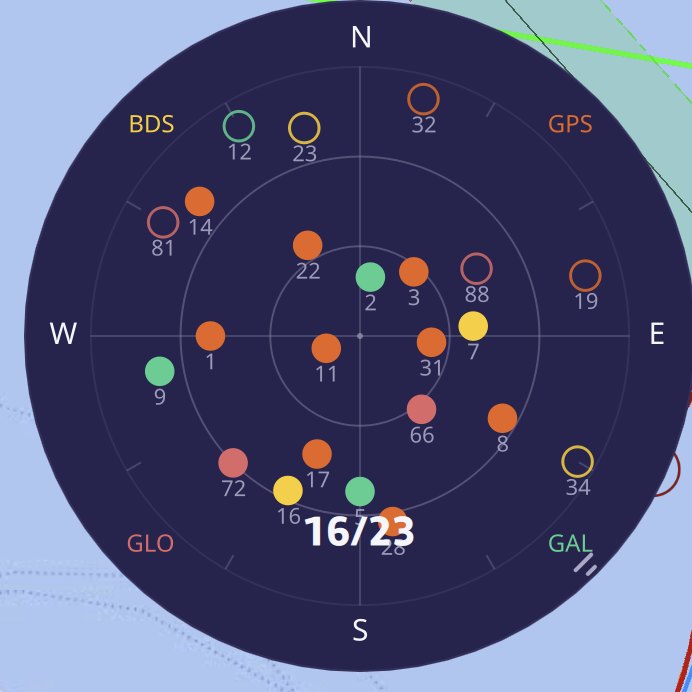
The GNSS satellites: 16 satellites used out of 23 in view, GPS, GLONASS, Galileo and BeiDouThe GNSS satellites: 16 satellites used out of 23 in view, GPS, GLONASS, Galileo and BeiDou

GNSS satellites. The sky map of visible satellites, zenith at the center, horizon at the edge. Each dot takes the color of its constellation (GPS, GLONASS, Galileo, BeiDou, QZSS); it is solid if it is used to compute the position. Satellites come from an NMEA GPS, or from the internal GPS on Android. iOS does not publish them, and a computer has no receiver.

Barometer and Barograph. Pressure and how it changes, see Barometer and barograph.

When an instrument stays empty

A dash or an empty dial means the data is not arriving: no NMEA connection, sensor missing, or Navigation mode off. Comparisons with the target stay empty without a polar. To check what the app is receiving, see Navigation: GPS, NMEA and AIS.

See also
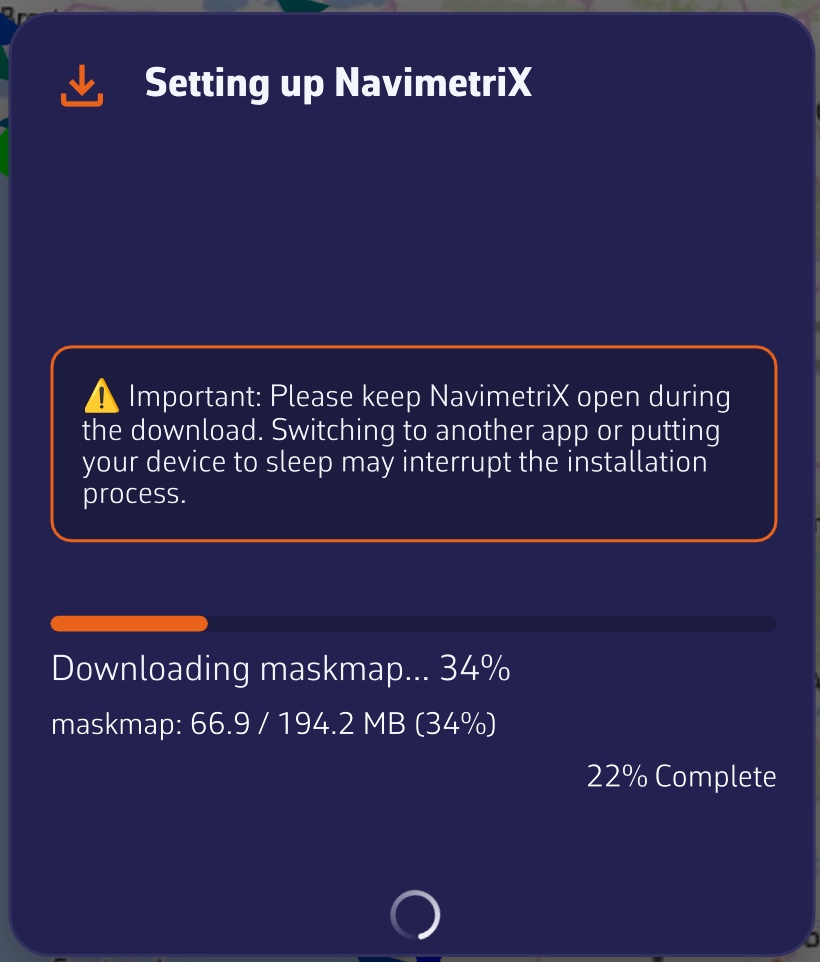
↑ Contents

11.3 Course tracking

Expert

The essentials

When you are following a route or heading to a POI, the “Course tracking” instrument answers the questions you ask yourself on board: is it still far? what heading should I steer? which sail? what time will we reach the next mark? It displays one row per remaining leg, from the boat to the last mark.
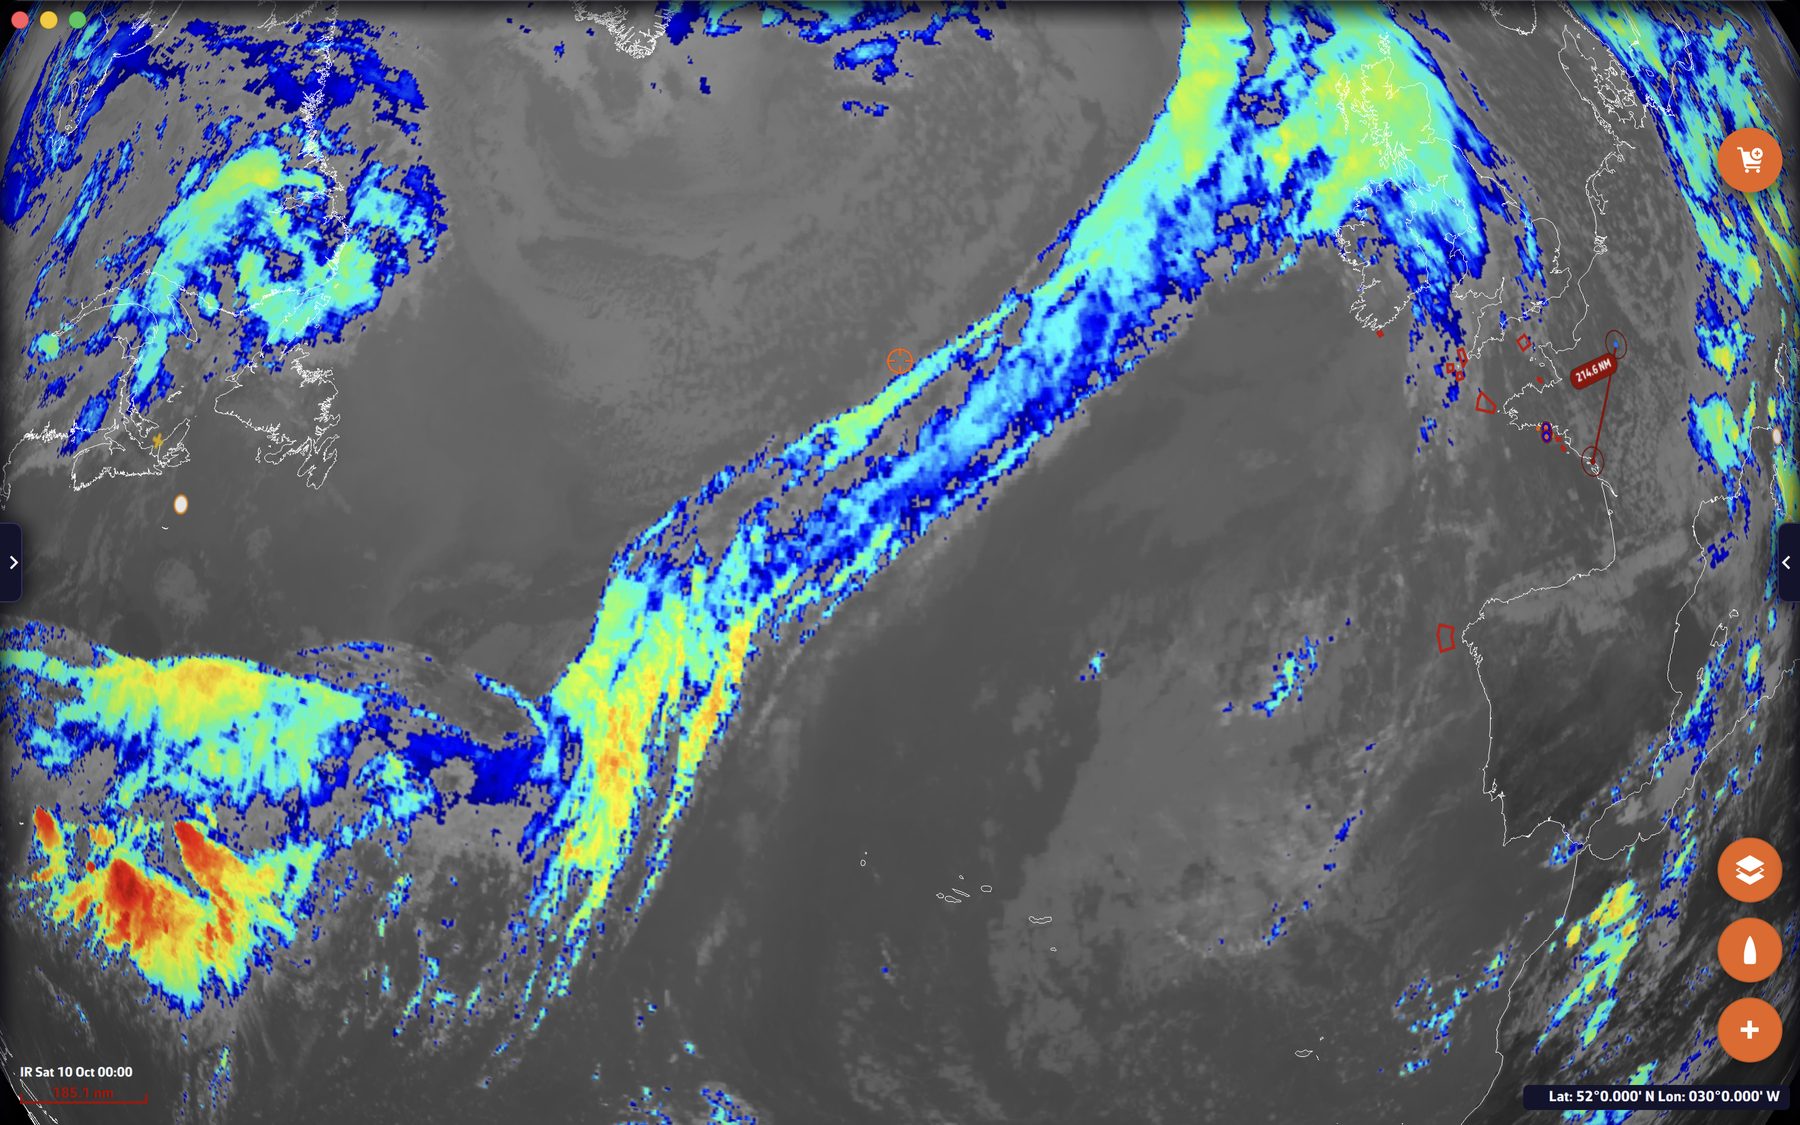
  1. Start navigating to a mark: “Goto” on a POI, or following a route (see POIs, routes and ZOIs).
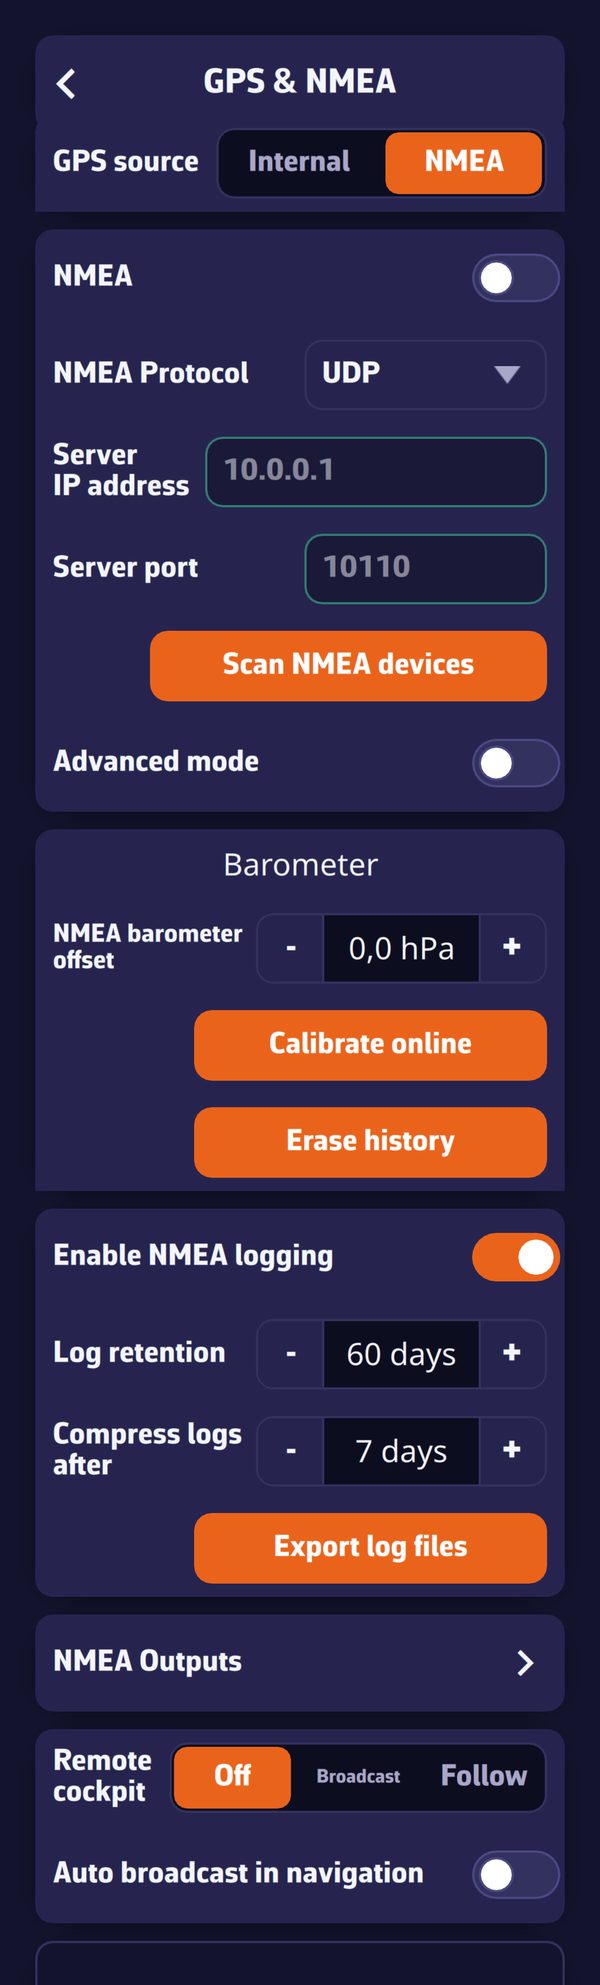
  2. Add the instrument: “+” button, “Add instrument”, “Course tracking”, then “Add to instrument bar” or “Add to chart”.
  3. Widen the tile to see more columns: the handle in the lower right corner in the bar, the corner handle or the pinch on the chart.
  4. Choose the wind used in the instrument’s settings (right-click or long-press), “Wind source” setting.

The Course tracking instrument, all columns displayedThe Course tracking instrument, all columns displayed

The tile’s title shows the name of the route being followed, and the next line the wind used for the calculation (for example “10 min mean wind: 10 kt · 57°”).

Going further

The columns

The tile displays as many columns as its width allows. Narrow, it keeps the essentials; widened, it adds the rest.

ColumnContentVisible
“From”The leg’s starting mark (“Boat” for the first)Widest tile
“Mark”The target markAlways
“Side”The side on which to leave the mark, if specified in the routeWide tile, and at least one mark with a side
“Dist”The leg’s distanceAlways
“Grnd”The course over ground, the actual direction of travelWide tile
“Steer”The heading to hold at the helm, corrected for currentAlways
“TWA”The true wind angle expected on the legAlways
“AWA”The apparent wind angle expectedMedium or wide tile
“Sail”The sail recommended by the Sailchart of your polarAlways
“Time”The planned time for the legMedium or wide tile
“At”The arrival time at the mark, followed by “D+1”, “D+2”… if it falls on another dayAlways

In the “Side” column, a solid arrow indicates a mark to round, a hollow arrow a simple side constraint.

On a narrow tile, each leg becomes a small two-line card rather than a table with truncated cells. The “Text size” setting (“Small”, “Normal”, “Large”, “Extra large”) enlarges the whole tile.

Where the wind comes from

The “Wind source” setting offers four choices:

  • “Measured” (default): the wind from your instruments. If they give nothing, the instrument takes the forecast from the GRIB, the weather forecast file loaded in the app;
  • “Avg 10 min”: the average of the measured wind over the last ten minutes, more stable for choosing a sail or a heading. While the history is too short, the instantaneous wind is used instead;
  • “Forecast”: the GRIB wind only. This choice is grayed out if no GRIB covers your position at the current time;
  • “Forced”: a strength (0 to 70 knots) and a direction that you impose, to see what a wind shift would do. Both values start from the current wind.

With “Measured” and “Avg 10 min” (when the instruments give a wind) as with “Forced”, the same wind is used for all legs. With “Forecast”, each leg is calculated with the wind forecast at the middle of the leg, at the time the boat is due to enter it: a long course is not evaluated with the wind at the start.

These settings apply to all copies of the instrument on the device.

How the calculation is done

For each leg, the instrument:

  1. reads the selected wind and the GRIB current at the middle of the leg, at the planned entry time. The current always comes from the GRIB, as no instrument measures it ahead of the bow;
  2. looks up in the polar the boat speed at that wind angle and strength;
  3. corrects the heading for the current so that the course over ground stays on the mark; this is the “Steer” column;
  4. deduces the apparent wind, the duration and the time of passage, then moves on to the next leg from that time;
  5. chooses the Sailchart sail for that angle and strength, keeping the previous leg’s sail as long as it suits, so as not to change sail for nothing.

Durations are therefore those of the polar, not those of your current speed. The instrument recalculates every 30 seconds, and immediately when the route or the target mark changes.

Possible messages

  • “No route being sailed”: neither a route being followed, nor a POI targeted by “Goto”.
  • “Course completed”: the last mark has been passed.
  • “No GRIB forecast here: distances and courses only” or “No wind here: distances and courses only”: without wind, the tile keeps the geometry of the legs (distance, course) but cannot calculate sail or time.
  • “Waiting for the polar…”: just after startup, while the polar is loading.

See also

↑ Contents

11.4 Which sail to carry

Expert

The essentials

A Sailchart is your boat’s sail chart: for each wind strength and angle, the sail to carry. It is part of the polar. If your polar includes one, NavimetriX knows at any moment which sail it prescribes for the measured wind, and two instruments display it.

  1. The short answer: add a “Numeric value” and choose the “Sail” data. The tile shows the sail code (J2, C0, S2…) on a badge of its color.
  2. The full answer: add the “Sailchart” instrument. It shows where you are on your Sailchart, with the track of the last few minutes.
  3. Both require the true wind from the instruments (NMEA connection) and a polar with a Sailchart.

Sailchart instrument on the chart: the boat’s orange dot and its track of the last ten minutes on the sail chart, sail legend at the bottom with the sail in use circledSailchart instrument on the chart: the boat’s orange dot and its track of the last ten minutes on the sail chart, sail legend at the bottom with the sail in use circled

Going further

The “Sail” tile

It is one of the data choices of the “Numeric value”. Its title is “Sail”, or “SAIL” when tile titles are set to acronyms. The badge color is that of the sail in your Sailchart, the same as everywhere else in the app. The tile stays empty if the polar has no Sailchart; it has no sparkline, since it displays a name and not a number.

The same sail appears, segment by segment, in the “Sail” column of the Course tracking instrument.

The “Sailchart” instrument

It reproduces the Sailchart drawing: the radius represents the wind strength, the angle represents the wind angle, and the two tacks are drawn as a mirror image. The colored zones are those of the sails, an orange dot marks your position.

  • The view is centered on the boat and zoomed in: seen whole, the Sailchart would shrink a two-knot shift to one pixel. Up close, you can see at once whether you are sailing in the middle of a zone or against a boundary.
  • The track is what gives the tile its meaning: it tells you whether the wind is rising or falling, and whether you are approaching the moment to change sail. Since the angle is signed, a tack or a gybe reads as a jump from one side to the other.
  • The legend at the bottom names the visible sails, from the largest zone to the smallest; the one you are carrying is highlighted.

Instrument settings (right-click or long-press):

SettingValuesDefault
“Track”“None”, “5 min”, “10 min”, “30 min”10 min
“Zoom”“± 5 kt”, “± 10 kt”, “± 20 kt”, “All”View zoomed on the boat
“Square tile background”Yes / noYes: the instrument is created square, but can become round

“Zoom” sets the band of wind strength shown on either side of your current wind; “All” shows the entire Sailchart. The track takes one point every 2 seconds; setting it to “None” erases the points already taken. These settings apply to all copies of the instrument on the device.

If the chosen polar has no Sailchart, the tile displays “This polar has no Sailchart”. It follows the polar in use: choosing another one or editing its Sailchart shows up immediately.

How the sail is determined

Two precautions, the same as for routing.

  1. The angle is brought back into the best-VMG cones. VMG is the speed of approach along the wind axis; both upwind and downwind, you do not sail closer or deeper than the polar’s best VMG angle. When you are closer to the wind than that angle, the app takes the optimal upwind angle, and downwind the optimal gybing angle. Pinching upwind, the Sailchart has nothing at 10° from the wind, whereas you are carrying the sail for your upwind angle perfectly well.
  2. The sail in place is kept as long as it suits. The app starts from the sail already recommended, which avoids flickering between two sails when you run along a boundary.

See also

↑ Contents

11.5 Barometer and barograph

Expert

The essentials

Atmospheric pressure, and above all how it changes, announces the weather to come: a rapid drop often precedes a gale. NavimetriX records the pressure continuously, over ten days, and displays it in two instruments.

  1. Add a “Barometer” for the current value and its 3-hour trend, or a “Barograph” for the curve from 2 hours to 10 days (“+” button, “Add instrument”).
  2. The pressure comes from an onboard barometer connected over NMEA, or failing that from the internal sensor of the phone or tablet, if it has one.
  3. For an accurate value, calibrate the barometer: Settings > “GPS & NMEA” > “Barometer” section > “Calibrate online” (Internet connection required).
  4. To be warned of a change, turn on Settings > “Alarms” > “Barometer”.

Barograph instrument on the chart: 24-hour curve with a marked drop, current pressure, 3-hour trend, minimum and maximum, gale warning and moon phaseBarograph instrument on the chart: 24-hour curve with a marked drop, current pressure, 3-hour trend, minimum and maximum, gale warning and moon phase

Going further

Where the pressure comes from

  • An NMEA barometer (MDA or XDR sentences) always has priority.
  • The internal sensor of the phone or tablet is only used if no NMEA barometer sends a pressure. It is read once every 30 seconds, which spares the battery. Computers have no pressure sensor.

When the pressure comes from the internal sensor, the barograph indicates it with the “INT” label.

The ten-day history

The app records the pressure once a minute, over ten days, as soon as a valid pressure exists, whether or not the barograph is displayed: adding the instrument shows the past immediately. A minute without a measurement remains a gap in the curve, never an invented line. On phones and tablets, outside Navigation mode, the pressure is only recorded while the app is in the foreground; in Navigation mode, it is recorded continuously. The history is kept on the device.

During a Replay, both instruments display the pressure of the replayed passage, not the onboard history.

The “Barometer” instrument

A needle barometer graduated from 960 to 1060 hPa, with the exact value and the 3-hour trend. As long as the history covers less than 3 hours, the trend is given over the available duration.

The “Barograph” instrument

The pressure curve, with the current value, the 3-hour trend, and the minimum and maximum of the displayed window.

  • Gale warning: when the pressure has dropped by 3 hPa or more over the last 3 hours, a red pictogram appears and the trend turns red. A more moderate drop, from 1.5 hPa, colors the trend orange.
  • Cursor: on a computer, hover over the curve with the mouse to read the time and pressure at any point. On a touch screen, the tile is reserved for the move gesture.
  • Layout: the tile puts the header on the left when it is wide, at the top otherwise. On the chart, it is created in a wide format.

Instrument settings (right-click or long-press), specific to each copy:

SettingValuesDefault
“Time window”“2 h”, “8 h”, “24 h”, “10 d”24 h
“Moon phase”Pictogram of the Moon’s phase in the headerNo
“1013.25 hPa reference”Dotted line of normal sea-level pressureNo

The curve color is shared with the “Chart (history)” instrument set to pressure.

Barometer settings

In Settings > “GPS & NMEA”, “Barometer” section (on the simple page, or in the “Instruments” tab in advanced mode):

SettingEffectDefault
“NMEA barometer offset”Offset added to the NMEA barometer, from -15 to +15 hPa in steps of 0.1. Tied to your account, since it depends on the boat0
“Use the device sensor”Allows the internal sensorYes
“Device sensor offset”Offset of the internal sensor, from -15 to +15 hPa. Specific to the device0
“Relay device barometer on local network”Broadcasts the internal sensor’s pressure as XDR and MDA sentences, every 5 seconds, on the boat’s networkNo
“Relay port”Network port of this broadcast10111
“Calibrate online”Calculates the correction automatically, see below
“Erase history”Empties the ten-day history, after confirmation

The internal sensor rows only appear on a device that has one.

To send the internal sensor’s pressure to the instruments over the configured NMEA link, turn on “XDR / MDA” in the NMEA outputs instead, under “Internal Sensors to NMEA” (see Navigation: GPS, NMEA and AIS).

Calibrate online

“Calibrate online” compares the measured pressure with the sea-level pressure given by the weather models at your position (the average of the models that cover the point), then sets the correction of the source currently in use: NMEA barometer or internal sensor.

It needs an Internet connection, a real GPS position (the approximate position from the network is not enough) and a measured pressure. Calibration is refused during a Replay or while following another boat.

If the correction changes by at least 1 hPa and a history exists, the app asks “Keep the pressure history?”. “Keep” shifts the old measurements by the same value, which is suitable if the error came from the sensor all along; “Erase” starts again from an empty curve, which is suitable if you have changed location.

For the internal sensor, the correction also contains the effect of the altitude at which the device is located. It therefore only applies where it was taken: if the device changes altitude by more than 25 meters, a message says so and offers to calibrate again.

The pressure change alarm

Settings > “Alarms” > “Barometer”:

SettingValuesDefault
“Active”Yes / noNo
Direction“Drop”, “Rise”, “Both”Drop
“Change”0.5 to 10 hPa3.0 hPa
“Over”1 to 6 h3 h
“Sound”List of alarm soundsBuzzer

With the default values, the alarm applies the classic gale warning rule: a drop of 3 hPa in 3 hours. Like the other alarms, it only watches in Navigation mode (see Navigation alarms).

See also

↑ Contents

↑ Contents

12 Safety: alarms, man overboard, anchoring

This chapter covers the functions that watch over the boat and crew. Navigation alarms monitor position, instruments, surrounding vessels and pressure. The man overboard function marks the point of the fall and estimates the person’s drift, and the anchor alarm sounds if the anchor drags, with an SMS alert and monitoring from another device.

12.1 Navigation alarms

Beginner

The essentials

The Settings page, Alarms: voice reading, GPS position loss, NMEA data loss, anchor watchThe Settings page, Alarms: voice reading, GPS position loss, NMEA data loss, anchor watch

NavimetriX monitors the boat’s data and warns you as soon as a value goes outside the limits you have set: GPS position lost, depth shoaling, wind rising, a vessel on a collision course… Each alarm opens a window, plays a sound and can read its message aloud, until you acknowledge it.

Alarms only watch in Navigation mode (“Navigation” switch at the top of the left drawer), reserved for the Premium subscription. Only the NMEA data loss alarm also runs outside this mode.

  1. Open Settings (“‹” handle at the right edge of the screen), then “Alarms”.
  2. In the section of the alarm you want, turn on the “Active” switch.
  3. Set the threshold, the duration and the “Sound”.
  4. Switch to Navigation mode.
  5. When the alarm sounds, tap “Acknowledge”: the sound stops, and the alarm does not trigger again until the situation has returned to normal.

Going further

Voice reading and sounds

The “Read the alarms” section sets the voice:

  • “Enable Voice” (on by default): the alarm message is read by the device’s speech synthesis, alternating with the sound, until acknowledged.
  • “Voice”: the voice used, “System Default” by default.

These two settings are specific to each device: you can have the chart table tablet speak and keep the phone silent.

Each alarm has its own “Sound”: none, beep1, beep2, beep3, buzzer, diving, fire, foghorn, railroad, rooster, siren or smoke. With “none” and the voice off, the window stays displayed in silence until you acknowledge it. Exception: for heading, wind speed and direction, polar efficiency, cross-track error, depth, dangers ahead and anchor watch, “none” is replaced by a default sound.

The alarms one by one

All are off by default, except GPS position loss. The “Duration” (from 0 to 600 s, 30 s by default; set to 0 s, it counts as 30 s) is the time the condition must last before the alarm sounds: it prevents a gust or a yaw from triggering it.

AlarmIt sounds when…Settings and default values
GPS position lossthe GPS position is lost while you were making way“Delay” 60 s (15 to 300 s), sound siren
NMEA data lossno more NMEA data is arriving“Timeout” 30 s (10 to 300 s), sound buzzer
Coursethe heading leaves the “Course” ± “Tolerance” range“Source” COG or HDG, “Course” 180°, “Tolerance” 15° (0 to 90°), sound beep1
Wind speedthe wind exceeds the threshold“Source” TWS or AWS, “Speed” 25 knots (0 to 70), sound beep2
True wind directionthe true wind direction leaves the “Direction” ± “Tolerance” range“Direction” 180°, “Tolerance” 15°, sound beep3
Polar efficiencyyour speed falls below the chosen percentage of the polar speed“Efficiency” 80% (0 to 100%), sound buzzer
Cross-track erroryou stray too far from the line of the leg being followed“XTE” 500 m (0 to 2,000 m), sound buzzer
Depththe depth sounder reads below the threshold“Depth” 10.0 m (0 to 100 m), sound buzzer
Chart dangers ahead (C-MAP)the C-MAP chart reports a danger in the sector ahead of the boat“Look ahead” 10 min (1 to 60), “Sector half-angle” 15° (2 to 60°), sound buzzer
Barometerthe pressure drops or rises too fast“Drop”, “Rise” or “Both” (Drop), “Change” 3.0 hPa (0.5 to 10), “Over” 3 h (1 to 6 h), sound buzzer
AISa vessel will pass too close, too soon“Alarm if CPA less than” 0.5 mile (0 to 20), “Alarm if TCPA less than” 10 min (0 to 60), sound diving
Alarm 1 to 5the chosen quantity goes above or below the threshold“Parameter”, “Condition”, “Threshold”, “Duration”

A few details, read from the code:

  • GPS position loss: so as not to cry wolf, it only sounds if the device had a GPS position for at least 30 seconds, the boat was moving at more than one knot in the minute before the loss, and the loss lasts the chosen “Delay”. It clears by itself when the position returns.
  • NMEA data loss: NMEA is the format of the data sent by the boat’s instruments (GPS, log, wind vane, depth sounder, AIS). The alarm only sounds if data had already arrived and then fell silent. With several NMEA links, each is monitored: it is enough for one to go silent. It requires an active NMEA connection.
  • Course: COG is the course over ground (given by the GPS), HDG the compass heading. Like polar efficiency and cross-track error, this alarm only plays with a real GPS position and a speed over ground of at least 0.2 knots.
  • Wind: TWS is the true wind speed, AWS the apparent wind speed. These alarms require an anemometer connected over NMEA.
  • Polar efficiency: this is the ratio between your speed through water and the one the boat’s polar predicts for the current wind (see Polars and Sailchart).
  • Cross-track error: the XTE (cross-track error) is the lateral distance between the boat and the line of the leg being followed. A route or an active “Goto” is required. The alarm sounds immediately, with no waiting duration, and stays quiet for 20 seconds after each route point change, the time to pick up the new leg. A deviation of more than 5 miles is ignored.
  • Depth: it requires a depth sounder connected over NMEA. It sounds immediately and clears as soon as the depth is sufficient again.
  • Chart dangers ahead (C-MAP): it only exists in versions that include C-MAP and requires a C-MAP chart covering the area. Every 10 seconds, it has a sector placed ahead of the boat checked, centered on the course over ground, of the length you will cover during the “Look ahead” and of the width set by the half-angle. Rocks, wrecks, obstructions, shoals shallower than your draft (plus a 0.5 m margin), bridges and cables lower than your air draft: these two values are set in “My Boat”. Depths are those of the chart, without the tide. The monitored sector is drawn on the chart, in blue when the way is clear and in red as soon as a danger is found. You must be making way at at least 0.5 knots. Without a chart or licence, the alarm stays silent.
  • Barometer: it compares the current pressure with the highest (for a drop) or the lowest (for a rise) of the last few hours, in the pressure history. A pressure source is required: a barometer connected over NMEA or the device’s sensor (see Barometer and barograph). A 0.5 hPa margin prevents a pressure hovering around the threshold from sounding twice.
  • AIS: the CPA (Closest Point of Approach) is the minimum distance at which a vessel will pass you, the TCPA the time remaining before that point. The alarm sounds when the CPA and the TCPA are both below their thresholds, for at least 15 seconds. The same settings are found in Settings > AIS, where the switch is called “Sound alarm”.
  • Alarms 1 to 5: the “Parameter” is chosen from 28 quantities: speed and course over ground, distance, bearing and time to the waypoint, position accuracy, 5 and 20 min SOG, boat speed, heading, true wind speed, angle and direction, apparent wind, VMG, current, depth, water and air temperatures, pressure, speed and VMG efficiencies, waypoint VMC and XTE, distance and time to the layline. The “Condition” is “Above” or “Below” the “Threshold”.

“Navigation Alarm” window: depth alarm message with its measured value, its threshold and the “Acknowledge” button“Navigation Alarm” window: depth alarm message with its measured value, its threshold and the “Acknowledge” button

Acknowledging, ignoring, silencing

The alarm window shows the message (measured value and threshold), the alarm type and a flashing red indicator.

  • “Acknowledge” stops the sound and the voice. An alarm with a duration only re-arms once the situation has returned to normal for the same duration; cross-track error and depth re-arm as soon as the value goes back to the right side of the threshold. Two triggerings of the same alarm are separated by at least 10 seconds (30 seconds for dangers ahead).
  • The window closes by itself when the condition disappears, except for AIS and MOB alarms, which always wait for your action.
  • For an AIS alarm, three buttons: “OK” acknowledges that vessel; “Ignore From Now” no longer sounds for it as long as it stays in the AIS target list; “Silence All”, which only appears from three pending AIS alarms (a crowded race start, for example), disables the AIS collision alarm. You then have to re-enable it in Settings.

When alarms go quiet

  • Outside Navigation mode, no alarm watches, except NMEA data loss.
  • When the device is following another boat through the Remote cockpit (“Follow” position), or is replaying a recorded or shared outing, all alarms are off: it is only an observer.
  • In power-saving mode, conditions are checked once per second instead of twice.
  • In the version of NavimetriX that opens in a browser, the “Alarms” page does not exist: a browser tab sent to the background no longer watches.

See also

↑ Contents

12.2 Man overboard (MOB)

Beginner

The essentials

The MOB (Man Overboard) button marks in a single gesture the position where a person fell into the water. NavimetriX then starts a timer, sets a course for that point and estimates the person’s drift from wind and current.

The button only appears in Navigation mode (reserved for the Premium subscription), with a GPS position.

  1. Before setting off, open Settings (“‹” handle at the right edge), then “General”: in the “MOB” section, turn on “MOB button”. It is off by default.
  2. When navigating, a round “MOB” button is displayed at the bottom left of the chart.
  3. In case of an accident, hold the button pressed for 1.5 seconds: a ring fills around it, then the MOB is triggered. A short tap only displays “Hold to activate MOB”, to avoid any accidental triggering.
  4. Steer toward the position shown in the red banner at the top of the chart: bearing (“BRG”) and distance (“DST”).
  5. Once the person has been recovered, hold “Hold to cancel MOB”, at the bottom of the banner, for 1.5 seconds.

Chart just after a MOB: red banner with timer, bearing and distance, “MOB” POI, route line to the point, drift zone and MOB button at the bottom leftChart just after a MOB: red banner with timer, bearing and distance, “MOB” POI, route line to the point, drift zone and MOB button at the bottom left

Going further

What triggering does

As soon as the MOB is triggered:

  • a “MOB hh:mm:ss” POI is created at the boat’s GPS position;
  • this point becomes the destination of a “Goto”, with a route line from the boat;
  • the chart centers and zooms on the point;
  • a timer starts (minutes and seconds);
  • a “Safety event” entry, of type “Man overboard”, is added to the logbook of the current track, at the time and position of the MOB;
  • drift estimation begins.

During the MOB, the button turns red and pulses. If an anchor alarm was displayed, its banner steps aside to make room for the MOB banner; the anchor watch continues underneath.

The MOB banner

The red banner, at the top of the chart, gives:

  • the elapsed time since triggering;
  • a badge that indicates where the estimate comes from: “Wind: GRIB” or “Wind: Instruments”, “Current: GRIB”, “Current: Atlas” or “Current: Instruments”. It is orange when drift data exists, gray with “NO DRIFT DATA”, green with “AIS TRACKING” when an AIS beacon is being tracked (blue in color-blind mode), red with “AIS LOST”;
  • “BRG”, the bearing of the point to reach, and “DST”, its distance, in meters under 0.1 mile and in miles beyond;
  • “Drift”: speed in knots and the direction toward which the person is drifting;
  • the “Show SAR” / “Hide SAR” button;
  • “Hold to cancel MOB”.

The estimated drift

A person in the water drifts under the effect of current and wind. Every 30 seconds, NavimetriX recalculates the person’s probable position:

  • the wind: that of the loaded GRIB file (the weather forecast file), otherwise the true wind from the instruments. Wind drift is 3% of the true wind speed, downwind, offset by 10°. These are the reference values in maritime search and rescue manuals (IAMSAR) for a person in the water;
  • the current: that of the GRIB if it contains one, otherwise that of the current atlases, otherwise the current computed by the instruments.

On the chart, an orange line links the point of the fall to the estimated position, surrounded by an orange circle whose radius grows with time (about 0.1 mile per minute) to represent uncertainty. When drift data exists, the “Goto” follows the estimated position. Loading a GRIB of the area before setting off therefore improves the estimate (see Weather: GRIB files and forecasts).

The search pattern

“Show SAR” draws an expanding square search pattern, the method from the international search and rescue procedures (SAR): legs of increasing length, spaced 0.1 mile apart, with 90° turns to starboard, 20 legs in all. It is centered on the person’s estimated position.

Expanding square search pattern displayed around the MOB position, banner with “Hide SAR”Expanding square search pattern displayed around the MOB position, banner with “Hide SAR”

The MAYDAY reminder

One minute after triggering, if no AIS beacon locates the person, a yellow reminder is displayed in the banner: “MOB not located? Consider MAYDAY on VHF Ch16”.

AIS MOB beacons

An AIS distress beacon transmits the person’s position on the AIS network. NavimetriX recognizes beacons whose MMSI number (the AIS identifier) starts with 970 (AIS-SART), 972 (AIS MOB) or 974 (EPIRB-AIS). As soon as such a beacon is received with a position, in Navigation mode:

  • the “MOB Alert” alarm sounds (siren) with the beacon’s position;
  • a MOB POI is created and becomes the destination of the “Goto”;
  • MOB mode turns on if it was not already on, and the beacon’s position is re-read every 5 seconds;
  • if the beacon is no longer received for one minute, NavimetriX goes back to the drift estimate from its last position.

This detection does not require the “MOB button”, but AIS must be received, for example by a receiver connected over NMEA (see Navigation: GPS, NMEA and AIS). The alarm’s “Acknowledge” button recenters the chart on the beacon.

Canceling the MOB

“Hold to cancel MOB” stops tracking, removes the “Goto” destination and hides the banner. The “MOB” POI stays on the chart and the logbook entry is kept.

See also

↑ Contents

12.3 Anchor alarm

Beginner

The essentials

The anchor alarm draws a swinging zone around the anchor, that is, the space in which the boat swings around her anchor with the wind and current. If the boat leaves it, she is dragging: the alarm sounds, and can send an SMS. The anchor alarm requires the Premium subscription and a GPS position.

  1. With the boat anchored and almost stopped (speed over ground below 2 knots), tap the round “+” button at the bottom right of the chart, then “Drop anchor”. Navigation mode turns on if it was not already on.
  2. The anchor is placed ahead of the bow, an “Anchorage DD/MM hh:mm” POI is created and a banner appears at the top of the chart: “Anchor set Alarm not armed”.
  3. Choose “Circle” or “Hexagon” in the banner, then adjust the zone by dragging the green handle.
  4. Hold the banner’s “Arm” button: it then shows “Watching”.
  5. When leaving, hold “Disarm”, then “Raise anchor”.

The anchor banner and the swinging zone, as a circle on the left and a hexagon on the rightThe anchor banner and the swinging zone, as a circle on the left and a hexagon on the right

Going further

Conditions for dropping anchor

All conditions are checked when you tap “Drop anchor”, and a message says what is missing:

  • without a Premium subscription, the subscription window opens;
  • Navigation mode is turned on automatically (message “Navigation Mode enabled for the anchor watch”), then NavimetriX waits up to 6 seconds for a first GPS position. An approximate position, deduced from the Internet connection, is not enough;
  • speed over ground must be below 2 knots: above that, the boat is still making way.

One anchor at a time: as long as an anchor is down, “Drop anchor” disappears from the “+” menu.

The anchor is placed ahead of the boat, at the distance set in “Drop ahead of bow” (15 m by default), along the compass heading or, failing that, the course over ground. With neither, it is placed at the boat’s position. The zone is created with the default radius and shape, and the chart zooms to frame it.

The swinging zone

  • Circle: a single radius around the anchor. Drag the green handle on the circle: the radius ranges from 5 to 500 m and is shown live in the banner. Set it to the length of chain paid out, plus a margin, taking the tide into account.
  • Hexagon: six vertices that you move one by one, to fit an anchorage that is crowded on one side.

Changing shape in the banner redraws a new zone, at the default radius.

Once the alarm is armed, the zone is locked and the handles disappear: an accidental gesture cannot enlarge it. To adjust it without disarming (paying out more chain in the middle of the night, for example), tap the anchor on the chart then “Edit radius” (circle) or “Edit watch zone” (hexagon). The handle reappears for the time of an adjustment and disappears by itself after 20 seconds.

To move the anchor, with the alarm not armed, tap it then choose “Move anchor” and drag it: the zone follows. With the alarm armed, this entry disappears, and so does “Delete POI”, so as not to leave the alarm watching a zone with no center.

The banner

Below the alarm status (“Anchor set Alarm not armed”, “Watching” in green, “DRAGGING” in red), the banner shows:

  • the distance to the edge of the zone (“To border: 12 m”), or how far the boat has gone out of it (“Outside zone: 8 m”); “Waiting for GPS…” without a position;
  • the circle’s radius (“Radius: 40 m”) or, for a hexagon, the minimum and maximum distances between the anchor and the edge;
  • the distance and true bearing of the anchor as seen from the boat (“Anchor: 28 m at 145°”);
  • the bearing of the anchor from the bow: “30° to port” in red, “30° to starboard” in green, “0° ahead” or “180° astern”. This line only appears if a compass heading or a course over ground is available.

Drag the banner wherever you like on the chart: its position is remembered on the device. During a man overboard alert, it steps aside for the MOB banner, without the watch stopping.

Arming and disarming

  • In the banner, hold “Arm” or “Disarm” for about a second: an outline is drawn around the button, then a message confirms. A short tap only reminds you “Hold to arm / disarm”.
  • You can also tap the anchor on the chart and choose “Arm anchor alarm” or “Disarm anchor alarm”.

The armed state is specific to each device: arming the alarm on the boat’s tablet does not arm the phone left in a pocket. The settings (radius, shape, delay, sound, SMS), on the other hand, are shared by all devices on the account.

The alarm only watches in Navigation mode. Arming the alarm turns this mode on, and turning off Navigation mode with an armed alarm asks for confirmation, then disarms the alarm. If the Premium subscription ends during an anchorage, the siren continues to protect the watch in progress: only creating an anchorage is reserved for Premium.

Dragging

When the boat leaves the zone and stays out for the “Delay” (30 s by default), the alarm goes off: the chosen sound (siren by default), the voice “Anchor Drag Alarm, the boat is dragging”, the window “Anchor Drag Alarm: boat is 52 m from anchor (limit 40 m)” and the banner in “DRAGGING”. The alarm keeps sounding even if the boat returns to the zone, until you acknowledge it. Once acknowledged and the boat is back in the zone, it re-arms for a new drag. Only a real GPS position is taken into account.

Settings

Settings, Alarms, Anchor watch sectionSettings, Alarms, Anchor watch section

They are in Settings > Alarms, “Anchor watch” section:

  • “Default radius”: 40 m (from 5 to 500 m);
  • “Drop ahead of bow”: 15 m (from 0 to 100 m);
  • “Delay”: time spent outside the zone before the alarm, 30 s (from 0 to 300 s; set to 0 s, it counts as 30 s);
  • “Default shape”: “Circle” (default) or “Hexagon”;
  • “Sound”: siren by default; “none” also gives the siren.

The SMS alert

In addition to the onboard siren, NavimetriX can warn one or two phones by SMS. In the same section:

  1. Turn on “SMS on alarm”.
  2. Enter the numbers in “Mobile 1” and “Mobile 2”, in international format (for example +33612345678).
  3. Check with “Test SMS” and the “Send test” button: a real SMS is sent immediately.

The SMS alert requires the Premium subscription, a signed-in NavimetriX account and an Internet connection on board. The SMS gives the boat’s position, its bearing and distance from the anchor, and a Google Maps link to the boat. At most three SMS are sent per drag: immediately, then 30 and 60 minutes later, as long as the alarm is not acknowledged. Acknowledging the alarm stops the sending. With no network at the time of the alarm, sending is retried every 5 minutes.

The “Usage” counter shows the SMS used from the annual allowance: 50 SMS per rolling 365-day period. The “?” button details the count. Once the allowance is used up, the app displays “Annual SMS limit reached”; the onboard siren, however, keeps working. Numbers starting with +1 (United States, Canada) are not served, and a warning line says so below the numbers.

Monitoring the boat remotely: “At anchor”

As long as an anchor is down, the boat’s device (in Navigation mode, with a signed-in NavimetriX account) publishes the boat’s position every 20 seconds, with the anchor and the swinging zone. On the other devices on the same account, an “At anchor” row appears by itself at the top of the Tracks tab of the left drawer. The chart then shows, read-only:

  • the boat’s orange track over the last three hours (swinging, any dragging);
  • the anchor and the swinging zone;
  • the boat’s last known position, oriented along her heading.

The round boat button, at the bottom right of the chart, recenters the view on the boat at anchor; a long press frames the whole swinging zone. If the boat’s device goes silent (app closed, no more Internet), its last position stays displayed for up to 12 hours. The row disappears when the anchor is raised or when Navigation mode is turned off on board.

Second device on the account (phone): the boat at anchor is shown on the chart with its orange track, the green ring of the swinging area and the boat icon oriented along her headingSecond device on the account (phone): the boat at anchor is shown on the chart with its orange track, the green ring of the swinging area and the boat icon oriented along her heading

Tracks tab of the left drawer on the second device: the “At anchor” row at the top, with the start time, the duration and “Last position: just now”Tracks tab of the left drawer on the second device: the “At anchor” row at the top, with the start time, the duration and “Last position: just now”

Raising the anchor

Hold “Raise anchor” in the banner (this button only appears with the alarm disarmed), or tap the anchor on the chart and choose “Raise anchor”, which disarms at the same time. The swinging zone disappears, the “At anchor” row vanishes on the other devices, and the anchorage POI stays on the chart as a memento of the stopover.

See also

↑ Contents

↑ Contents

13 Tracks, Replay and Logbook

NavimetriX records your track as soon as Navigation mode is active, trip by trip. This chapter explains how to display it, organize it, import or export it, replay it on the chart with the instruments and the weather of the time, keep your logbook and share it with a simple link. It also explains how tracks follow your account from one device to another.

13.1 Record and Display the Track

Beginner

The essentials

The Tracks tab with the track in progressThe Tracks tab with the track in progress

The track is the path travelled by the boat. NavimetriX records it automatically as soon as Navigation mode is active, point by point, with speed, heading and instrument data. Each trip becomes a separate track, which you find in the Tracks tab. Navigation mode is reserved for the Premium subscription.

  1. Open the left drawer (the › handle at the left edge of the screen) and turn on the Navigation switch at the top of the drawer. Recording begins.
  2. Open the Tracks tab: the current trip appears at the top of the list under the heading “In progress · this device”, with a flashing red dot. Its duration, distance and speeds update while the tab is open.
  3. To stop recording, turn off the Navigation switch. The track is closed and takes its place in the list.
  4. To display a past track on the chart, tap the eye on its line. The chart frames the track. Tap the eye again to hide it.

Going further

Start and end of a track

When you turn on Navigation mode, NavimetriX looks at the last closed track:

  • ended less than 30 minutes ago, it continues without asking (a pause at the pontoon does not split the trip in two);
  • ended between 30 minutes and 3 days ago, the app asks: “Continue previous track “…”, ended on …? Otherwise a new track starts.”, with the buttons “Continue” and “New track”;
  • older, a new track starts without a question.

When the app restarts in Navigation mode (after being closed or crashing), the open track resumes without a question.

A track left 48 hours without movement (speed below 0.5 knot) is closed automatically.

A new track gets a default name made of its start date and time, for example “Track 2026-07-14 09:30”. You can rename it with ⋮ > Rename once it has ended: during recording, this entry is greyed out.

A track’s information

Each line of the Tracks tab shows:

  • Start: start date and time;
  • Duration: from the start to the end (or to now for the track in progress);
  • Moving: the time spent making way, without the hours at the dock or at anchor at the beginning and end of the trip;
  • Distance;
  • Max and Avg.: the maximum speed and the average speed. The average is calculated over the moving time, not over the total duration.

⋮ > Details adds the end time, the number of points and the state of the track’s logbook (“recorded, replayable”, “reconstructed from the track”, “not recorded”…). This state tells whether the track can be replayed: see Replay.

Tapping a track displayed on the chart opens, at the spot you tapped, the same menu as the ⋮ button on its line.

Adjust a track’s display

⋮ > Display opens the “Track display” window. The settings apply immediately, with no confirmation button, and are specific to that track:

SettingEffectDefault
“Day numbers”Places a badge with the day number where the boat was at midnight, on a multi-day tripon
“Point details on hover”Computer only: a bubble gives the time, speed and heading of the point under the cursor, when the map scale is 30 nm or closeron
“Logbook events”Shows the logbook entry pictograms on the trackon
“Follow boat during replay”The chart follows the boat during Replayoff
“Live track extent”Track in progress only: “Full” (the whole trip) or “Short” (the last 20 minutes)Full
“Playback speed”Multiplies the Replay speed: ×½, ×1, ×2, ×4×1
“Track color”Colour of the lineautomatically assigned colour
“Width”Line width, from 1 to 5that of My Boat

Day numbers follow the app’s Time zone setting (UTC or local time): the day is split in the time zone you read. A trip that fits within a single day has none. The track in progress also carries its day numbers. The logbook writes the times of the boat: “UTC” follows the time of entries made while the setting was on UTC.

During recording, the track in progress is drawn in the colour set in My Boat (see below). The colour chosen in this window applies to the track once it has ended.

These settings, the colour, the name and the eye of each track follow your account: see Track sync.

The track in progress in My Boat

In the Settings (right drawer), My Boat > Track sets the appearance of the track being recorded:

SettingValuesDefault
“Width”1 to 52
“Color”colour pickerred
“Wind barb”wind barbs along the trackon
“Current arrow”current arrows along the trackon
“Wind/Current frequency”interval between two barbs or arrows, from 1 to 360 min10 min

The width chosen here is also used as the default for past tracks for which you have not chosen anything.

To delete the track in progress, open the Tracks tab, then ⋮ > Delete on the “In progress” row. The confirmation says how long the recording has been running and that the action cannot be undone: the current trip is deleted from your account and from all your devices. A new trip starts with its track displayed.

The track in progress is always drawn as long as its eye is open in the Tracks tab. For a lighter chart during a long crossing, set its “Live track extent” to “Short”.

See also

↑ Contents

13.2 Organize Your Tracks

Expert

The essentials

The archive folders of the Tracks tabThe archive folders of the Tracks tab

Over the seasons, the list in the Tracks tab grows longer. Archive folders let you put away the trips you no longer want to see in the current list, without deleting them: “Races 2026”, “Deliveries”… An archived track leaves the current list and the chart, but stays on your account and replays as before.

  1. In the Tracks tab, tap the track’s ⋮ button, then Archive.
  2. Choose a folder, or New folder… to create one. The very first time you archive, the app directly asks for the folder name.
  3. An Archives (n) bar appears at the top of the list. Tap it to open your folders, then a folder to see its tracks.
  4. Inside a folder, the bar becomes the back button: it shows the folder name and takes you, with one tap, back to the list of folders and then to the current list.

Going further

Manage folders and archived tracks

  • In the folders view, each folder shows the number of tracks it contains on this device. The New folder button, at the bottom, creates an empty folder.
  • A folder’s ⋮ button offers Rename and Delete folder. Deleting a folder deletes no track: they return to the current list, and the app says so before you confirm.
  • An archived track’s ⋮ button offers Move to… (another folder) and Unarchive (back to the current list). It also keeps Replay, Details, Logbook, sharing and export.
  • An archived track has no eye: it is not displayed on the chart. Unarchive it to see it again.
  • The track being recorded cannot be archived: the Archive entry is greyed out until it has ended.

Folders and the filing of tracks follow your account: a season put away on the computer is put away on the tablet. If a folder is deleted on another device, its tracks return by themselves to the current list: a track is never invisible.

Delete tracks

  • One track: ⋮ > Delete.
  • Several tracks: tick the boxes at the left of the lines, then tap Delete in the bottom bar.

Deletion applies to the whole navigation history, not only to the screen you are looking at: the track is removed from your account and from all your devices, and the confirmation question says so. Without a network, the deletion is queued and sent as soon as the connection returns. The track being recorded cannot be deleted from the list (to clear it, see My Boat > Track > Clear in Record and display the track).

The local trash

On the device where you delete a track, its GPX file is not destroyed: it is moved to the tracks/trash folder of the app data and stays there for 30 days, then it is purged. On a computer, after a mistake, re-import this file with the Import button in the Tracks tab. On phones and tablets, this folder stays in the app’s private storage: the file picker cannot access it. The GPX only contains the points: the logbook and the original Replay data do not come back this way.

Keep a complete trip: the .nx format

To back up an entire trip outside the app, export it in NavimetriX (.nx) format: a single file contains the track, its logbook, its Replay data and its display settings. Re-imported later, or passed to another NavimetriX user, it restores the complete, replayable trip. See Import and export tracks.

See also

↑ Contents

13.3 Import and Export Tracks

Expert

The essentials

The Tracks tab exchanges tracks with other devices, other apps or other users. Two file formats are used for export:

  • NavimetriX (.nx): the complete trip in a single file (points, logbook, Replay data, display settings). This is the format for backup and for exchange between NavimetriX users;
  • GPX: the standard exchange format for GPS tracks, read by most navigation and sports apps. It only carries the points.

To import:

  1. In the Tracks tab, tap Import in the bottom bar.
  2. Choose one or more files: GPX, .nx, NMEA logs (.txt, .nmea, .log, .gz) or Adrena tracks (.trz).
  3. GPX and .nx tracks are added to the list, filed at their date. NMEA logs and Adrena tracks first go through a preview window (see below).

To export a track:

  1. Tap its ⋮ button, then Export (on a computer) or Share (on tablet and phone).
  2. Choose the format: “NavimetriX (.nx)” or “GPX”.
  3. On a computer, choose the file location (the Downloads folder is suggested). On mobile, the system share sheet opens: messaging, mail, saving to files…

“Which format?” question with the “NavimetriX (.nx)”, “GPX” and “Cancel” buttons“Which format?” question with the “NavimetriX (.nx)”, “GPX” and “Cancel” buttons

Going further

Import a GPX or an .nx

  • A GPX is read in the background: the line appears immediately and its statistics fill in when reading ends. The app does not freeze, even on a large file.
  • An .nx restores the complete trip: track, logbook, Replay and display settings. With a Premium account, it joins your account and appears on all your devices.
  • With a Premium account, a track imported as GPX gets a Replay reconstructed from its points: position, heading and speed over ground, and wind and current if the file contains them, but no depth, heel or AIS targets. ⋮ > Details indicates this (“reconstructed from the track”).
  • An .nx received from another user becomes a trip on your account: with Premium, it is uploaded there, then shared by link like your own trips. The share entry stays greyed out until the upload is finished.

Import NMEA 0183 logs and Adrena tracks

An NMEA log is a text file that records the sentences sent by the onboard instruments (NMEA 0183 is the standard for these sentences). NavimetriX can extract complete tracks from it, with the instruments and AIS targets, replayable like a trip recorded in the app. Adrena tracks (.trz) follow the same path.

The “Import NMEA logs” window reads the files in the background, then splits them into segments at each interruption of positions:

  • “Split after an interruption of”: the time without a position beyond which a new segment begins, from 1 to 72 h, 6 h by default. This setting only concerns interruptions;
  • “Split at position jumps”: also splits where the position makes an impossible jump (a speed of more than 50 knots between two points). On by default;
  • each segment shows its date, duration, distance, number of positions and the data found (Wind, Heading, Speed through water, Depth, Temperature, Pressure, Current, AIS). Tick those to import: segments that are too short (fewer than 30 positions or less than 2 minutes) are unticked by default;
  • between two segments, a selector decides: “New track” (default) or “Continue previous”. When continued, the track stays in one piece and the interruption becomes a gap in the Replay;
  • a summary says how many lines were read and what was discarded (sentences with a wrong checksum, sentences earlier than the first date, position jumps removed…), then how many tracks will be created. Tap “Import”.

To be placed in time, a log must contain RMC sentences, or ZDA with GGA or GLL. Without them, the window explains and imports nothing. A track imported from an old log is filed at its own date, far down the list: the final message gives its name so you can find it.

“Import NMEA logs” window: three segments, the second continuing the first, and the summary“Import NMEA logs” window: three segments, the second continuing the first, and the summary

Export several tracks

Tick the boxes at the left of the lines, then tap Export (or Share on mobile) in the bottom bar:

  • as .nx, each track gives its own file. On a computer, you choose a destination folder;
  • as GPX, all the ticked tracks are combined into a single file.

The track being recorded cannot be exported: the file would be truncated without anything saying so. To show a trip while it is under way, share its live link instead (see Share a track).

Send a trip to Strava

On a computer, after exporting a single track as GPX, the app offers to open Strava’s upload page: “Open Strava” or “Later”. You then need to drop on that page the GPX file you have just saved (in the Downloads folder, unless you chose another one). On mobile, share the GPX to the app of your choice from the share sheet.

See also

↑ Contents

13.4 Replay

Beginner

The essentials

Replay replays a recorded trip: the boat sails its course again on the chart, the dials show the values measured on board, the AIS targets you passed reappear, the logbook entries mark the track and, if the trip allows it, that day’s weather loads by itself.

  1. Open the left drawer, Tracks tab.
  2. Tap the trip’s ⋮ button, then Replay. You can also tap the track on the chart and choose Replay in the menu that opens.
  3. A playback banner replaces the timeline at the bottom of the screen. Tap the play button to start or pause.
  4. Drag the timeline, or tap it, to go to another moment. Tapping the track on the chart also takes playback to that spot.
  5. To return to the present, tap the × cross on the banner.

Replay of a trip: recorded values, wind curve, logbook pictograms on the track and playback bannerReplay of a trip: recorded values, wind curve, logbook pictograms on the track and playback banner

Going further

Which tracks can be replayed

Replay needs the data recorded during the trip, not only the track’s points. The menu tells you:

  • Replay: the trip can be replayed;
  • “Replay (not recorded)”, greyed out: the track has no Replay data (for example an old track, or a GPX imported without a Premium account);
  • “Replay (no longer on this device)”, greyed out: the data has left the device and no account is connected to retrieve it.

Once uploaded to your account, the Replay data is erased from the device after 7 days. With a connected account, the trip remains replayable: “Fetching this track from your account…” is displayed during the download, which requires an Internet connection.

The track being recorded cannot be replayed. If you start the Replay of another trip while Navigation mode is active, the app warns you: recording is suspended while you watch (the track and the logbook carry a declared gap), and so are the navigation alarms and live AIS targets.

In the Tracks tab, the replayed trip is recognised by a stripe on the left edge of its line and by a play triangle that pulses above its eye.

The playback banner

  • The timeline scrolls under a central cursor, with midnight separators and day labels. A box under the cursor gives the time and date of the moment being played. It shows at most one day at a time; a shorter trip spreads over the full width. Its scale follows the “Timeline scale” setting in the general settings.
  • When touched, the timeline enlarges to be easier to aim at, then folds back by itself.
  • A tap on the timeline jumps to the chosen moment while travelling along the path, so that you see where you are going. A drag follows your finger.
  • Acquisition gaps (moments without data) are painted on the timeline. The status line announces them with a countdown, and playback crosses them by itself.
  • Logbook entries appear as coloured badges on the timeline.
  • At the right of the banner: the logbook button, the cogwheel for the track’s display settings, and the cross that closes the Replay.

On a phone in landscape, the timeline becomes a column at the side of the screen, with the play button at the bottom.

Playback speed follows the zoom

There is no multiplier to choose. The speed is calculated so that the boat crosses the screen in about one minute, whatever the scale: zoom in to slow down and watch a manoeuvre, zoom out to scroll through a crossing. It does not go below real time and is capped at 20,000 times real time.

To play faster or slower at the same zoom, set “Playback speed” (×½, ×1, ×2 or ×4) in the banner’s cogwheel. This setting is remembered for each track, like the other settings in the “Track display” window: see Record and display the track. “Follow boat during replay” is off by default there: the chart stays where you leave it.

The recorded values and their curves

During Replay, a row of labels at the top of the chart shows the values measured on board at the moment being played: TWD, TWS, TWA (true wind direction, speed and angle), AWS and AWA (apparent wind), SOG and COG (speed and course over ground), STW (speed through water), HDG (heading), VMG, depth, heel, rudder angle, pressure, temperatures… depending on what the boat was recording.

Tap a label to open that value’s curve: it scrolls with playback, with the cursor at two thirds of the frame. This is where you find the night’s lull or the wind shift without replaying the whole trip. If the weather of the time is loaded and you also choose a weather label, the two curves overlap: what the forecast announced and what the boat measured.

The weather of the time

For a trip after 29 February 2024, NavimetriX automatically asks the server for the weather of those days over the area travelled: archive of the ECMWF IFS model (the European Centre’s model), with wind, gusts, pressure, cloud cover, precipitation and waves. An Internet connection is required.

  • The grid is 0.25°, 0.5° or 1° depending on the extent of the trip. If the file exceeds 12 MB even at 1°, the weather of the time is not loaded.
  • A banner tracks the request: “Asking for the weather of that day…”, then, if the server has to build the archive, the number of days remaining, then the download. “No archived weather for this navigation” indicates that there is nothing to display.
  • The weather loads like a GRIB file. Its values, at the top of the chart, give the weather at the moment being played.

Replay of a crossing with the weather of the timeReplay of a crossing with the weather of the time

The logbook during Replay

  • Tap a logbook pictogram on the track: a menu offers “Go to this moment”, “Details”, “Edit”, “Open logbook” and “Delete”.
  • The logbook button, in the banner, opens the full table; “Go to this moment” takes playback to the time of an entry.
  • To complete the logbook afterwards, chart + menu > “Add a logbook entry”: the entry is dated at the moment being played and placed on the track. This entry only exists for your own trips, not for a shared link.

See also

↑ Contents

13.5 Logbook

Expert

The essentials

Each track has its own logbook. You note the events of the trip in it (sail change, watch handover, weather bulletin, failure…), each one automatically dated and positioned. Entries appear as pictograms on the track, are entered while underway or afterwards during a Replay, and can be printed as a PDF.

To add an entry while underway (Navigation mode active):

  1. Tap the round orange button marked with a page and a “+”, above the button that centres on the boat. On a phone in landscape, go through the chart’s + menu > “Add a logbook entry”.
  2. The moment and position are taken at the time of the tap. Choose the category, then fill in the form.
  3. Tap “Add”: the entry appears on the track and in the logbook. When editing, the button is called “Save”.

To consult a track’s logbook:

  1. Tracks tab, the track’s ⋮ button, then Logbook. During a Replay, the logbook button is in the playback banner.
  2. The table lists the entries in order: time, category, detail, position. Tap a line to open its menu (details, edit, delete).
  3. Tap PDF to produce the printable document.

A trip’s logbook tableA trip’s logbook table

Going further

The eleven categories

CategoryContent
Voyage & crewSkipper, crew, departure and destination
Boat statusSailing, motoring, motorsailing, in port, at anchor, moored
CommentFree text note
ObservationsWeather and sea state
Sail changeMainsail, reefs, headsail, spinnaker
Watch handoverWho takes the watch
Technical eventMaintenance, adjustment, intervention
FailureBreakage or malfunction
Safety eventMOB, injury, distress, contact with the MRCC (CROSS in France)
Weather bulletinBulletin or gale warning received
Racing eventStart, mark rounding, finish…

A few forms are pre-filled:

  • Observations takes the instrument values at the time of entry: wind, pressure, air and sea temperatures, when available;
  • Voyage & crew takes the form of the previous trip, since the same crew often sails several trips in a row.

An entry’s moment and position are those of the time you open the entry form, not of the confirmation: the time spent filling in the form does not shift the event.

Man overboard: the automatic entry

When the man overboard alarm is triggered during recording, by the app’s MOB button or by receiving an AIS MOB beacon, a Safety event entry is added to the logbook by itself, at the time and position of the trigger. For a beacon, its MMSI number (the AIS identifier) is kept in the entry. See Man overboard (MOB).

Periodic positions

The “Positions” selector, at the top of the table, interleaves position lines taken from the track: “Hidden”, “Hourly” (default), “Every 6 h”, “Every 12 h” or “Every 24 h”. On a trip of less than 2 hours, the hourly rate becomes a quarter of an hour. This setting is specific to the device, and the PDF reproduces what the screen shows.

Edit, delete: nothing disappears silently

Tap an entry in the table: “Details”, “Edit”, “Go to this moment” (during a Replay) and “Delete” (after confirmation).

An edited entry carries the mention “Modified (rev. N)”. Its previous versions remain readable in “Details”, under “Previous versions:”. The mention also appears in the PDF, as a crossing-out stays legible in a paper logbook.

Add an entry afterwards

During the Replay of one of your trips, chart + menu > “Add a logbook entry”: the entry is dated at the moment being played and placed on the track. The table’s Add button, however, only appears for the trip being recorded.

In the “Track display” window (⋮ > Display), “Logbook events” shows or hides the pictograms on the chart.

The PDF export

The PDF button composes a document ready to print or archive, then shows it in a preview. On a computer, “Save” stores it wherever you want; on mobile, “Share” opens the share sheet.

The document contains:

  • the name of the trip and of the boat, with the vessel identity line: registration, call sign, MMSI and home port, as entered in Settings > My Boat;
  • the line from the “Voyage & crew” form: departure and destination, skipper, crew;
  • the map of the course, on the chart background you use, with the entry pictograms;
  • the table of entries (time, position, type, details) and of periodic positions;
  • a “Summary” line: distance, moving time, maximum speed over ground, maximum wind, and engine hours deduced from the “Boat status” entries (motoring or motorsailing);
  • at the foot, a SHA-256 fingerprint that lets you verify that the content has not been modified.

The logbook PDFThe logbook PDF

Where the logbook goes

The logbook follows your Premium account: entered on the tablet, it is on the computer when you get home. It travels in the track’s .nx file, and the recipient of a share link can read it, without being able to modify it.

See also

↑ Contents

13.6 Share a Track

Beginner

The essentials

A track is shared like a web page. You send a link; the recipient clicks, and NavimetriX opens in their browser, with no account and nothing to install. They replay your trip, with the dials and AIS targets of the time, and read your logbook. They cannot modify anything.

  1. Open the Tracks tab, tap the track’s ⋮ button, then Share replay link (for the track in progress: Share live link).
  2. The “Share this track” window prepares the link.
  3. Tap Copy to paste it into a message, or, on tablet and phone, Send to go through the system share sheet.

A trip replayed in the browser, opened from a share linkA trip replayed in the browser, opened from a share link

Going further

What you need to share

The link is served by your NavimetriX account: the track must first be uploaded there, which requires a connected Premium account and an Internet connection. Until this is done, the share entry is greyed out, or the window says “This track is not on your account yet.”. Wait for synchronization to finish, visible at the top of the Tracks tab.

A track imported from an .nx file, even one received from another user, becomes a trip on your account: it can be shared once uploaded.

Requesting the link of an already shared track again gives the same link: those you have already sent remain valid.

Live

When the track is being recorded, the window shows the “Let them follow this track live” box:

  • ticked: as long as you are sailing, the link shows the position, heading and dials in real time, with a “LIVE” badge. The recipient can go back in the trip’s past; the “Back to live” button brings them back to the present. Once the track has ended, the same link becomes a Replay;
  • unticked: “The link will only open once you end this track.”. A way to share a passage without giving away your current position.

The choice applies to this track only and is sent to the server as soon as you tick or untick the box. The link itself does not change.

Stop sharing

Reopen the share window and tap Stop sharing. The link is revoked: it no longer opens, for anyone, including those to whom you had already sent it.

What the recipient sees

  • The chart frames the trip on opening, and the track keeps the colour you gave it.
  • The playback banner works as in the app: play, timeline, speed set by the zoom (see Replay).
  • The logbook button opens your logbook in read-only mode.
  • The banner’s cogwheel lets them adjust the display for themselves (colour, width, day numbers, boat following, speed); their choices stay in their browser and do not touch your track.
  • On iPhone, they can add the page to the home screen from Safari: opened from that icon, it fills the whole screen, without the browser bars.

To pass a complete trip to another NavimetriX user, who can keep it and annotate it at home, export it as .nx instead: see Import and export tracks.

See also

↑ Contents

13.7 Track Sync

Beginner

The essentials

As soon as you are signed in to your NavimetriX account with a Premium subscription, your tracks go up to the account, old ones and new ones, and every device connected to the same account shows the same list. There is nothing to turn on: synchronization happens by itself, in the background.

  1. Sign in to the same account on each of your devices.
  2. Open the Tracks tab: the account’s list updates, and trips recorded elsewhere arrive like the others.
  3. A trip in progress on another device appears at the top of the list with a flashing red dot. Tap its line to follow it live.

Going further

What follows the account

  • the track and its Replay data;
  • its name: renamed on the computer, it is renamed on the phone;
  • its eye (displayed or hidden on the chart), its colour and its other display settings;
  • its logbook, entered at sea or during a Replay;
  • the archive folders and the filing of tracks;
  • deletions: a deleted track is deleted everywhere.

The logbook’s “Positions” setting, however, stays specific to each device.

Follow the progress

During a synchronization, a discreet line is displayed at the top of the Tracks tab, with a small progress bar: sending track chunks to the account (with their number), fetching a track from the account, a track underway from another device. It disappears by itself when idle. The ⋮ menu of a track that is still uploading also shows “Uploading…” with the number of chunks remaining.

A long track can take several minutes to go up: as long as this line is visible, synchronization is working.

A trip in progress on another device

The navigation recorded by the boat’s tablet immediately appears on the computer left ashore. Its line carries the name of the trip (or of the boat) and, in place of the moving time, “Device:” followed by the name of the recording device. Your own trip in progress is titled “In progress · this device”.

This line has no tick box and no menu: it cannot be exported, filed or deleted while it is being written. Tap it to open it live: the boat advances on the chart in real time, with a “LIVE” badge in the playback banner. When the trip ends, it gives way to the complete track, which arrives in the list like the others.

Without a connection

Everything works on the device first: the track is recorded, the logbook fills in, and the upload to the account happens as soon as the network returns. Nothing waits for the connection. Replay data that has already been uploaded is erased from the device after 7 days; it is retrieved from the account when you replay the trip.

Change account

If you sign out then sign in with another account, the device shows the new account’s tracks and removes those of the old one. They are not lost: they stay on their account and come back if it signs in again, and their GPX files go through the 30-day local trash (see Organize your tracks). The track being recorded is never removed.

Tracks recorded without an account are adopted by the first account that signs in on the device.

See also

↑ Contents

↑ Contents

14 Racing, Fleets and Remote Tracking

This chapter is for those who sail in a fleet or want to follow a boat from afar. Race tracking shows the competitors of an offshore race from the organizers’ files, AIS fleets compare your boat in real time with those you receive by AIS, and the remote cockpit lets you see ashore what the onboard instruments see.

14.1 Race Tracking

Expert

The essentials

Race tracking shows on the chart the competitors of an offshore race, from the files published by the organizers: the list of competitors (.dcc file, in Adrena format) and the position reports (POSADRENA files). With the course’s route, NavimetriX calculates each boat’s remaining distance and a ranking, in real time or in corrected time.

  1. Open the Settings (“‹” handle on the right edge), then “Race tracking”. In “Race file”, tap “Import” and choose the .dcc file supplied by the organizer.
  2. In “Position reports”, enter the server address (“FTP or HTTP URL”, with “Username” and “Password” if needed) and tap “Download”. You can also “Import” a position file received by email.
  3. In “Rankings”, choose the course’s route, then the start date and time, in universal time (UTC).
  4. Open the “Race” tab of the left drawer: the list of competitors, sorted by ranking as soon as positions arrive.

Example: for the Route du Rhum 2026, a race file ready to import and the steps to follow are in the FAQ How to follow the Route du Rhum 2026?

“Race” tab of the left drawer with the Cap Martinique 2024: header, “Sort by ranking”, “Overall / By class”, “Real time / Corrected”, list of competitors with their remaining distance (DTF) and estimated time; on the chart, the fleet’s tracks and the crown of the leaders; skipper names blurred“Race” tab of the left drawer with the Cap Martinique 2024: header, “Sort by ranking”, “Overall / By class”, “Real time / Corrected”, list of competitors with their remaining distance (DTF) and estimated time; on the chart, the fleet’s tracks and the crown of the leaders; skipper names blurred

Going further

The race files

The .dcc file describes the race: its name, and for each boat its name, class, skipper, race number and IRC rating, also called TCC (Time Correction Coefficient). It can also contain the address of the position server, which then fills in the connection fields, and even positions already recorded.

On import, NavimetriX gives each boat a colour according to its rating, from red for the highest (the fastest) to blue for the lowest. If all ratings are equal, each boat gets a distinct colour. You can then change the colour in the competitor’s sheet.

A POSADRENA position report gives, for each boat, its number, latitude, longitude and time. Beware: Adrena coordinates are written in degrees and minutes, not in decimal degrees (47.3211N means 47° 32.11’ N).

Only one race is loaded at a time. “Delete race”, at the bottom of the page, erases it after confirmation.

Fetch the positions

“Race tracking” settings: imported race file (60 competitors, 2418 positions), position reports with their “Download” and “Import” buttons, then the “Rankings” section with the route, target waypoint, method, start date and time in UTC“Race tracking” settings: imported race file (60 competitors, 2418 positions), position reports with their “Download” and “Import” buttons, then the “Rankings” section with the route, target waypoint, method, start date and time in UTC

The “Position reports” section offers three ways of doing it:

  • Download from a server: fill in the “FTP or HTTP URL” and, if the organizer provides them, the “Username” and “Password”, then tap “Download”. For an FTP folder, NavimetriX lists the folder and picks the position files itself. An HTTP address that always returns the latest report also works.
  • “Mode”: “New” only fetches files not yet downloaded; “All” fetches them all again.
  • “Auto download”: NavimetriX downloads by itself every N minutes, set in “Download every” (from 1 to 1,440 min, 180 min by default), without displaying a message each time.
  • Manual import: the section’s “Import” button opens a position file (.txt) stored on the device, one file at a time.

The “Last position” line shows the time of the most recent report. Downloading requires an Internet connection.

The rankings

The rankings are based on each boat’s DTF (Distance To Finish), measured along a course route that you create or import in the Routes tab (see POIs, routes and ZOIs). In the “Rankings” section:

  • “Route:” the course’s route;
  • “Target WP:” the mark the fleet is heading for. The DTF is the boat’s distance to this mark, plus the length of the following segments up to the finish. By default, it is the last point of the route;
  • “Method:” the speed used to estimate the arrival time: “VMC (recommended)”, the average speed at which the boat has been closing on the target mark since the start (VMC, Velocity Made good on Course), or “Average speed”, the distance travelled from one position to the next divided by the time;
  • “Start date (UTC):” and “Start time (UTC):”. A wrong start time gives absurd speeds and times.

The real-time ranking orders the finished boats by their race time, then the others by increasing DTF. The corrected ranking orders the boats by their corrected time: the race time multiplied by the TCC, plus any penalty. For a boat still racing, this time is estimated: time elapsed since the start plus the DTF divided by the average speed of the chosen method. Boats that have retired go to the end of the list.

The Race tab

The “Race” tab of the left drawer shows:

  • at the top, the race name, the number of competitors, of position files and the time of the last position, with the eye that shows or hides the race on the chart;
  • “Sort”: by name, by class, by skipper, by ID, by rating and, as soon as a route is chosen, by ranking;
  • in ranking sort, two choices: “Overall” or “By class”, and “Real time” or “Corrected”. “Corrected” only appears if the ratings differ;
  • a filter field by name, class or skipper, which also accepts a TCC range (for example “>0.98 <1.01”). The filter also applies to the chart;
  • for each boat: TCC, speed over ground (SOG), course over ground (COG), DTF, average speed, estimated times; for a finished boat, the arrival time and its gross and corrected times. “FIN” marks a finished boat, “RET” a retirement.

Tap a boat in the list to select it and centre the chart on it. On the chart, each competitor appears with its track, and a crown marks the leader of the chosen ranking. Names are displayed for selected boats, or for all with “Show boat names” (“Display” section of the settings).

Edit a competitor

In Settings > Race tracking, the “Competitors” section lists the boats. Tap one to open “Edit competitor”: boat name, skipper, class, “Boat ID” (the number that links the boat to its positions), “Rating” (the TCC, for example 1.026), “Penalty” in minutes, colour, “Finished” with the arrival date and time (UTC), and “Retired”. Tap “Save”.

See also

↑ Contents

14.2 AIS Fleets

Expert

The essentials

An AIS fleet is a list of boats you want to watch: your direct competitors in a race, or the boats of a rally. NavimetriX compares them continuously with your boat, from their AIS positions (the system by which vessels broadcast their identity and position): who is ahead, who is offset to the side, and how many metres each gains or loses per minute.

  1. Open the left drawer, “AIS” tab, and choose the “Fleet” page at the top.
  2. Add boats: in the “Targets” page, tap the flag to the right of a boat (or the one on its sheet); or else, in the “Fleet” page, ⋮ menu, choose “Quick add on the chart” then tap the boats on the chart. The first addition creates the fleet “My fleet”.
  3. In the same ⋮ menu, choose the comparison axis: “Compare towards the mark”, “Compare along the wind” or “Compare along a bearing”.
  4. Read the fleet list, or tap “Open the table” for the full window: one boat per line, sortable columns, gain curves.

You need to receive AIS targets, through a receiver connected by NMEA or over the Internet (see Navigation: GPS, NMEA and AIS).

Going further

Create and manage fleets

The drop-down menu at the top of the “Fleet” page lists your fleets. Choosing a fleet follows it on the chart; “None” no longer shows anything of the fleet on the chart and stops the calculations, while the flags keep adding or removing boats to the active fleet. The last line, “Manage fleets…” (also in the ⋮ menu), opens the “AIS fleets” window (the “Close” button stays at the bottom, the list scrolls above it):

  • “Fleets”: choose the active fleet (the orange dot), “Rename” it or delete it with the bin, create one with “New fleet name” and “Create”;
  • the active fleet’s boats (section “Boats in”, followed by the fleet name). Give each a “Nickname” more telling than its AIS name, tap its badge to switch to the next colour, or remove the boat with the bin;
  • adding by “MMSI” (the boat’s AIS identification number) and “Name (optional)”, then “Add”: useful for a boat you are not receiving yet;
  • “Boats received (nearest first)”, with a filter by name or MMSI, to add a received boat in one gesture.

Each boat gets a colour from a palette readable by colourblind people. Fleets are saved with your account settings.

The flag and quick add

The flag is empty for a boat outside the fleet, filled with its colour for a member. A tap adds it to the active fleet or removes it; a long press offers to add it to another fleet or remove it from one. It does not exist for your own boat or for aids to navigation.

With “Quick add on the chart”, a banner appears above the chart: each tap on a boat adds or removes it instead of selecting it, and the banner gives the number of boats in the fleet. Tap “Done” to return to normal operation. After each addition or removal, a message confirms it for a few seconds with an “Undo” button, very handy after a mistaken tap on a crowded starting line.

The comparison axis

The whole comparison is made along an axis, which you choose in the ⋮ menu or, from the table, in the “Compare” list:

  • “Compare towards the mark”: the axis points to the active mark, that of the followed route or of the “Goto”. A boat’s advance is your distance to the mark minus its own. Without an active mark, the page says so and offers the other axes;
  • “Compare along the wind”: the axis follows the true wind direction measured by your instruments, turned towards the wind when you are upwind, the opposite when you are downwind. This requires an anemometer connected by NMEA;
  • “Compare along a bearing”: a fixed bearing that you enter in the “Bearing” line that then appears (from 0 to 359°).

The average is also set in the ⋮ menu: “Average over 2, 5, 10, 20 or 30 min” (10 min by default). The speeds, the VMC and the gain in the list are calculated over this window from the boats’ actual movement, not from the speeds announced by AIS, which are too noisy (a class B boat only transmits its position about every 30 seconds). To compare two boats at the same moment, NavimetriX takes your position at the time of the competitor’s last received position.

A discreet line, under the fleet menu, recalls the axis and the window (“Towards [mark] · 10 min”, “Upwind · wind 245° · 10 min”…) or says why the comparison is impossible.

The list

The list gives one line per boat, yours included (“Us”): rank along the axis, gain per minute (green if gaining, red if losing), speed, VMC (the speed towards the mark or along the axis), advance, lateral offset and tack. Each line reads in two steps: the name and the gain, then a line of figures that wraps without separating a value from its label when the panel is narrow. A boat whose last position is more than 3 minutes old shows its age (“4 min ago”); a member never received shows “waiting”. The “Sort” menu orders the list by gain, advance, VMC, speed, distance or name. Tap a line to centre the chart on the boat.

The fleet table

The “Open the table” button, under the fleet selector, opens a working window: one boat per line, one column per quantity. On a computer it is a real window; on mobile and in the browser, a built-in window with a “Close” button. It refreshes every second while it is open (an AIS position only arrives about every 30 seconds for a class B boat, however).

  • Frozen rows and columns. The header and the first two columns (rank and name) stay in place while the rest scrolls. Your “Us” line is sorted with the others (no rank), on an orange background.
  • Sorting. Tap a header: descending sort, the biggest values first (the fastest, the northernmost); tap it again: ascending sort. Rank, name, tack and MMSI do the opposite: ascending first. An arrow ▲ or ▼ marks the sorted column. Missing values always go to the bottom. When opened, the table is sorted on “%”.
  • Columns. Drag a header sideways to move the column (except rank and name). The “Columns” button (“Settings” on a narrow window) shows or hides each one. The “Latitude” and “Longitude” columns (LAT, LON), at the far right, are hidden by default. The order and the choice are remembered.
  • Acronyms or names. The “Acronyms | Names” selector in the top bar (in the “Settings” menu on a narrow window) chooses “SOG 5 min” or “Speed 5 min”, as for the instrument tiles. By default it follows the instruments’ “Tile titles” setting, until you choose in the table.
  • Axis. The “Compare” list changes the axis (towards the mark, along the wind, along a bearing): it is the same setting as the panel’s ⋮ menu. The title of the first column says what it is about: “Rank to mark”, “Rank upwind”, “Rank downwind” or “Rank on bearing” (as acronyms: # WPT, # UPW, # DNW, # AXIS).
  • Pause. The “Pause” button freezes the table, the three bottom lines and the graph at the instant of the click, to read them without the figures moving. The data keeps arriving; “Resume” gives control back.
  • Narrow window. The bar shrinks to “Compare”, “Pause” and a “Settings” button. Its menu holds “Graph”, “Comparison”, “Acronyms in the headers”, then the list of columns. On a wide window, “Comparison” and “Graph” are switches in the bar.

The columns:

AcronymNameContent
# WPT, # UPW…Rank to mark…The boat’s place along the comparison axis (1 = the most advanced), yours included. Empty without an active mark or without wind.
NameNameThe boat’s nickname, otherwise its AIS name.
% avg SOG% of fleet average speedThe boat’s speed over ground over 20 min divided by the fleet average (you included, up-to-date boats only), × 100. Above 100 %, it is faster than the average.
AgeLast positionAge of the last position received.
DTWDistance to markDistance from the boat to the active mark.
DISTDistanceDistance between you and it, now: its last position is advanced according to the speed and the course over ground it transmitted (position less than 3 min old), so as not to count up to 30 s of delay. Under 1 NM, in metres.
BRGBearingBearing of it as seen from you, calculated the same way.
SOGSpeed over groundSpeed over ground as the boat transmits it.
SOG 5 min, SOG 20 minSpeed 5 min, 20 minSpeed over ground calculated from its movement over 5 and 20 minutes (more reliable than the transmitted speed).
COG, COG 5 min, COG 20 minCourse over ground, Course 5 min, Course 20 minThe same for the course over ground.
VMC 5 min, 20 minSpeed to markThe part of its speed that brings it closer to the active mark. Empty without an active mark.
CMG 5 min, 20 minCourse vs markAngle, signed and rounded to the degree, between its course over ground and the bearing of the mark.
Gain m/minGainMetres gained (+) or lost (−) per minute on you along the axis, over the panel’s averaging window (the window appears in the header, “Gain m/min 10 min”).
TrendTrendMini-curve of the last 20 minutes: red when the boat is gaining ground on you, green when you are gaining on it.
TackTackThe tack it is sailing on.
SET/DRIFTCurrentTidal current from the atlas at its position and at the current time: speed, then the direction it flows towards. “—” outside the areas covered by an atlas. GRIB currents are not taken into account.
CUR ALONGCurrent along the courseThe part of the current in the direction of its course over ground: positive (green) if it pushes the boat, negative (red) if it slows it down.
CUR CROSSCurrent across the courseThe part that sets it sideways, with an arrow towards the side it pushes it: → towards starboard, ← towards port.
N/SNorth or south of usNorth-south offset from you, in miles: ↑ if it is further north, ↓ further south. Sorting on this column ranks the boats from the northernmost to the southernmost.
E/WEast or west of usThe same from east to west: → if it is further east, ← further west.
MMSIMMSIAIS number.
LAT, LONLatitude, LongitudeThe boat’s position, in the coordinate format chosen in the settings. Hidden by default.

The row background follows the “%”: green at 101 % and above (faster than the average), yellow around 100 %, red at 98 % and below, orange for your line. On a wide window, a legend under the top bar recalls the meaning. For a boat to count in the averages, it needs enough history: after NavimetriX is launched, the 20 minutes take a while to fill.

The three bottom lines compare your boat with a competitor: “Us”, the difference “Δ” (your values minus theirs, speeds in green when you go faster, in red when slower), then the comparison boat. To change the comparison boat, tap its line in the table (the chart also centres on it). By default, it is the boat with the highest “%”. The “Comparison” switch (“Settings” menu on a narrow window) hides these three lines.

The graph (“Graph” switch to show or hide it) shows, for each boat, its position relative to you over the last hour: above the zero line, it is ahead of you; below, behind. A rising slope signals a boat that is gaining. The comparison boat is drawn with a thick line, the others with a thin line; the legend gives each one’s colour. The history is kept in memory as long as NavimetriX is running (up to one hour); it starts empty again at the next launch.

The fleet table: sortable columns, the three bottom lines (Us, Δ, comparison boat) and the gain curves over the last hourThe fleet table: sortable columns, the three bottom lines (Us, Δ, comparison boat) and the gain curves over the last hour

On the chart

When a fleet is followed, its boats are always labelled, their name in the usual AIS target colour (red, amber in night mode), with their average speed and their gain in place of the raw speeds, and their wake is drawn in their colour. The page’s label becomes “Fleet (5)”, with the number of members.

In replay

The comparison also works during the replay of a track recorded with its AIS targets: the recorded fleet is compared with your track, at the moment shown by the timeline. It is a chance to review, at leisure, where a race was won or lost (see Replay).

The “Fleet” page sorted by gain: the “Us” line highlighted, and the “Open the table” button above the listThe “Fleet” page sorted by gain: the “Us” line highlighted, and the “Open the table” button above the list

See also

↑ Contents

14.3 Remote Cockpit

Expert

The essentials

The remote cockpit sends the onboard data, NMEA and AIS, over the Internet from one device to another. The device left ashore then shows what the boat’s device sees: position, instruments, AIS targets, track. Both devices must be connected to the same NavimetriX account: there is nothing else to pair. Broadcasting requires the Premium subscription.

  1. On the onboard device, open the Settings (“‹” handle on the right edge), then “GPS & NMEA”. At the very bottom of the page, in the “Remote cockpit” section, choose “Broadcast”.
  2. On the device ashore, in the same place, choose “Follow”.
  3. The device that follows switches to Navigation mode by itself and centres the chart on the boat as soon as the first position is received.
  4. To stop, set the setting back to “Off” on each of the devices.

“Remote cockpit” section of the Settings, GPS & NMEA page: “Off / Broadcast / Follow” selector and “Auto broadcast in navigation” switch“Remote cockpit” section of the Settings, GPS & NMEA page: “Off / Broadcast / Follow” selector and “Auto broadcast in navigation” switch

Going further

The settings

The “Remote cockpit” section has two lines, specific to each device:

  • “Remote cockpit”: “Off” (default), “Broadcast” or “Follow”. A device broadcasts or follows, never both at once.
  • “Auto broadcast in navigation” (off by default): the device broadcasts as soon as Navigation mode is turned on and stops when it is turned off, going back to its previous setting. As long as this option is ticked, the selector above is greyed out: Navigation mode controls it.

Onboard: the device that broadcasts

The broadcasting device sends what it receives from the onboard instruments, at most one NMEA sentence of each type per second. If it has no external GPS, it sends the position of its own GPS. It also relays the AIS targets picked up by the onboard receiver, but never those received over the Internet.

It needs an Internet connection (coastal 4G, Starlink…) and the Premium subscription. Without coverage, nothing is sent.

Only one device broadcasts per account

All the devices of an account share the same channel: two devices broadcasting at the same time would mix two streams, and the followed boat would jump from one position to another. NavimetriX therefore only allows one broadcaster per account.

  • Before its first broadcast after launch, the device asks the account whether another is already broadcasting, and waits up to 5 seconds for an answer.
  • If another device is broadcasting, a window names it and offers to transfer the broadcast: “Broadcast here” or “Cancel”. If that other device is under way and this one is not, the window says so clearly: a device left at the pontoon could otherwise cut the broadcast of a boat at sea.
  • Refusing turns off broadcasting and automatic broadcasting on this device, so that the question does not come back at each departure.
  • The device that loses the broadcast stops and announces it: “Broadcasting has been taken over by another device”, specifying where applicable that its “Auto broadcast in navigation” option has been switched off.

Ashore: the device that follows

When you choose “Follow”:

  • the device switches to Navigation mode and recentres the chart on the boat at the first position received;
  • its own sources are deliberately turned off: internal GPS and local NMEA connection. Otherwise, its position would mix with that of the followed boat. Your NMEA setting is restored when you set it back to “Off”;
  • the instruments, AIS targets and track displayed are those of the followed boat. The device does not record this track: the trip is recorded by the boat itself;
  • all alarms are turned off: the following device is only an observer, and a loss of link is not a loss of GPS.

When set back to “Off”, the device leaves Navigation mode, unless an anchor alarm is armed on it (see Anchor alarm).

Watching a trip in progress from the Tracks tab, on a device that is not sailing, also sets the remote cockpit to “Follow” for the duration of the watch, so that the dials are in real time, then restores the previous setting (see Track sync).

What you need to know

  • Both devices need the Internet.
  • Broadcasting requires Premium on the onboard device.
  • To show the boat to people who do not have your account, use a track’s share link instead (see Share a track).

See also

↑ Contents

↑ Contents

15 Help and troubleshooting

This chapter gathers the first things to try when NavimetriX closes by itself, when the display slows down or when the app refuses to work on a Windows PC. It also explains how to write to support from the app, with the log that helps us understand what happened, and what the About page contains.

15.1 Troubleshooting

Beginner

The essentials

NavimetriX runs on very different devices, from the entry-level phone to the desktop PC. On a device with little memory, an unexpected closure or a display that slows down most often comes from full memory. A few steps solve most cases:

  1. Install the latest version. Your version number is shown in Settings > About. At launch, the app itself warns you when a more recent version exists: “A new version is available. Would you like to update your version?”.
  2. Delete outdated routings in the Routings tab of the left drawer. Kept routings are reloaded at every start.
  3. Lighten the chart: hide the layers and tracks you do not need, and turn on Settings > General > Energy saving.
  4. Close other apps to free memory, especially on phone and tablet.
  5. If the problem persists, write to support from the app, right after the incident: the app log goes with your message. See Contact support.

Going further

Unexpected closure at launch or during use

  • At launch: kept routings are reloaded at every start, and they are also kept on your account for synchronisation between devices. Ensemble routings (calculated over several weather scenarios) are particularly heavy. Keep only the routings in progress: a routing is only of interest as long as the forecasts it uses are valid. To keep a record of it, export it or turn it into a route with “Convert to route”.
  • During use: the end of a heavy calculation can saturate memory, for example a long routing with a very short “Isochrone duration”, or an ensemble routing. Leave this setting on “auto” (its default value, in Settings > Routing), unless you have a specific reason. See Weather routing.

Slow display or black areas

A scroll or zoom that stutters, or chart areas that stay black, often signal full memory on a device with little of it. Free memory by closing other apps, then lighten the display:

  • Layers: turn off in the layers menu those you do not use.
  • Tracks: in the Tracks tab, close the eye of the past tracks displayed. For the live track, choose ⋮ > Display > Live track extent > Short (the last 20 minutes). See Record and display the track.
  • Forecasts: displaying wind and current as animated particles demands more of the graphics card and the battery. When sailing, prefer arrows or barbs.
  • Starry sky: Settings > General > Starry sky draws stars, the atmosphere halo and the heavenly bodies around the globe when you zoom out. Purely decorative, it can be turned off if the graphics card struggles.
  • Energy saving: Settings > General > Energy saving spaces out the refresh of instruments, the internal GPS and alarms, and turns off animated wind and current particles. This setting is specific to the device and off by default. It does not exist in the browser version.

The app does not work on a Windows PC

The variety of PCs makes diagnosis difficult. Check in order:

  1. The app version: in Settings > About (“Version x.y.z”). Update if the app offers it at launch.
  2. The Windows version: compare it with the minimum required versions.
  3. The network: the app downloads the coastline, chart backgrounds and weather over the Internet. Try another network (phone tethering instead of Wi-Fi, or the reverse), turn off any VPN, and on a corporate network check that a firewall is not blocking these downloads.
  4. Restart the PC.
  5. The users’ Facebook group (“Join our Facebook group” button in Settings > About): other users may have met the same problem.

If nothing helps, the PC may not have enough RAM, or its graphics card does not meet the app’s requirements. Write to us from the app so that we can look at the log.

On Windows only, Settings > General > Font enlarges or reduces the interface texts (from 75 to 250%), in addition to the “Display scale” setting common to all platforms. A font change requires relaunching the app.

See also

↑ Contents

15.2 Contact support

Beginner

The essentials

Before writing, search the FAQ: the answer is often there. The ? button, to the left of the “Settings” title at the top of the settings drawer, opens it in your browser.

To write to support, preferably go through the app: the app log (the file where NavimetriX notes what it does, its warnings and its errors) goes with your message and shows us what happened.

  1. Open Settings (the ‹ handle on the right edge of the screen), then Contact us.
  2. On computer, choose the Method: “Mail” (your email software) or “Gmail” (Gmail opens in the browser).
  3. Tap Send a mail to support.
  4. In the “Contact support” window, describe the problem: what you were doing, and what you expected. Tap Send.
  5. The log goes to our servers, then a reference number is displayed: “We have received your log. Reference: …”. It is copied to the clipboard and included in the message that opens next. Complete that message if needed, then send it.

“Contact support” window: two-line description, character counter and “Cancel” and “Send” buttons“Contact support” window: two-line description, character counter and “Cancel” and “Send” buttons

Going further

The message to support

  • The description is required: Send stays greyed out as long as it is empty. It accepts up to 4,000 characters, a counter shows this.
  • Preferably write right after the incident: the app updates the log on disk just before sending, so the incident is in it. The log is rotated when it reaches a certain size; if it has just been, the previous file goes too.
  • Add screenshots to the email if they help to understand. They read better than photos of the screen.
  • Without an Internet connection, or if sending the log fails (“The log could not be sent. It will be attached to your email instead.”), the message opens without a reference number. On phone, on tablet and with “Mail” on Mac, the log is attached automatically. On Windows and Linux, or with “Gmail”, it is copied as navimetrix.log to the Desktop (to the Downloads folder on Mac): attach it yourself, the message explains this.

If the log is not attached and you want to add it yourself, it is located here:

  • Windows: C:\Users\[your user name]\AppData\Local\Soft4Sail\NavimetriX\logs\navimetrix.log
  • macOS: ~/Library/Containers/navimetrix.soft4sail.com/Data/Library/Application Support/Soft4Sail/NavimetriX/logs/navimetrix.log (the Library opens in the Finder with Go > Go to Folder…)
  • Linux: ~/.local/share/Soft4Sail/NavimetriX/logs/navimetrix.log

Outside the app, use the site’s contact form.

The other help in the settings drawer

  • Quick Start: the getting-started guides. See Getting started and interface.
  • About: the app’s name and version number at the top of the page, then:
    • “Version history”: the news of each version;
    • “Visit our website”;
    • “Join our Facebook group”: the NavimetriX users’ group, where others may already have met your question;
    • “Privacy policy”;
    • “Rate NavimetriX”: opens the app’s page in the App Store or Google Play Store, on macOS, iOS and Android only.

Anonymous usage statistics

In About, the “Share anonymous usage statistics” switch is on by default. These figures tell us which features are used, and therefore which deserve to be kept and improved. They contain no position, boat name or address.

Turn the switch off to refuse: the app erases what it had queued on the device and asks the server to erase what it already holds for this device. If the request does not succeed, for lack of network for example, it is repeated at the next launch.

See also

↑ Contents