Wave settings
Open the Settings panel by tapping the gear icon at the top right of the toolbar, then select Forecast display.
- Wave display
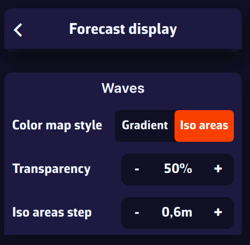
In the "Waves" section, select the Iso zones colour style, which represents wave height data as isopleth bands of equal height, using rainbow colours from blue (calm sea) to magenta-red (rough to very rough sea), passing through various shades of green, yellow, orange and red. Particularly well suited for wave data.
Transparency lets you adjust the colour mask depending on the background (satellite planisphere or nautical chart).
Iso zone step lets you adjust the spacing of the isopleth bands relative to the data type (e.g. in 0.60 m increments).
Displaying waves
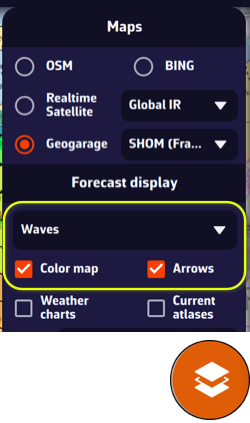
On the chart, the Layer button at the bottom right of the screen lets you choose what to display.
In the Forecast display section, the drop-down menu lets you select a data layer to display. If you have loaded a wave GRIB file on screen (for example an MFWAM model), the Waves data will be selected by default. You can toggle the display of the colour fill and barbs according to your previous settings (see above), and optionally isobars (lines of equal atmospheric pressure).
This section automatically adapts to the type of GRIB file currently displayed: weather, waves, or currents.