Setting the weather data display in NavimetriX
Open Settings by tapping the chevron handle (‹) on the right edge of the screen, then select Forecast display. The page has nine sections: Wind, Pressure, Currents, Waves, Precipitations, Temperature, Cloud cover, CAPE and Lightning.
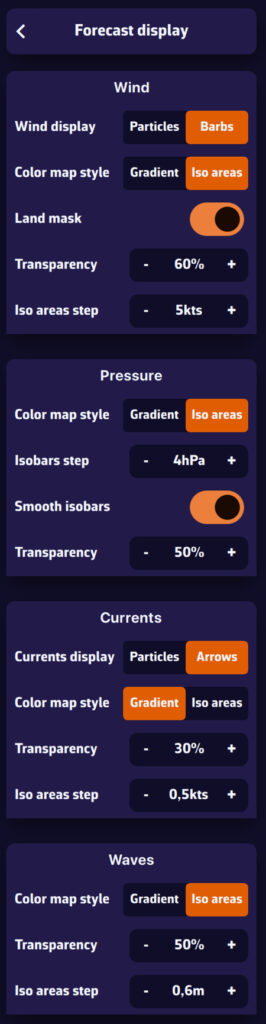
These settings define how the data is drawn. Which data is shown (wind, pressure, rain…) and which layers are visible (Color map, Barbs or Arrows, Isobars) is chosen in the menu of the round orange layers button, Forecast display section.
Wind
- Wind display: Particles (small animated particles following the flow, very telling but heavier on the battery) or Barbs (the classic display of wind direction and strength).
- Particle density: from 25 to 300 % (100 % by default).
- Particle length: from 25 to 150 % (100 % by default), the length of each particle's trail.
- Color map style: Gradient (continuous colour variation with wind strength) or Iso areas (colour bands, e.g. 5-10 knots, 10-15 knots).
- Land mask: on by default, it hides the colour map and the barbs over land so that only the sea shows. When off, the wind data stays visible over land. When you zoom in very close (a harbour view or closer), the colour map disappears altogether, sea included.
- Transparency: how visible the colour map is over the chart.
- Iso areas step: the width of the wind bands in knots, for the Iso areas style.
Pressure
- Color map style: Gradient or Iso areas (colour bands by pressure range).
- Isobars step: the interval between two isobars, from 1 to 5 hPa (2 hPa by default).
- Smooth isobars: on by default, it rounds off the isobar lines.
- Transparency: how visible the colour map is.
The isobars themselves (the lines) are shown by ticking Isobars in the layers menu.
Currents
- Currents display: animated Particles or Arrows showing current direction and strength.
- Particle density: from 25 to 300 %. It also applies to the SHOM current atlases, as particles or as arrows.
- Particle length: from 25 to 150 %.
- Color map style, Transparency and Iso areas step (in knots): as for the wind.
- Speed values: shows the current speed next to the arrows when you zoom in close (a harbour view or closer).
Waves
- Color map style: Gradient or Iso areas for wave height.
- Transparency: how visible the colour map is.
- Iso areas step: the width of the height bands, in metres.
Wave direction is shown by arrows, ticked in the layers menu (Arrows box). See How do I display waves?
Precipitations, Temperature, Cloud cover, CAPE
Each of these sections offers a Transparency setting for the colour map.
Lightning
- Max strikes: from 100 to 1,000 strikes displayed (500 by default).
- Max age: from 10 to 120 minutes (60 by default); older strikes disappear.
Energy saving mode
When Energy saving is on (Settings, General, Power section), wind and current particles are switched off: the chart draws barbs and arrows. The Wind display, Currents display and Particle length rows, and the wind particle density, are then greyed out. Your choice is kept and comes back as soon as you turn energy saving off.
Tip: use particles or iso areas for a better reading of large-scale conditions. At sea, prefer barbs and isobars, which are more precise and use fewer resources.