The Report tab of the polar editor runs by itself when a polar is selected and returns a score out of 100 with a list of observations. Each observation is clickable and takes you to the view concerned.
It works on three levels.
1. Internal consistency
What the polar says about itself: isolated spikes, curves crossing where they should not, targets progressing irregularly, a smoothness index that is too low. These are the defects a spreadsheet lets through and a routing amplifies.
2. Comparison against the fleet
Your polar is compared with the five nearest boats in the library, matched on raw speeds. Cells more than 30 % away from those neighbours' median are highlighted in red in the Table.
Read this carefully: a gap is not an error. If your boat really is faster than its neighbours, that is normal. The report flags; it does not judge.
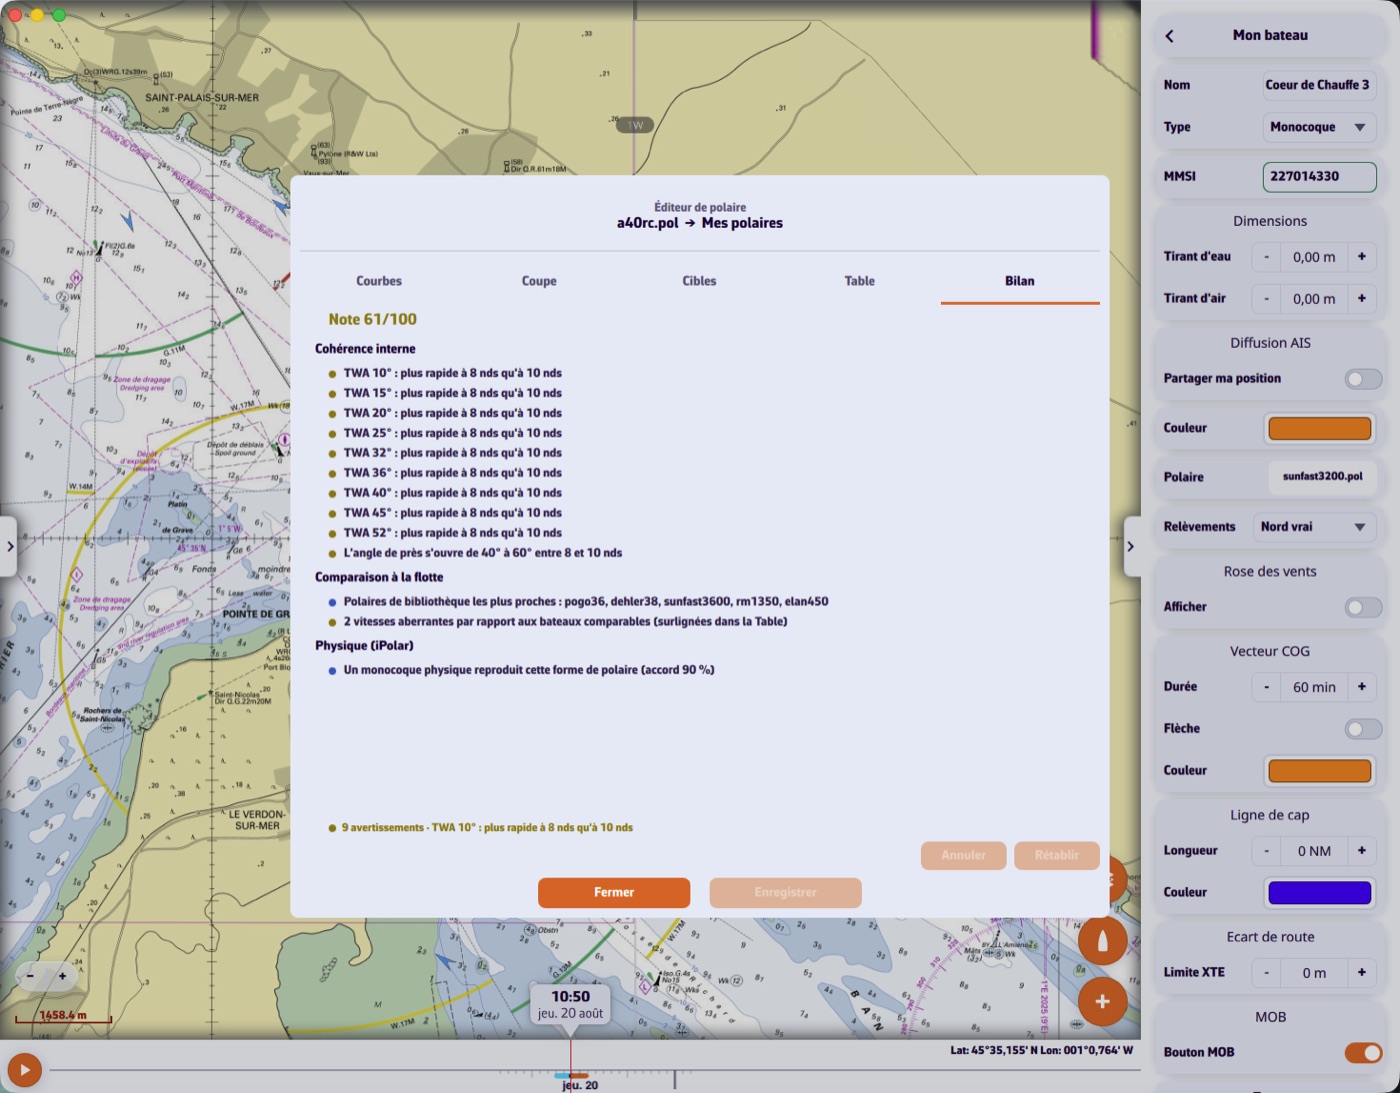
3. Physical plausibility
The last level compares the shape of your polar with what a monohull can physically produce, using the model that already drives our iPolar generator.
It answers one question and one only: can a real monohull produce this shape? It gives a percentage of agreement — below 85 % it warns, below 75 % it flags.
What this level does not do: identify your boat or guess its dimensions. The inverse problem is mathematically unstable — length and speed scale are indistinguishable — and we preferred to show nothing rather than a wrong number.
This report applies to monohulls only. On a multihull the physical level is meaningless and its conclusions should be ignored.