You can display simulated navigation data all along the routing.
When isochrones are displayed, data labels in the same colour as the routing boat allow you to track progress along the route. In addition, clicking/tapping on each label displays the data graph from the start to the end of the route.
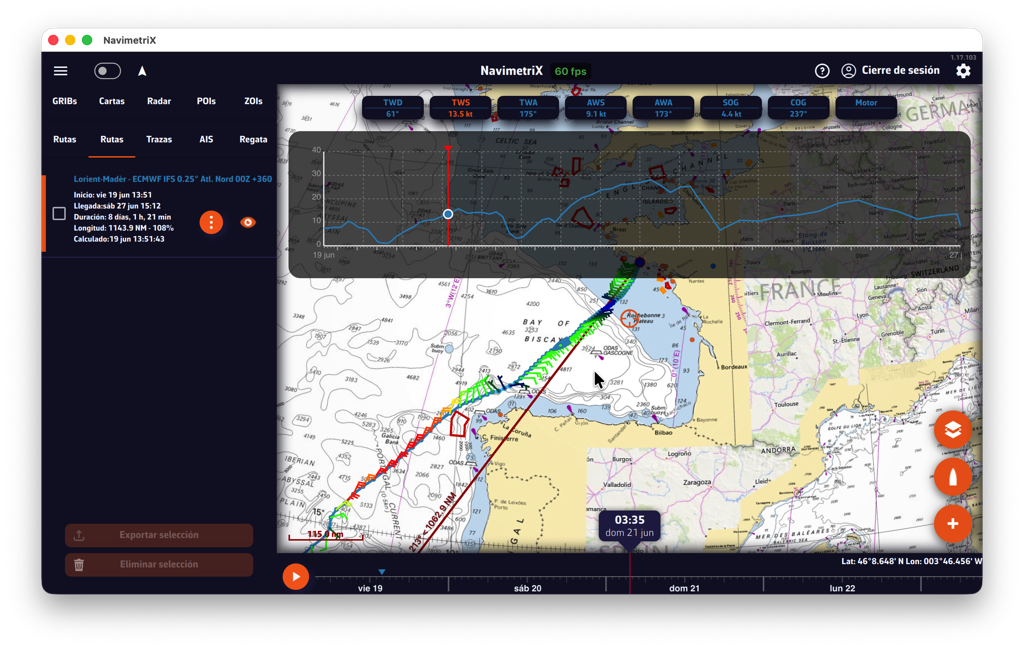
Scroll the boat along the route by dragging the timeline. A "Play" button at the start of the timeline allows automatic timed scrolling.

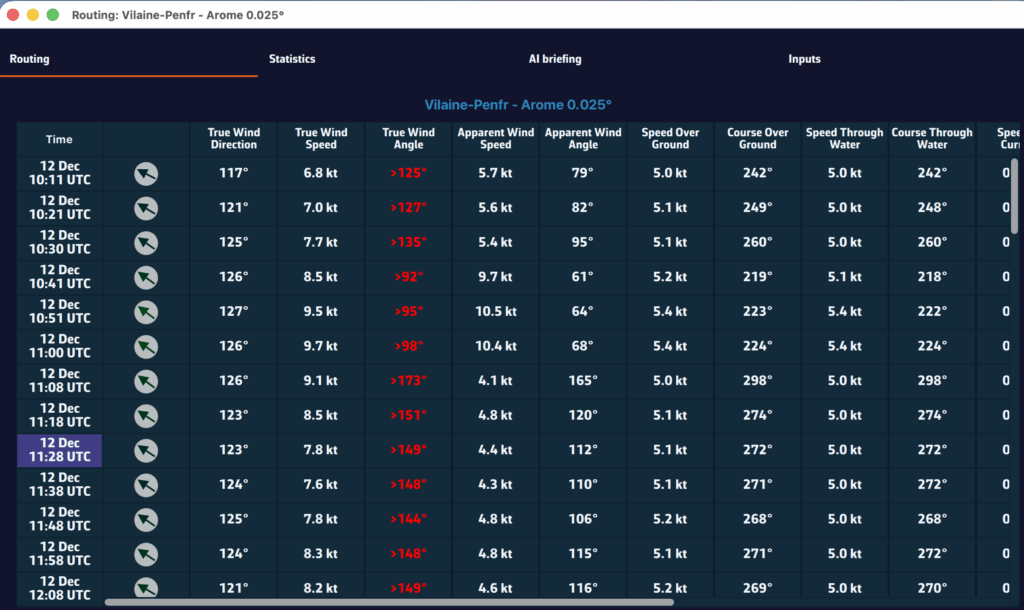
Tapping the "kebab" button opens an actions menu; the "Details" function opens the automatically generated routing table window.