Once the routing is computed, the optimal route is shown on the chart together with the isochrone curves. These curves represent the positions that can be reached at successive time intervals from the start point.
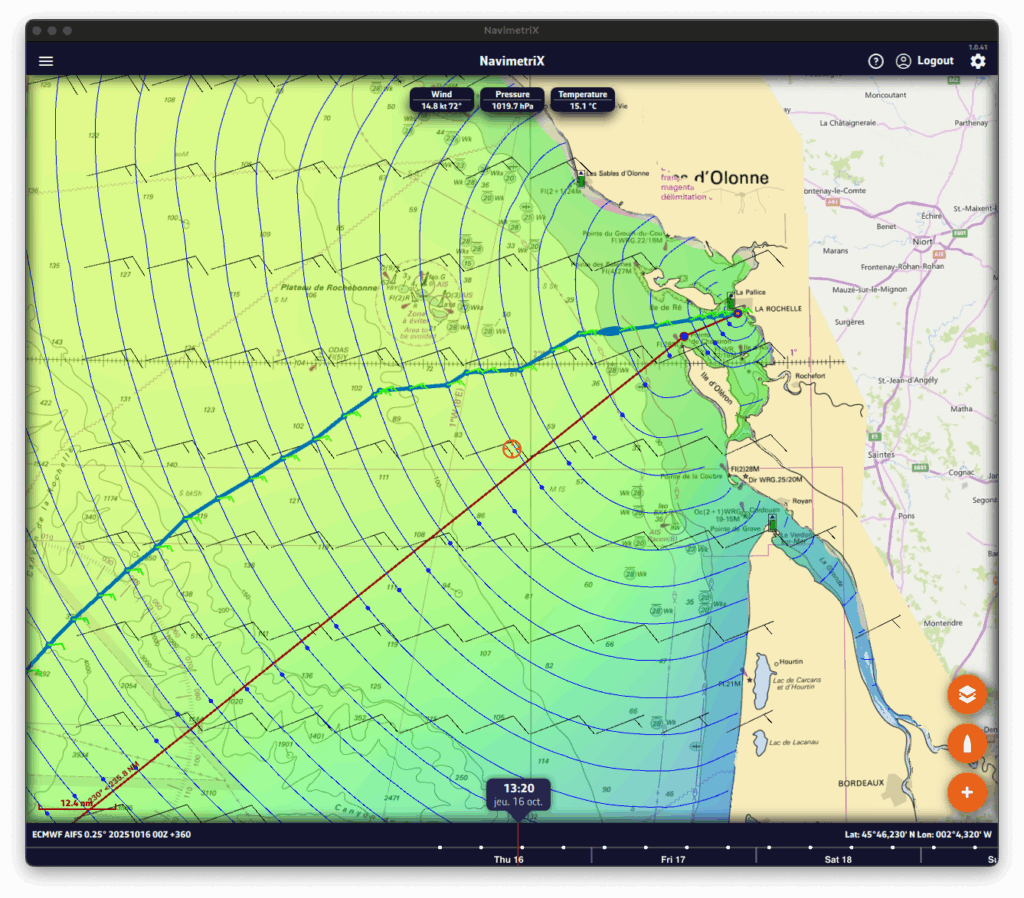
You can move the boat along the route in two ways:
- by dragging the timeline,
- or by tapping directly on the routing at the desired location.
At each intersection between the optimal route and an isochrone, a wind barb is drawn. It indicates the strength and direction of the wind at the moment the boat reaches that position. This is the average wind speed on the isochrone, i.e., the average true wind speed (TWS) used for the routing calculation, which is therefore interpolated geographically and temporally. This is the value found in the routing table. If you are routing with a current, a current arrow will also be drawn according to the same principle as the wind.
Routing list

Open the lists panel and select the Routing tab. This tab lists all computed routings.
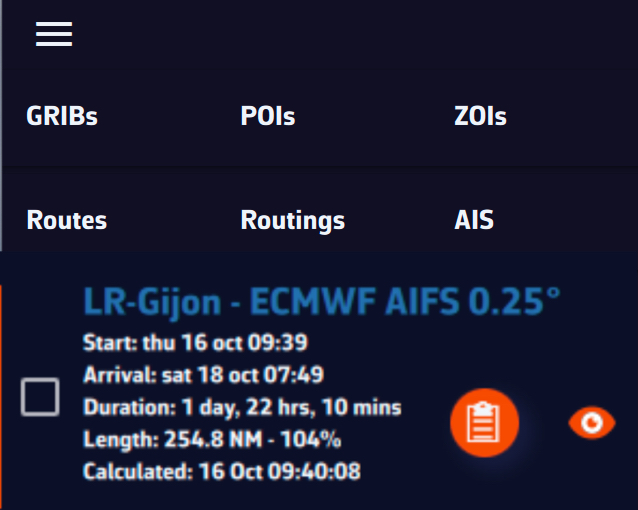
For each routing you’ll see:
- The routing name, shown in a specific color (matching the route color on the chart).
- Departure and arrival times.
- The total duration of the routing.
- The route length and the increase vs. great-circle distance (i.e., the shortest path between start and finish).
- The calculation timestamp.
- A round button to open the routing table.
- An eye icon to show/hide the routing on the map.
The routing table and its tabs

Click the orange button to open the routing table. It contains four tabs, each presenting a different facet of the computation.
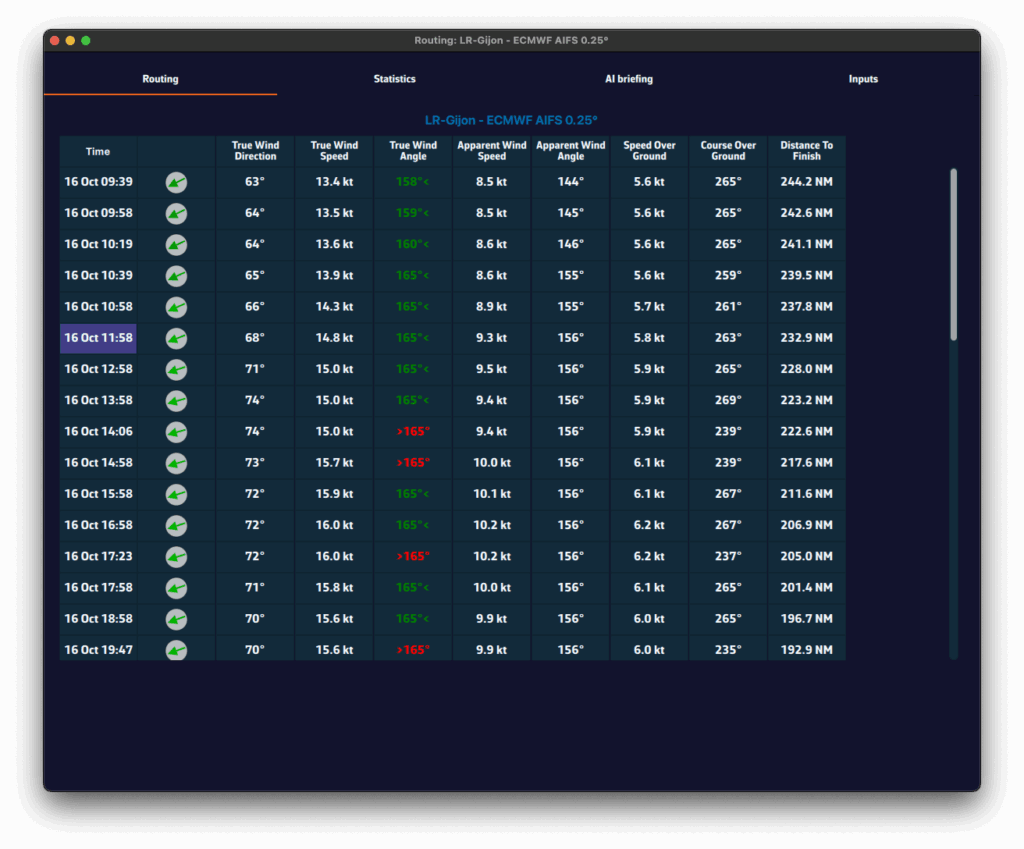
- Routing tab
- Shows, for each isochrone, the boat parameters at that time: speed, wind angle, position, etc.
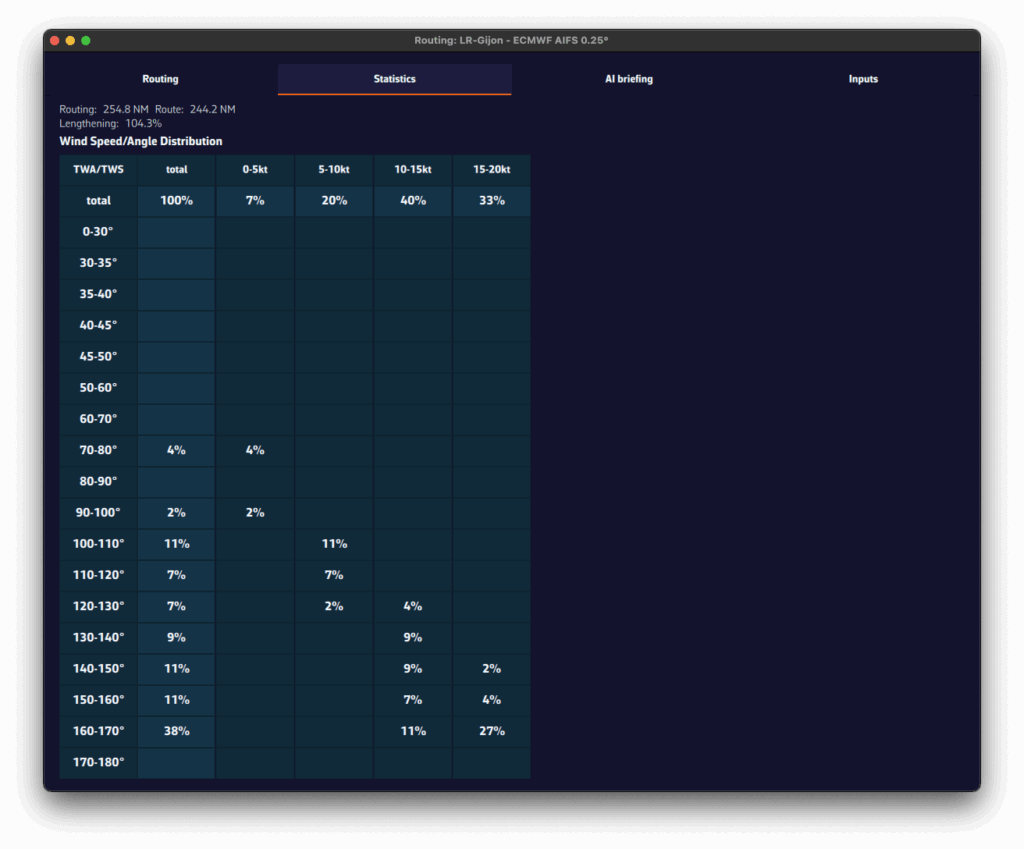
- Statistics tab
- Displays the distribution of speeds and wind angles encountered during the routing.
- Helps you see whether you’ll sail mostly upwind or downwind, and assess the average wind strength.
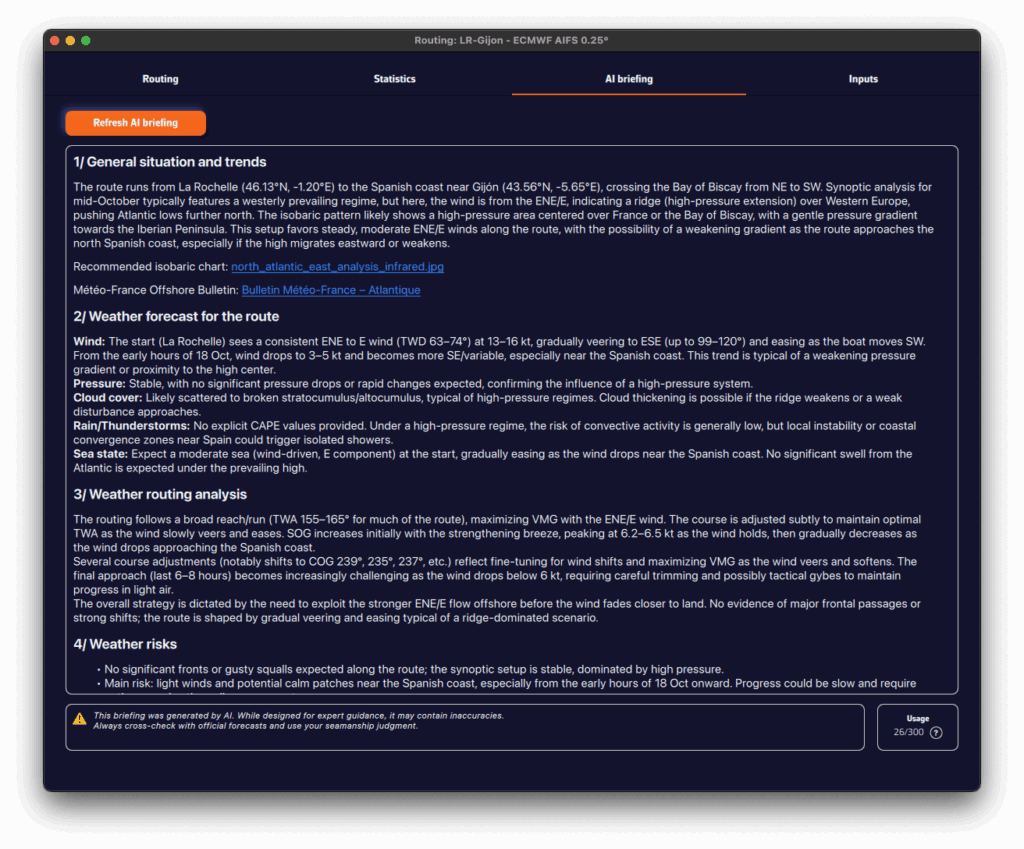
- AI Briefing tab
- Automatically generates a weather briefing using our AI.
- When you click Generate AI Briefing, the routing data are sent to our AI server.
- The AI returns a complete briefing with four sections:
- 1. General situation & evolution
- 2. Forecast along the route
- 3. Routing analysis
- 4. Weather risks
- It also includes links to synoptic charts and to the Météo-France bulletin.
- The AI Briefing is a Premium feature. Generation uses AI servers billed per use. Each Premium subscriber has a credit of 300 AI briefings per year, calculated on a rolling 365-day window.
- ⚠️ Warning: this briefing is generated automatically by artificial intelligence. It may contain inaccuracies or errors. Always consult official forecasts and exercise sound judgment and good seamanship in your decisions. The skipper remains solely responsible for the safety of the vessel and crew.
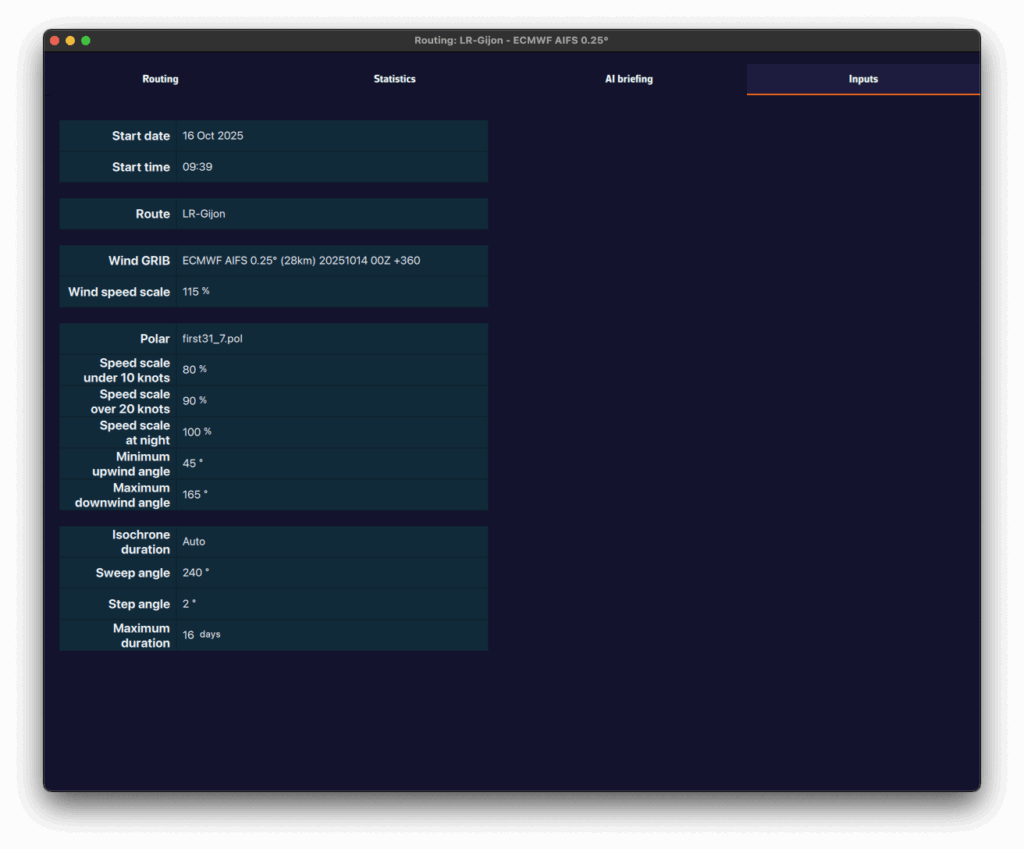
- Input tab
- Summarizes all parameters used for the computation: weather models, coefficients, constraints, and departure settings.