The instruments display your boat's live data (wind, speed, heading, performance, energy, depth…) coming from the NMEA / GPS network. The gauges refresh continuously and can be arranged freely to suit your needs.
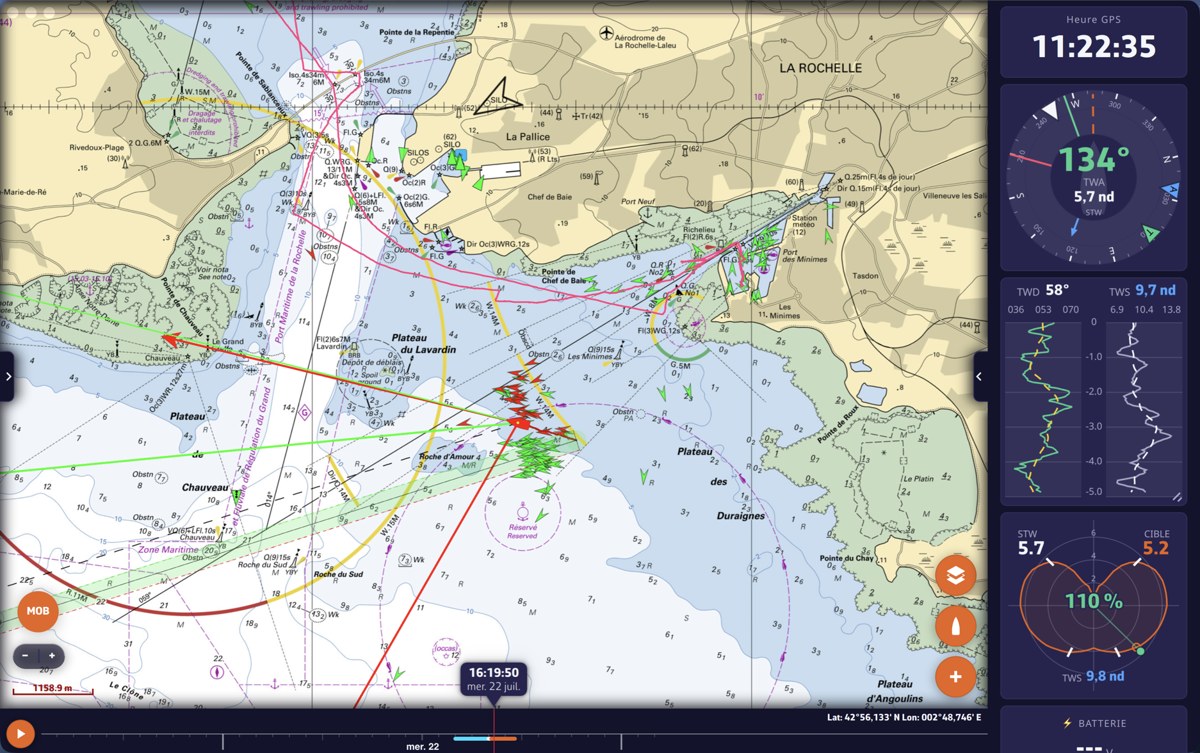
Where the instruments appear
All instruments live in a single, reorderable bar whose shape adapts to the screen orientation:
- Horizontal bar at the top of the screen (portrait mode);
- Vertical dock on the side (landscape mode), on the right by default;
- On the chart: any instrument can be detached from the bar and dropped onto the chart as a floating gauge (movable and resizable).
Show / hide: Settings > Instruments > "Visible", or the "Show instruments" option in the Navigation Mode dialog. Your choice is remembered. Floating gauges dropped on the chart stay visible even when the bar is hidden.
The 14 instrument types
Each instrument is self-contained and can be present in several instances. The Numeric value, Needle gauge and Chart tiles let you choose the displayed data from some forty fields (SOG, COG, heading, TWS/TWA/TWD, AWS/AWA, VMG, current, depth, temperatures, pressure, route and performance data…).
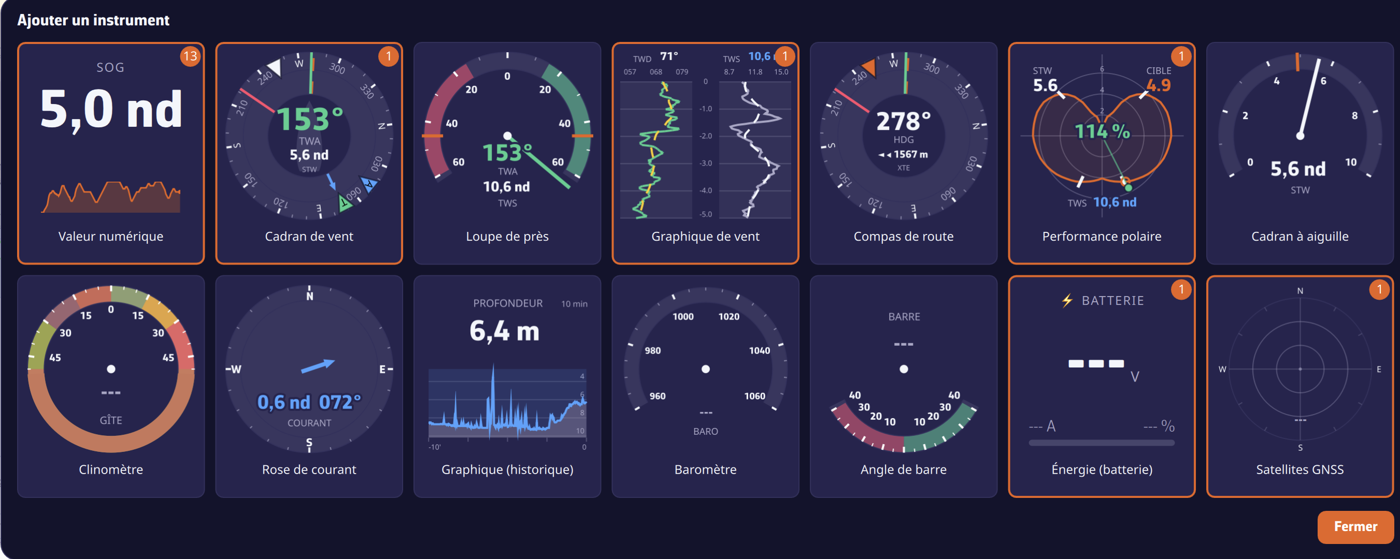
- Numeric value — digital tile: label, large number, unit, and an optional trend sparkline.
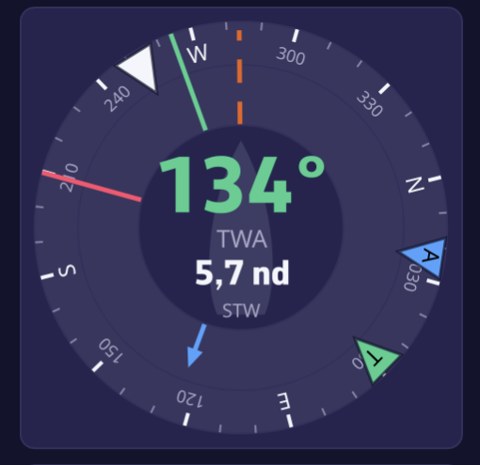
- Wind dial — composite B&G SailSteer-style dial: heading-up compass rose, central TWA (tap → AWA), STW speed (tap → SOG), wind arrows, laylines, current.
- Close-hauled magnifier — ±60° upwind magnifier: TWA needle coloured by tack, optimal upwind angles from the polars.
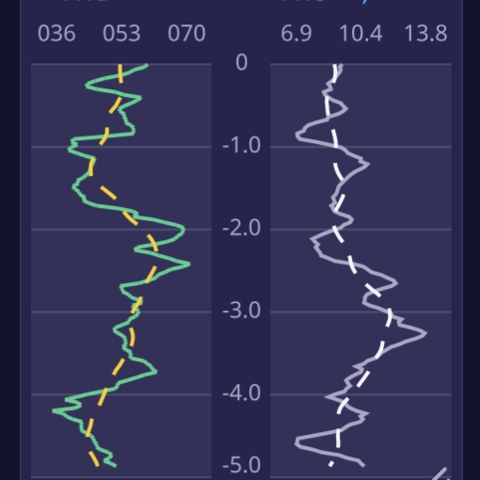
- Wind chart — scrolling histories of TWD and TWS, TWD coloured by tack plus a smoothed trend.
- Course compass — heading-up compass: HDG, COG, waypoint bearing, laylines and cross-track error (XTE) with a "which way to steer" arrow.
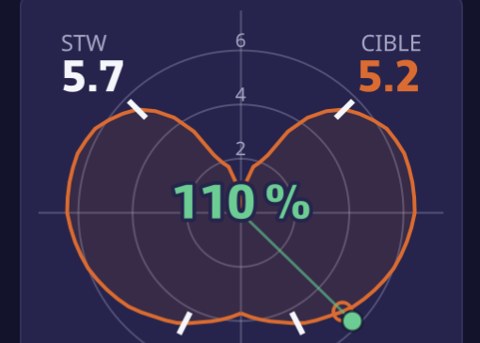
- Polar performance — NKE-style polar plot: curve for the current TWS, current point, target, VMG marks and performance % (requires a polar file).
- Needle gauge — 240° analog auto-scaling gauge on a speed (STW, SOG, TWS, VMG…).
- Clinometer — heel: ±50° arc with comfort / warning / excess zones.
- Current rose — current arrow (length ∝ speed) in its direction, with speed & direction in figures.
- Chart (history) — trend curve for any data (adjustable window, moving average, marker, colour); sounder rendering for depth.
- Barometer — aneroid barometer, needle on the NMEA pressure plus a 3 h trend.
- Rudder angle — ±40° indicator, port red / starboard green (NMEA RSA / XDR).
- Energy (battery) — battery bank: voltage, signed current, state of charge % (NMEA XDR).
- GNSS satellites — sky plot of the satellites by constellation (GPS/GLONASS/Galileo/BeiDou/QZSS), used/in view.
Adding an instrument
- The round "+" button at the bottom of the chart › menu › "Add an instrument";
- Right-click / long press on the chart: the grid opens in "drop at the clicked point" mode and places the chosen gauge there (floating).
The "Add an instrument" grid shows each type with a live preview fed by your boat's real data; a card already in use carries a badge showing how many instances are present (duplicates are allowed). From the "+" menu, a prompt asks where it should go: "Add to the bar" or "Add on the chart".
Configuring an instrument
Right-click (computer) or long press (touch) on an instrument opens its settings dialog, with a large live preview that updates instantly. Depending on the type you will find: Displayed data, Battery bank, Sparkline, Wind angle (TWA/AWA), Boat speed (STW/SOG), Time window (5 min → 3 h), Moving average, Marker, Curve colour, Square tile background, as well as Delete and Close.
Direct shortcuts (without opening the settings): tapping a chart's header cycles its time window; tapping the centre of a wind dial toggles TWA↔AWA (top) and STW↔SOG (bottom).
Reordering & moving
- Reorder: drag a tile along the bar — a ghost copy follows the cursor and an insertion slot opens. On touch, a long press first "lifts" the tile.
- Detach onto the chart: drag a tile across the bar → it becomes a floating gauge.
- Re-dock: drag a floating gauge onto the bar → release at the target slot.
- An alignment grid and blue guides appear while moving.
Resizing
- The bar: drag its inner edge (double-click / double-tap = automatic size); on touch, via the small handle on the border.
- A chart tile: handle at the bottom-right corner.
- A floating gauge: corner handle (mouse) or pinch (touch).
On touch, the bar and the layout are remembered separately in portrait and in landscape.
Preset layouts & orientation
Four built-in presets lay out a whole set of instruments in one go: GPS view, Cruising view, Upwind view, Downwind view. In the Settings you can Load a preset, Save the current configuration under a name, or Delete one. The Orientation setting (Auto / Horizontal / Vertical) determines whether the bar is a top strip or a side column.
To simply change which instruments of an existing preset are visible, see also "How do I change the instruments displayed?".