The NavimetriX interface has been designed to be clear, intuitive, and quick to use, whether on a computer, tablet, or smartphone. The chart fills the whole screen; here is a complete description, area by area:
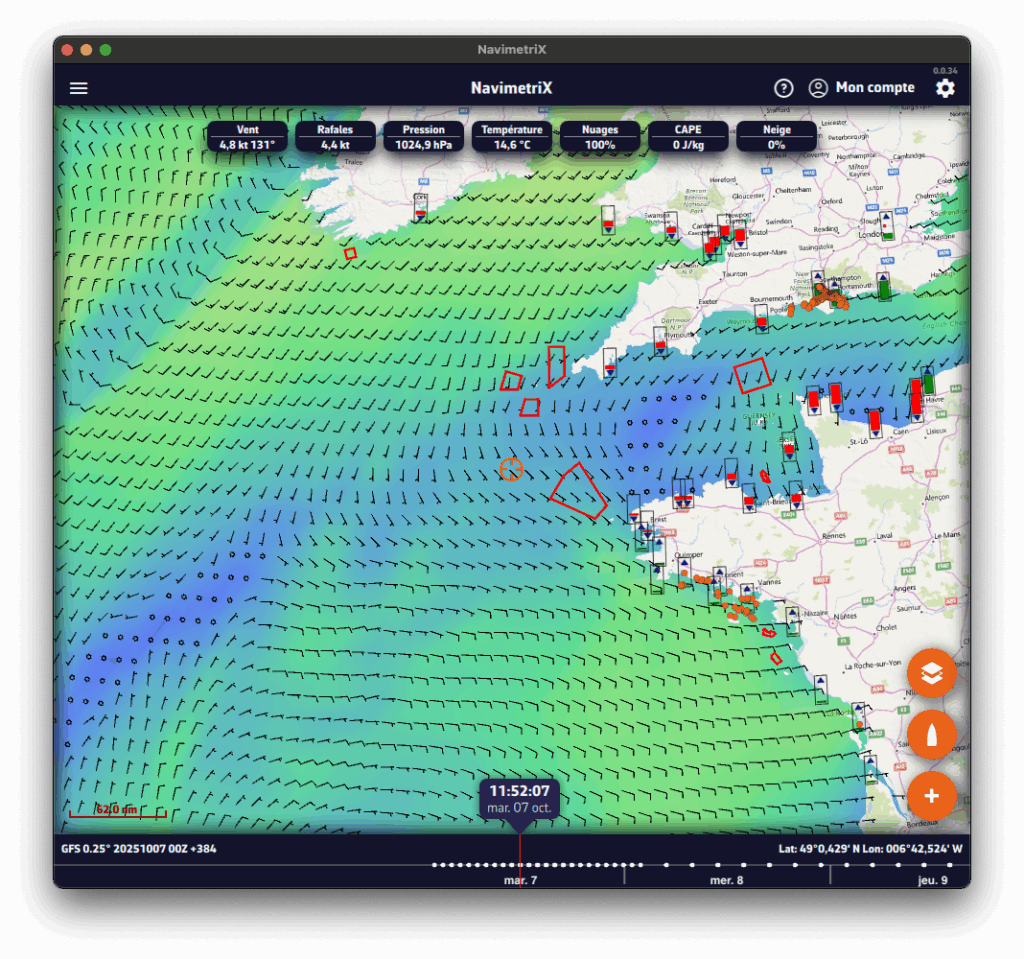
- Left edge: the tabs panel
A chevron handle, in the middle of the left edge of the screen, opens and closes the panel with the app's main lists. At the very top, the Navigation switch turns on Navigation mode (Premium subscription only). Below it, ten tabs:
- GRIBs files
- Weather Charts (isobars)
- Precipitation Radar
- POIs (points of interest)
- ZOIs (zones of interest: restricted, slow or information)
- Routes
- Routings
- Tracks and logbook
- AIS targets
- Race tracking
- Right edge: the settings drawer
A second chevron handle, in the middle of the right edge of the screen, opens and closes the Settings drawer. At the top of the drawer, on either side of the "Settings" title:

“?” icon (left): opens the app's website on the Frequently Asked Questions (FAQ).

Person icon (right): lets you log in to your NavimetriX account, create an account or reset your password. Once you are logged in, it offers "Logout" and "Delete Account".
- Top right of the chart

As long as you have not subscribed, the Cart button opens the Premium Subscription window. It disappears once you have subscribed.
- On the right (or at the top): the instruments
The instruments (speed, wind, heading…) are shown in a column along the right edge of the screen, or in a band at the top of the screen in portrait. Their display is set in Settings > Instruments: see How do I change the instruments displayed?
- Bottom left
- Chart scale
- "−" and "+" zoom buttons, if "Zoom buttons" is ticked in the Layers menu
- MOB (man overboard) button, in Navigation mode, if Settings > General > "MOB button" is on: see How to use the MOB (Man Overboard) function?
- At the bottom: the Timeline
- It appears as soon as there is dated data to browse: a GRIB file displayed, a visible routing, current atlases or the rain radar. On a phone held in landscape, it becomes a column on the side of the screen.
- You can:
- Drag the Timeline with your finger or the mouse,
- Click/tap a point on it to jump directly to a given time.
- The time shown in the bubble above the cursor is the current position of the Timeline. If you click/tap this time, the Timeline snaps to "now": the time turns orange and the seconds tick by.
- The data of the displayed GRIB file are then those of the selected time.
- If a routing is displayed, the boat moves along its track to the selected time.
- At the bottom right, the coordinates of the target are displayed.
See also: The timeline has disappeared: why, and what can I do?
- Bottom right: the round orange buttons

"+" button (at the bottom): opens the actions menu, depending on the context:
- Download GRIB, Load historical GRIB,
- Add POI,
- Create ZOI,
- Create route,
- Route to the target, Calculate Routing (or Routing from this point), C-MAP AutoRouting when a C-MAP chart is displayed,
- Drop anchor (anchor watch),
- Add a logbook entry (in Navigation mode),
- Add a new measure (distance),
- Add instrument.

Boat button
- Recentres the chart on the boat's position.
- Long press: recentres and zooms in automatically for a close-up view, ideal when navigating.
In Navigation mode, a Logbook button is added above it: it adds an entry to the logbook of the ongoing track.

Layers button (at the top of the stack): opens the Layers menu.
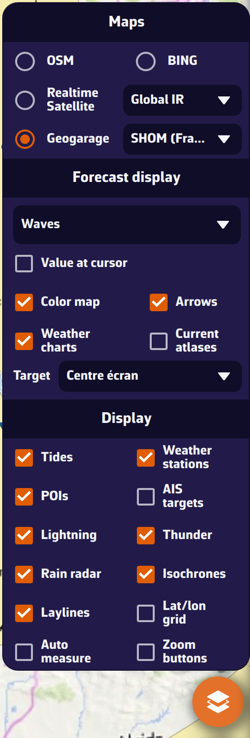
- Maps section: lets you choose the base chart:
- OSM OpenStreetMap (default)
- BING Satellite
- Realtime Satellite, with three sources: Global IR, High Res IR, NOAA IR
- Geogarage nautical charts, if your Geogarage account is connected
- C-MAP charts, with the Sat, Relief and HRB toggles (satellite and relief: REVEAL X charts only)
- Orientation line, at the end of the Maps section: North up, Course up (COG), Heading up (HDG), Waypoint up (BTW).
- Forecast display section: lets you choose the weather parameters to display, depending on the selected weather model:
- Value at cursor (PC/Mac pointer),
- Color map,
- Arrows (currents, swell…) or, for the wind, Particles or Barbs,
- Isobars,
- Weather charts,
- Current atlases,
- Target: Disabled, Screen center (default), GPS position, or one of the visible POIs (drop-down menu); see How do I adjust the target position?
- Display section: lets you show or hide:
- Tides
- Weather stations
- POIs
- AIS targets
- Lightning, Thunder
- Rain radar
- Isochrones
- Laylines
- Lat/lon grid
- Cursor measure, Auto measure
- Zoom buttons
- On the chart
- Target (in the centre of the screen by default):
- orange when it is over the sea,
- dark blue when it is over land.
The target's coordinates are displayed at the bottom right.
- The GRIB file data at the target, at the Timeline time, at the top of the screen.
- Tide icons all over the world:
- Red: falling tide.
- Green: rising tide (blue with the "Colorblind-friendly colors" setting).
Clicking an icon opens the tide details, with times and heights computed directly in the app.
- ZOIs: polygons, red by default, such as Traffic Separation Schemes or offshore wind farms.
- Points of Interest (POIs).