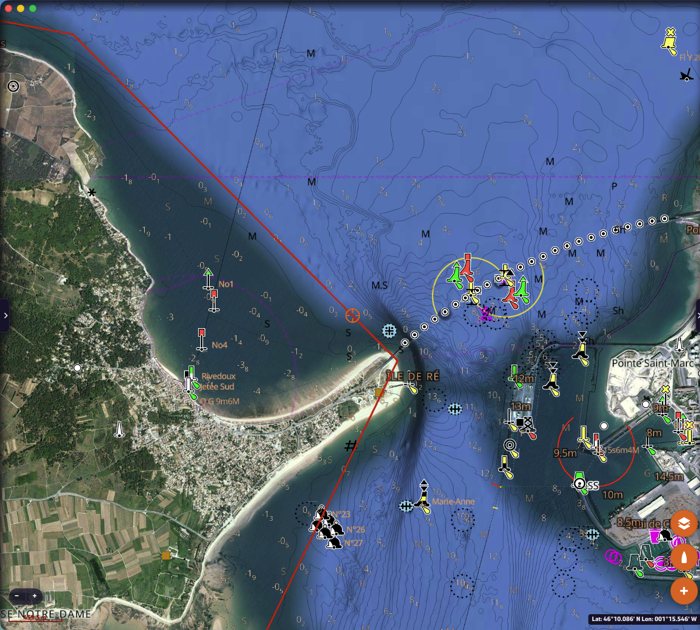
It explains every setting of the C-MAP charts: what it changes on the chart, and when it is useful at sea. The screenshots were taken off La Rochelle and the Île de Ré.
- The settings are in Settings → "C-MAP charts", under the "Account" button and "My Charts".
- They only change the C-MAP charts. The other layers of NavimetriX (weather, AIS, routes…) are not affected.
- When you are signed in to NavimetriX, your C-MAP settings follow you on your other devices.
- Each filter or alert shows its unit in its title, for example "(m)" or "(ft)": enter the values in that unit, the one chosen under "Units".
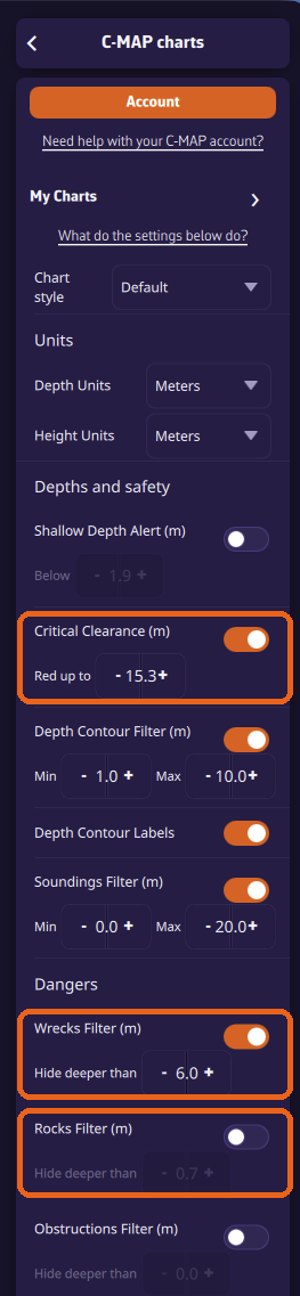
Chart style
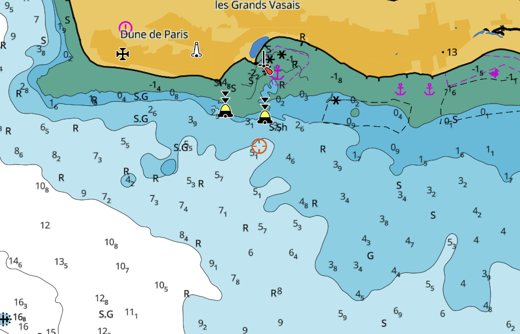
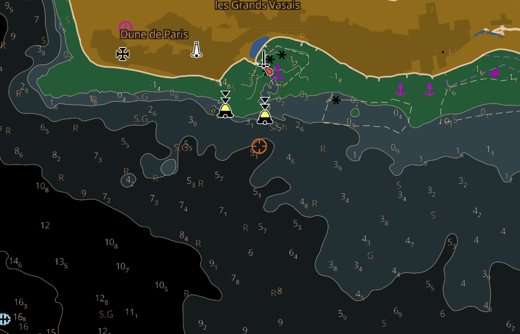
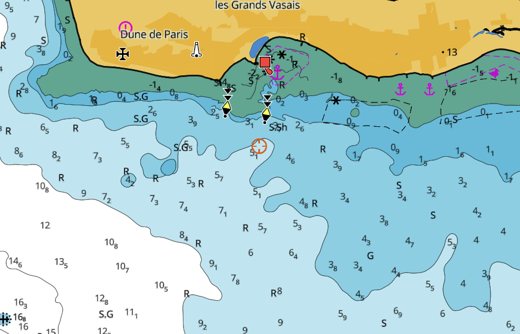
At the top of the page, "Chart style" changes the whole look of the chart:
- Default: the C-MAP day presentation.
- Night: dark colours, to keep your night vision in the cockpit.
- NOAA: the presentation of US charts (NOAA), familiar to sailors used to American charts.
- NOAA Night: the NOAA presentation in night colours.
Cartography type
At the bottom of the page, "Cartography type" chooses between:
- C-MAP cartography (default): the complete C-MAP charts, with all their content.
- ENC charts only: only the official electronic navigational charts (ENC) of the hydrographic offices, in their official colours, without the content added by C-MAP such as the high-resolution bathymetry and the shaded relief.
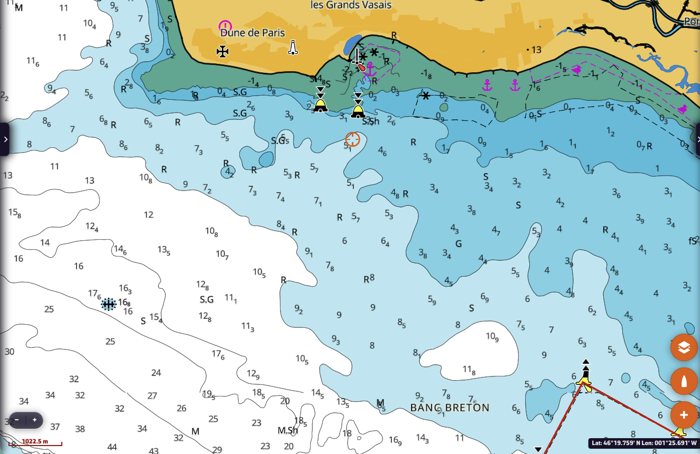
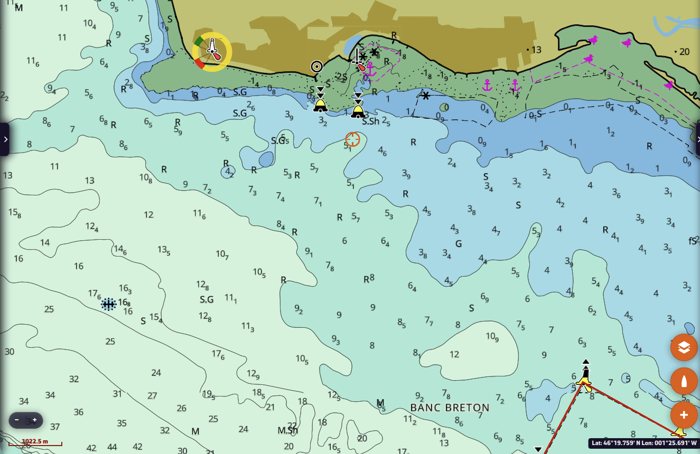
Quick settings in the Layers menu
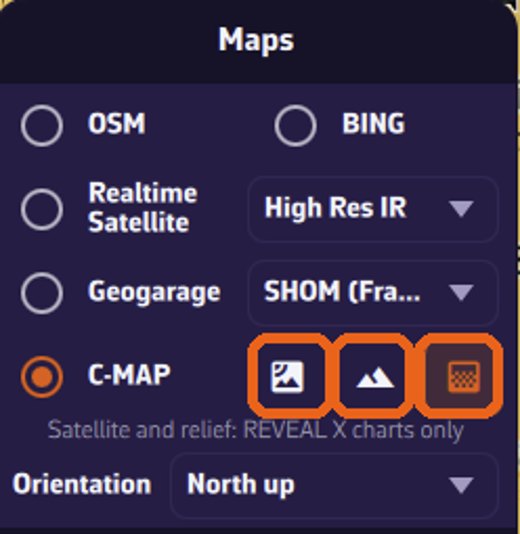
The three buttons to the right of "C-MAP", in the Maps section of the layers menu (the orange button at the bottom right of the map), switch the most used layers on and off without opening the settings. An orange button means the layer is on.
- Satellite (picture icon, REVEAL X): satellite imagery on land and sea, like "Satellite Imagery" set to "Enabled".
- Relief (mountain icon, REVEAL X): the shaded relief of the land and the seabed.
- High Resolution Bathymetry (grid icon): C-MAP's detailed depth contours.
Satellite and relief both shade the land, so switching one on switches the other off. High Resolution Bathymetry is independent. These buttons change the same settings as the C-MAP settings page, which shows their state.
With DISCOVER X charts only, the satellite and relief buttons are greyed out, and so are the REVEAL X rows of the C-MAP settings (seabed area, bottom hardness, vegetation, shaded relief, satellite). With both types of chart, everything stays active, but these layers only show over your REVEAL X charts: a note under "C-MAP" reminds you. An expired REVEAL X chart counts as no REVEAL X.
Units
- Depth units: metres, feet or fathoms. Used for the soundings and the depth contours on the chart, and for the depth values of the filters below.
- Height units: metres or feet. Used for the heights on the chart, such as the vertical clearance of bridges, and for the critical clearance.
Depths and safety
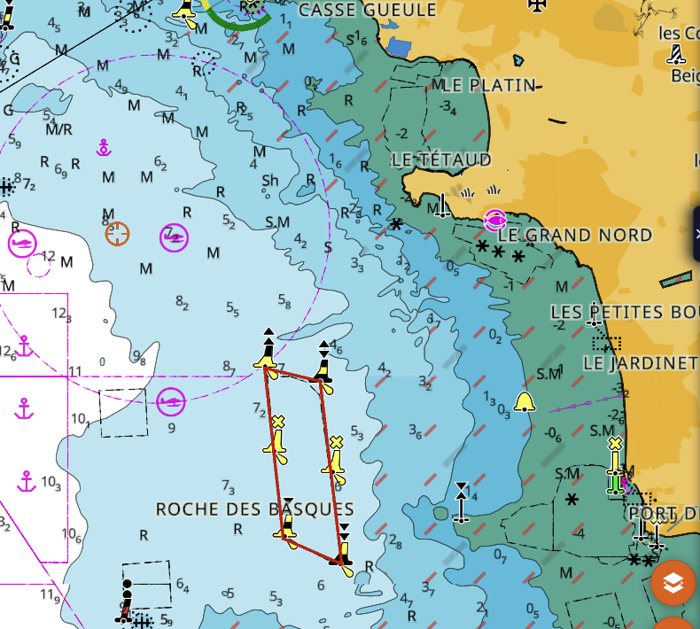
Shallow depth alert. Covers with red hatching the areas shallower than the value set in "Below". Switch it on and set "Below" to your draft plus a safety margin. In the example, the alert is set to 2.4 m.
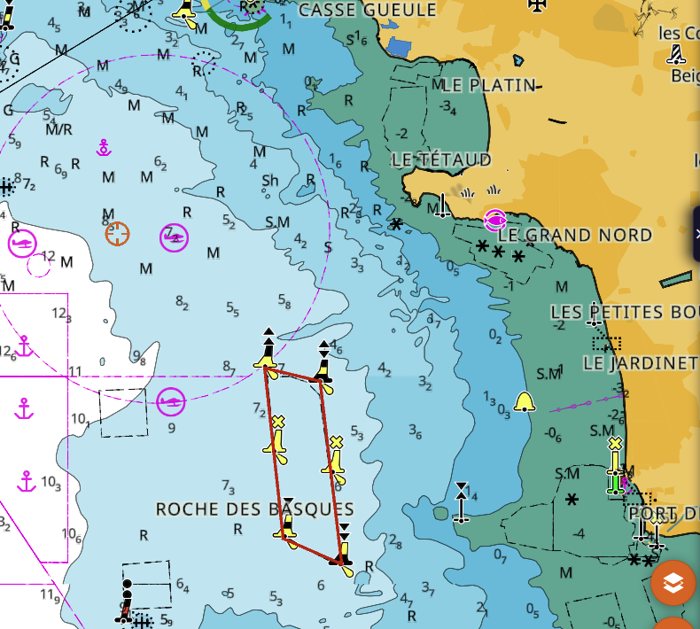
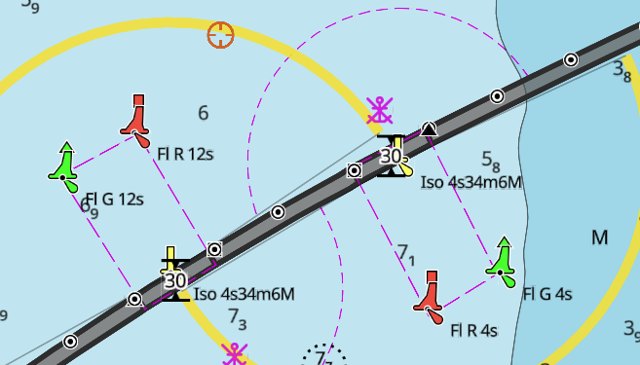
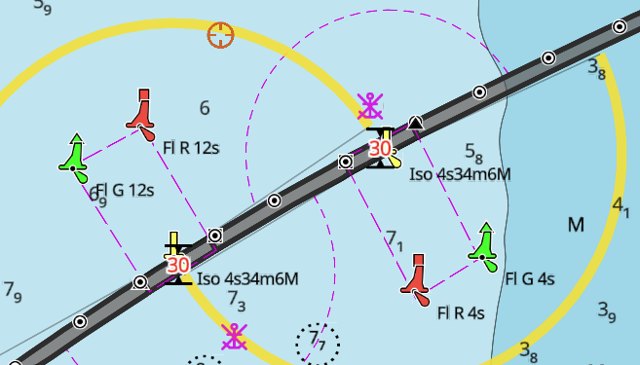
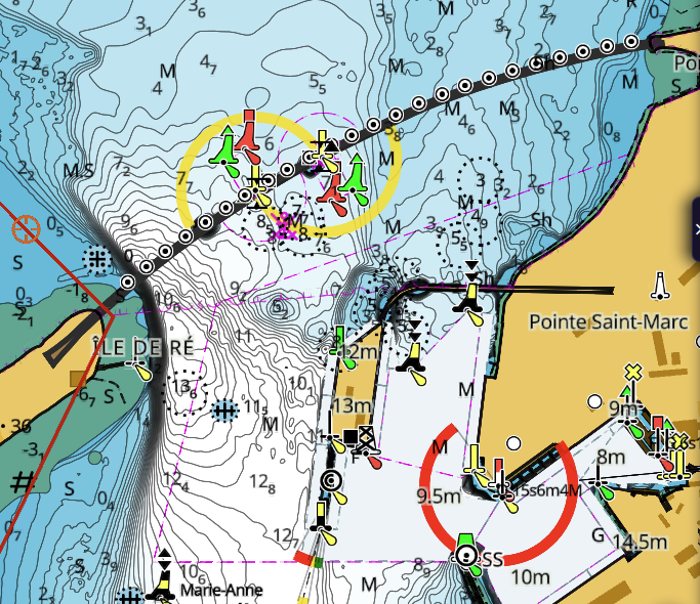
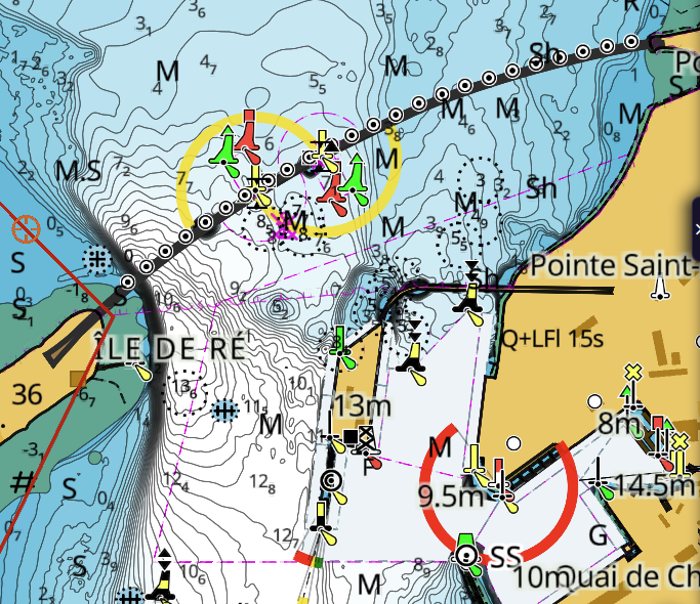
Critical clearance. Shows in red the vertical clearance of the bridges that are lower than or equal to the value set in "Red up to". Switch it on and set "Red up to" to your air draught (height of the masthead above the water, plus a margin). Only bridges whose clearance is known in the chart are concerned. The clearance is written next to the bridge, for example 30 m for the Île de Ré bridge, and only appears when you zoom in close. In the example, "Red up to" is set to 33.6 m: the clearance of the Île de Ré bridge, 30 m, turns red.
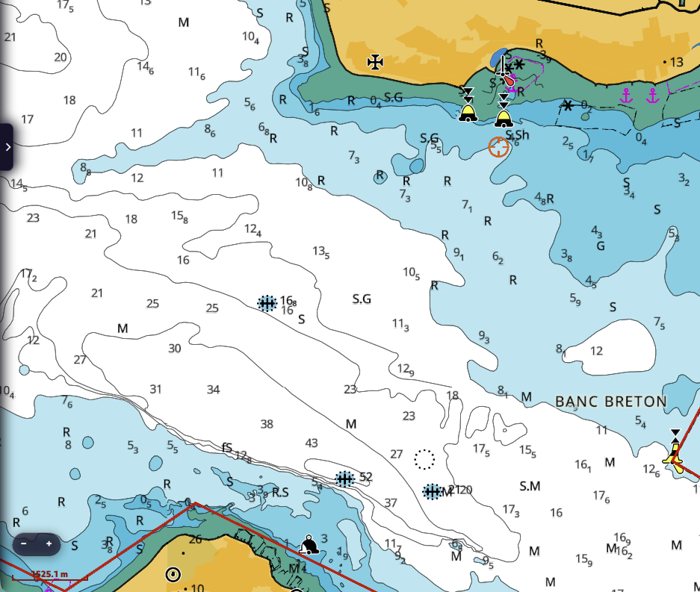
Depth contour filter. Shows only the depth contours between the "Min" and "Max" depths. Useful to keep only the contours that matter for your boat. In the example, from 2 m to 10 m: the deeper contours out at sea disappear.
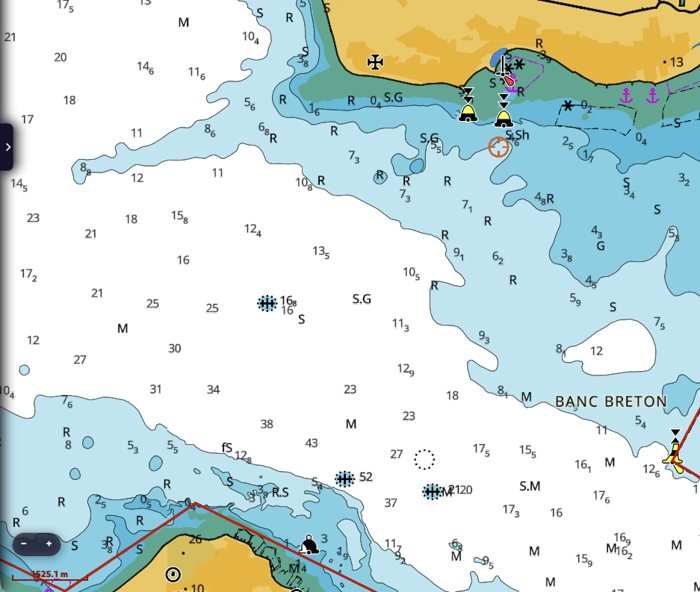
Depth contour labels. Writes the depth on the contour lines, so you can read the depth of a line without looking for the nearest sounding. The values appear when you zoom in close (scale bar of about 300 m or less).
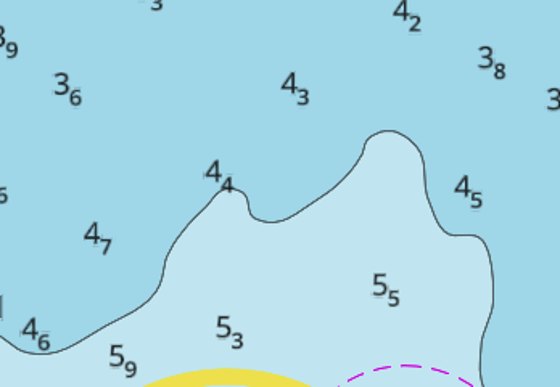
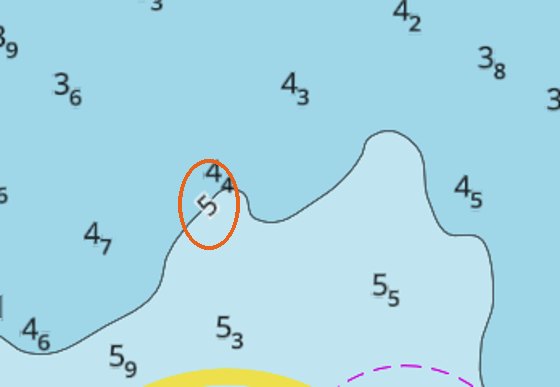
Soundings filter. Shows only the soundings between the "Min" and "Max" depths. Useful to lighten a busy chart. In the example, from 0 to 4.9 m: only the soundings near the coast remain.
Dangers
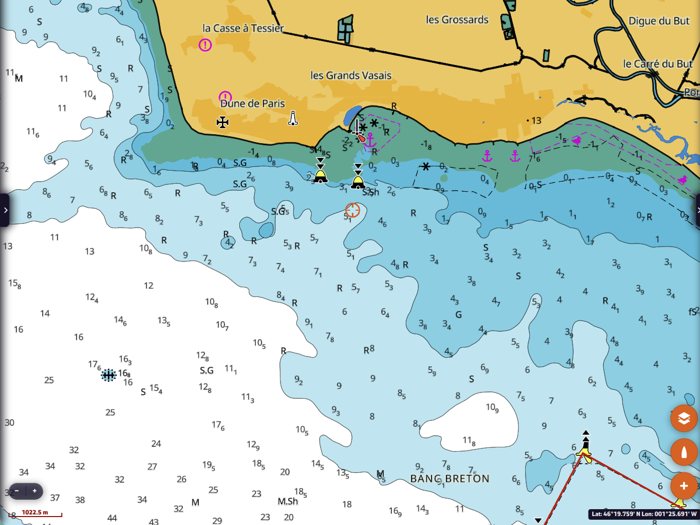
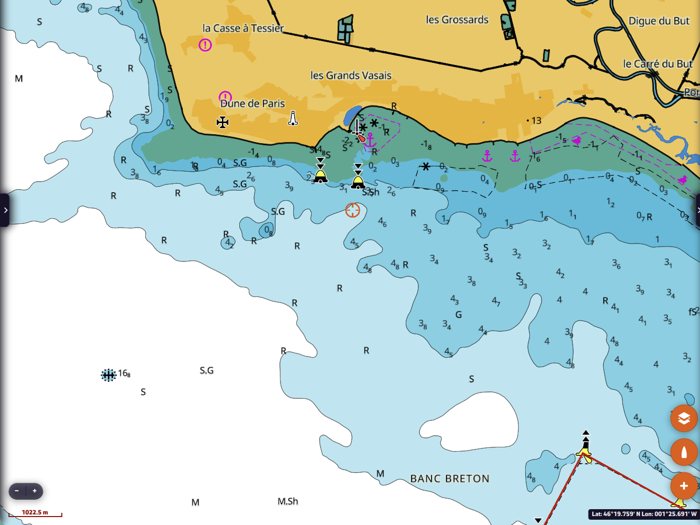
Wrecks filter, Rocks filter, Obstructions filter. Each filter hides the wrecks, rocks or obstructions deeper than the value set in "Hide deeper than". Dangers that uncover at low tide (negative sounding, for example a rock at -0.5 m, drying 0.5 m) are always shown. In the example, the wrecks filter hides wrecks deeper than 9.9 m: the wreck at 16.8 m, no danger to a sailing boat, disappears. The value cannot be negative. On most European charts, submerged rocks with a known depth are shown as soundings: the rocks filter then hides little, the wrecks filter declutters more.
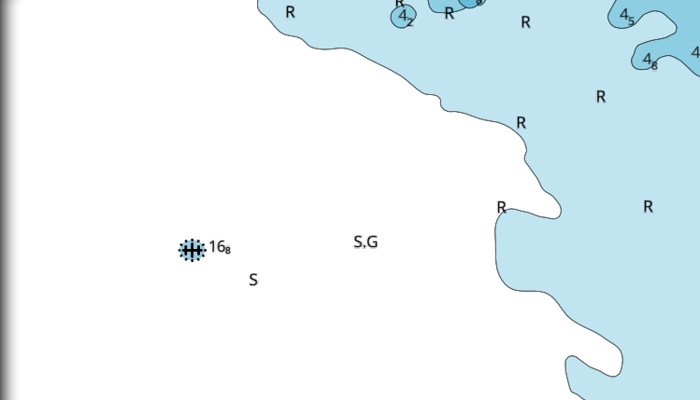
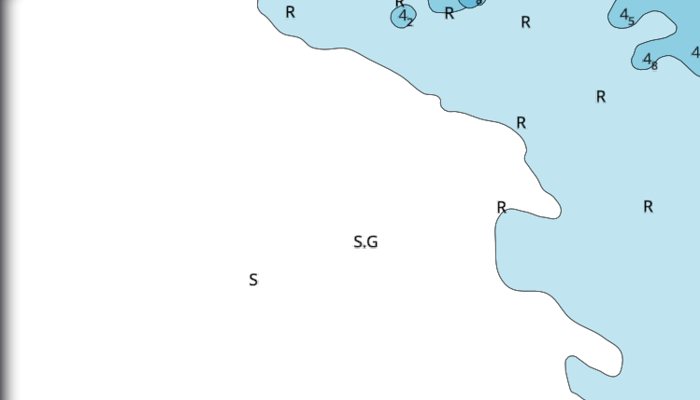
Important: a wreck, rock or obstruction without a known depth is never hidden by these filters. These filters make the chart easier to read, they do not make a danger disappear: always keep a margin.
Seabed
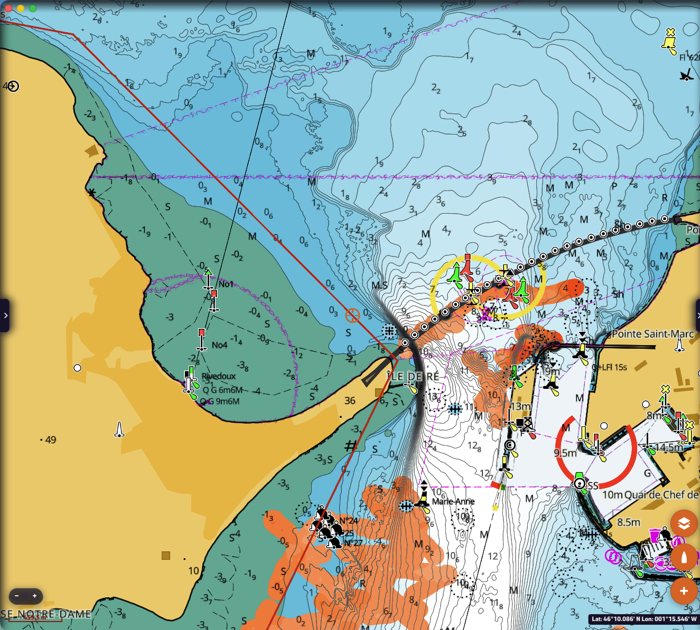
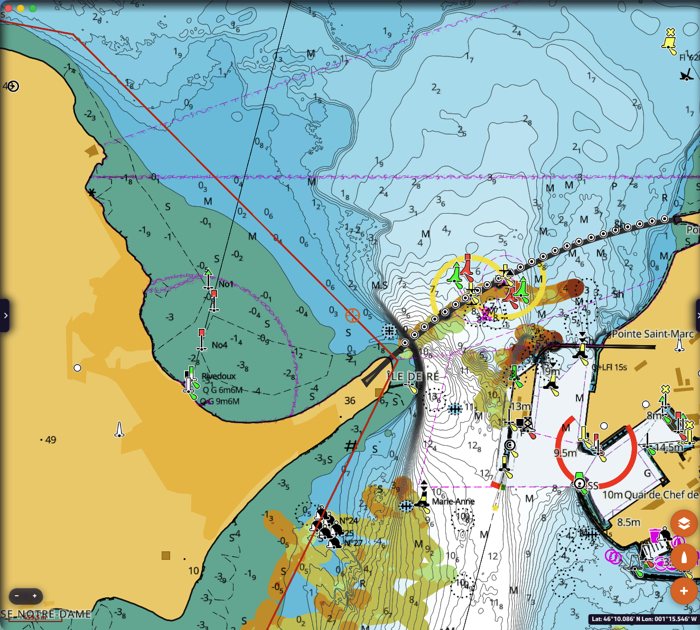
Seabed Area (REVEAL X). Colours the seabed according to its nature. The legend under the switch gives the colours: fine sediment, sand, coarse sediment, rocks and boulders, coral, shells, seagrass, mixed sediment. "Nature of seabed" shows either all the types or only the vegetation (seagrass). Useful to choose an anchorage: sand and mud hold well, seagrass and rocks much less.
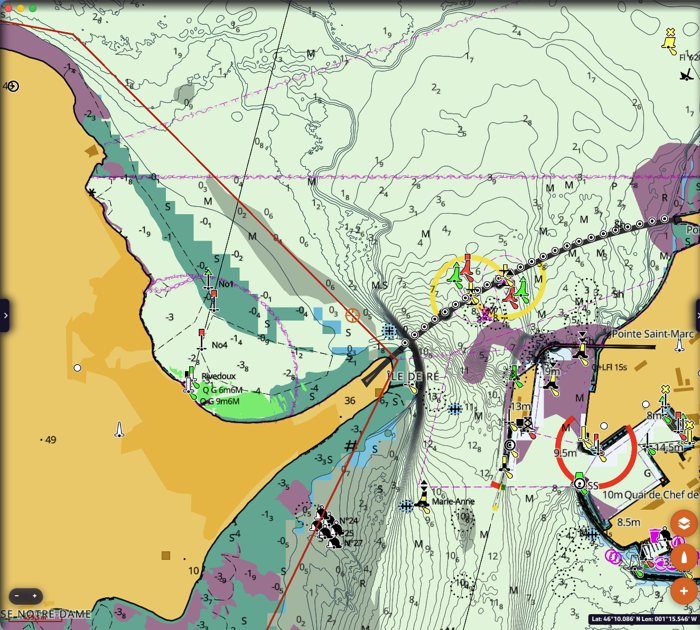
Social Bottom Hardness (REVEAL X). Colours the seabed according to its hardness, from C-MAP's Social Map data. "Smooth" and "High contrast" give two presentations of the same data.
Additional layers
High Resolution Bathymetry. Adds C-MAP's detailed depth contours, much closer together than on the official charts. Also available as a quick button in the layers menu (see above).
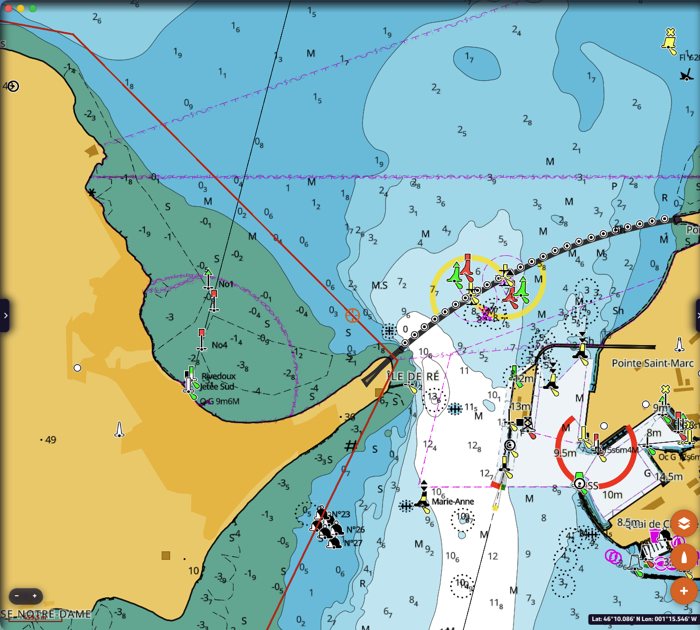
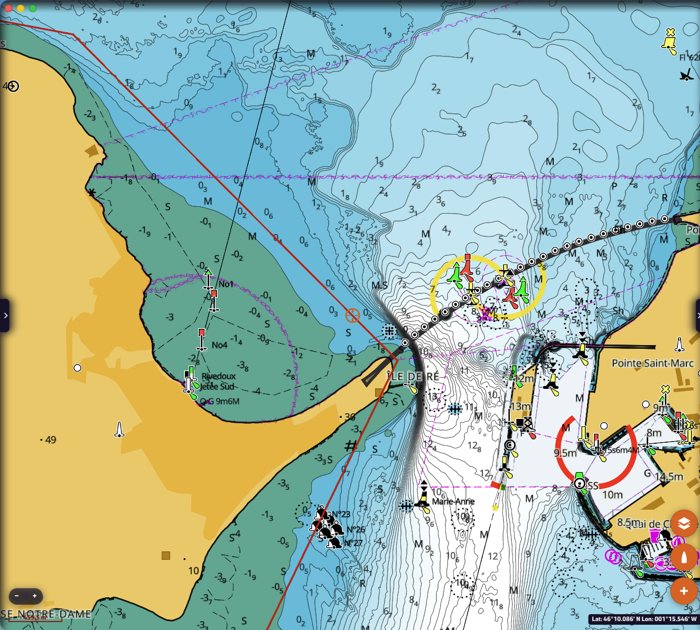
Social Map Bathymetry. Adds the depth data of C-MAP's Social Map, gathered from boats. It can only be switched on when High Resolution Bathymetry is on: otherwise the line is greyed out.
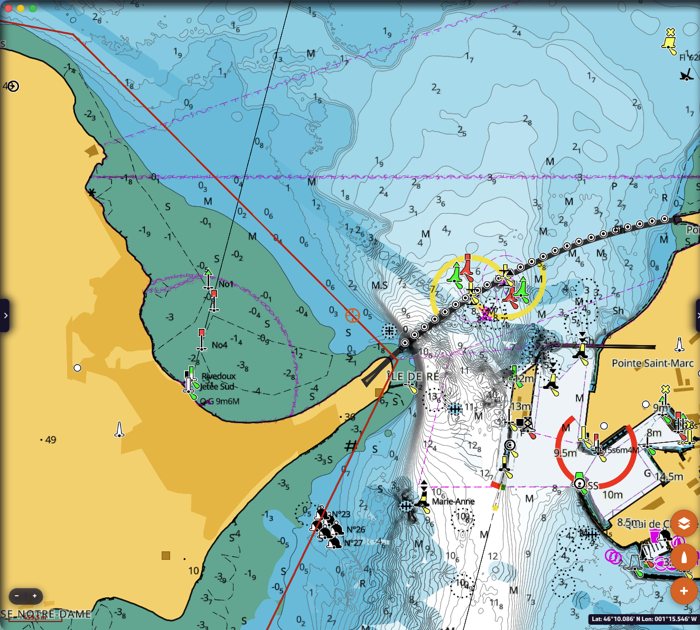
Social Vegetation (REVEAL X). Shows the underwater vegetation from C-MAP's Social Map data, in green.
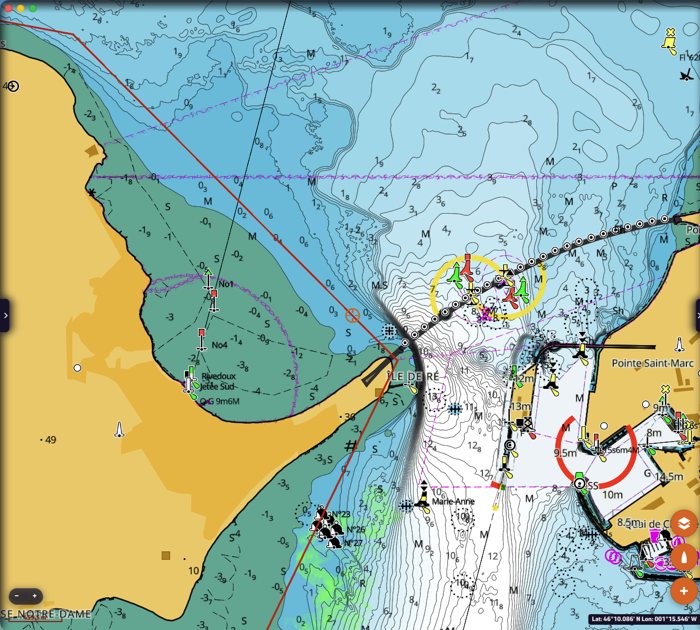
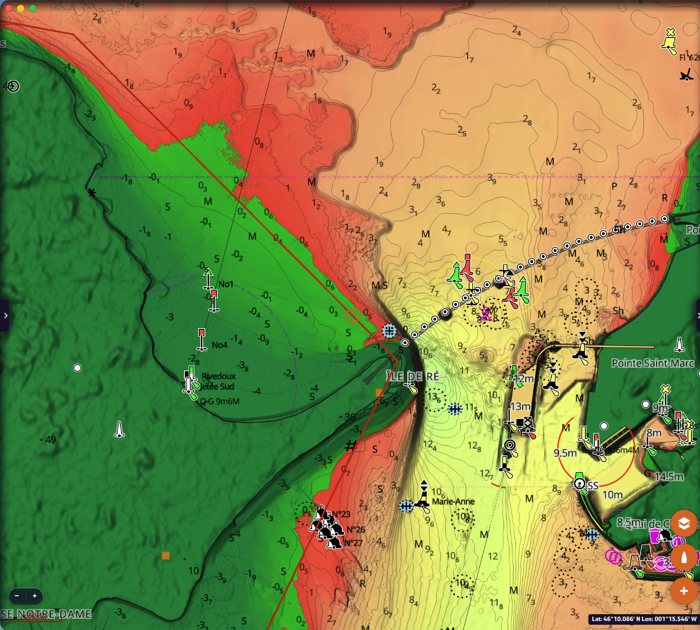
Shaded Relief (REVEAL X). Colours and shades the relief of the land and of the seabed. "Shaded Relief Opacity" sets its transparency, from 0 % (invisible) to 100 % (opaque).
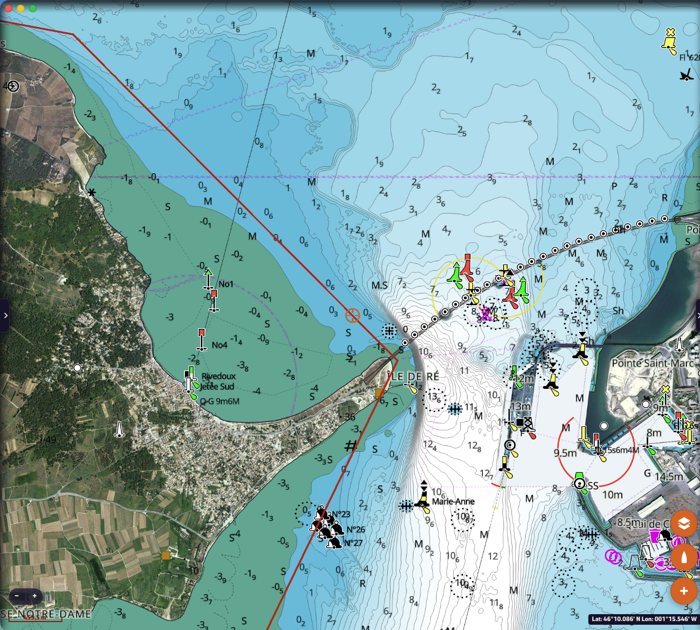
Satellite Imagery (REVEAL X). Shows satellite imagery: "Land only" on land only, "Enabled" on land and sea. "Satellite Opacity" sets its transparency, from 0 % to 100 %. In the layers menu, switching the satellite on switches the relief off, and the other way round.
Raster Charts appears greyed out: it is not available in NavimetriX today.
Display
Marine Protected Areas. Shows the marine protected areas. "MPA Display Selection" chooses which ones: only the no-access areas, the no-access and most restrictive areas, or all of them. This layer shows the marine protected areas of the United States, Canada, Australia and South Africa. In Europe, protected areas such as national parks (Port-Cros, for example) are shown as restricted areas, always visible on the chart, whatever this setting.
National Text. Shows the names and texts in the language of the country when the chart provides them, instead of the international (English) text.
Text Magnification and Symbol Magnification. Enlarge the texts and the symbols of the chart, for example on a small phone screen. They only affect the C-MAP chart.
Going back to the default presentation
Every setting can be changed back at any time from the same page. To go back to the default C-MAP presentation, switch the filters and alerts off, choose the "Default" chart style and "C-MAP cartography".
See also: C-MAP charts in NavimetriX, to buy, install and download your charts.