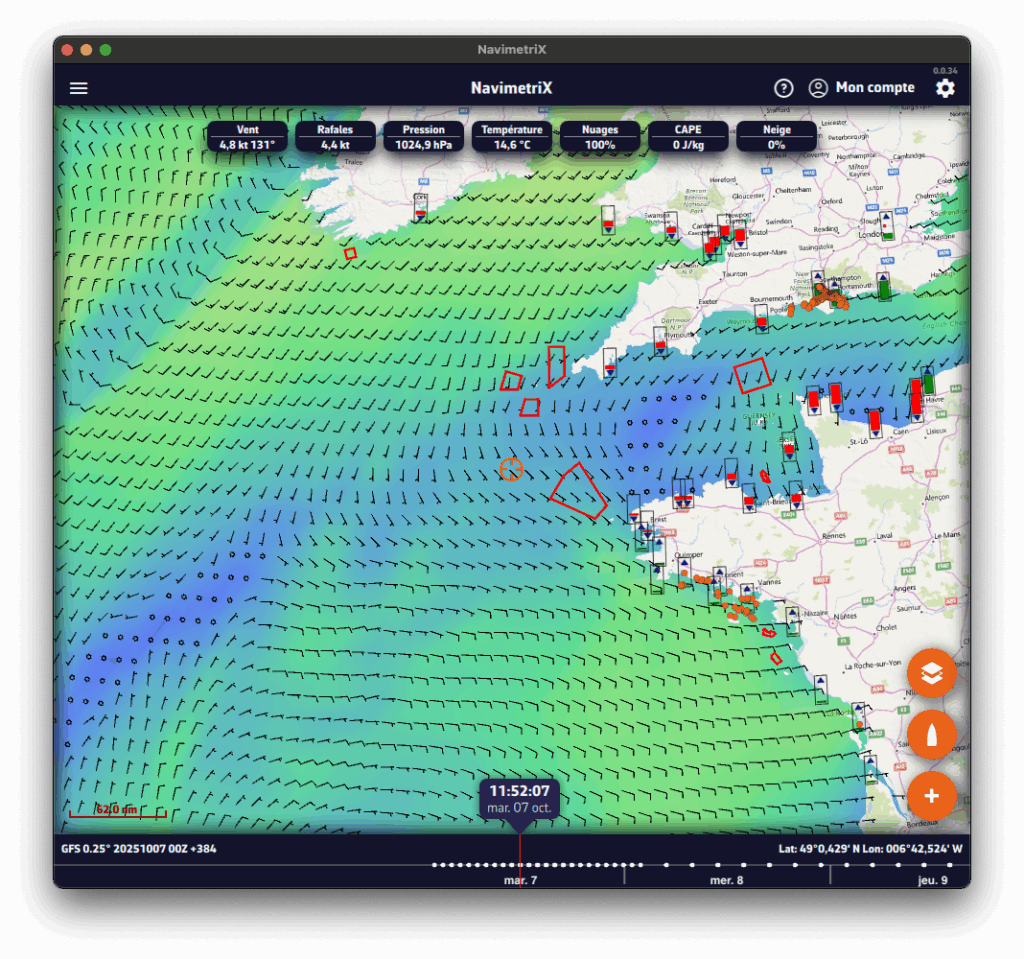
The NavimetriX interface has been designed to be clear, intuitive, and quick to use, whether on a computer, tablet, or smartphone. The chart fills the whole screen; here is a complete description, area by area:
- Left edge: the tabs panel
A chevron handle, in the middle of the left edge of the screen, opens and closes the panel with the app's main lists. At the very top, the Navigation switch turns on Navigation mode (Premium subscription only). Below it, ten tabs:
- GRIBs files
- Weather Charts (isobars)
- Precipitation Radar
- POIs (points of interest)
- ZOIs (zones of interest: restricted, slow or information)
- Routes
- Routings
- Tracks and logbook
- AIS targets
- Race tracking
- Right edge: the settings drawer
A second chevron handle, in the middle of the right edge of the screen, opens and closes the Settings drawer. At the top of the drawer, on either side of the "Settings" title:

“?” icon (left): opens the app's website on the Frequently Asked Questions (FAQ).

Person icon (right): lets you log in to your NavimetriX account, create an account or reset your password. Once you are logged in, it offers "Logout" and "Delete Account".
- Top right of the chart

As long as you have not subscribed, the Cart button opens the Premium Subscription window. It disappears once you have subscribed.
- On the right (or at the top): the instruments
The instruments (speed, wind, heading…) are shown in a column along the right edge of the screen, or in a band at the top of the screen in portrait. Their display is set in Settings > Instruments: see How do I change the instruments displayed?
- Bottom left
- Chart scale
- "−" and "+" zoom buttons, if "Zoom buttons" is ticked in the Layers menu
- MOB (man overboard) button, in Navigation mode, if Settings > General > "MOB button" is on: see How to use the MOB (Man Overboard) function?
- At the bottom: the Timeline
- It appears as soon as there is dated data to browse: a GRIB file displayed, a visible routing, current atlases or the rain radar. On a phone held in landscape, it becomes a column on the side of the screen.
- You can:
- Drag the Timeline with your finger or the mouse,
- Click/tap a point on it to jump directly to a given time.
- The time shown in the bubble above the cursor is the current position of the Timeline. If you click/tap this time, the Timeline snaps to "now": the time turns orange and the seconds tick by.
- The data of the displayed GRIB file are then those of the selected time.
- If a routing is displayed, the boat moves along its track to the selected time.
- At the bottom right, the coordinates of the target are displayed.
See also: The timeline has disappeared: why, and what can I do?
- Bottom right: the round orange buttons

"+" button (at the bottom): opens the actions menu, depending on the context:
- Download GRIB, Load historical GRIB,
- Add POI,
- Create ZOI,
- Create route,
- Route to the target, Calculate Routing (or Routing from this point), C-MAP AutoRouting when a C-MAP chart is displayed,
- Drop anchor (anchor watch),
- Add a logbook entry (in Navigation mode),
- Add a new measure (distance),
- Add instrument.

Boat button
- Recentres the chart on the boat's position.
- Long press: recentres and zooms in automatically for a close-up view, ideal when navigating.
In Navigation mode, a Logbook button is added above it: it adds an entry to the logbook of the ongoing track.

Layers button (at the top of the stack): opens the Layers menu.
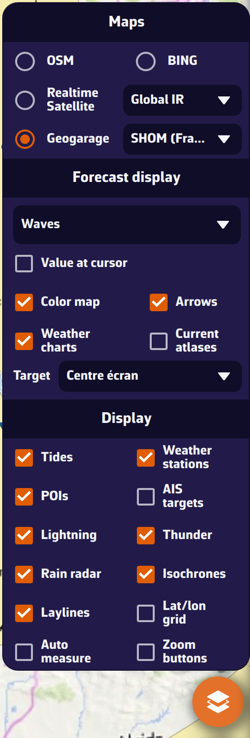
- Maps section: lets you choose the base chart:
- OSM OpenStreetMap (default)
- BING Satellite
- Realtime Satellite, with three sources: Global IR, High Res IR, NOAA IR
- Geogarage nautical charts, if your Geogarage account is connected
- C-MAP charts, with the Sat, Relief and HRB toggles (satellite and relief: REVEAL X charts only)
- Orientation line, at the end of the Maps section: North up, Course up (COG), Heading up (HDG), Waypoint up (BTW).
- Forecast display section: lets you choose the weather parameters to display, depending on the selected weather model:
- Value at cursor (PC/Mac pointer),
- Color map,
- Arrows (currents, swell…) or, for the wind, Particles or Barbs,
- Isobars,
- Weather charts,
- Current atlases,
- Target: Disabled, Screen center (default), GPS position, or one of the visible POIs (drop-down menu); see How do I adjust the target position?
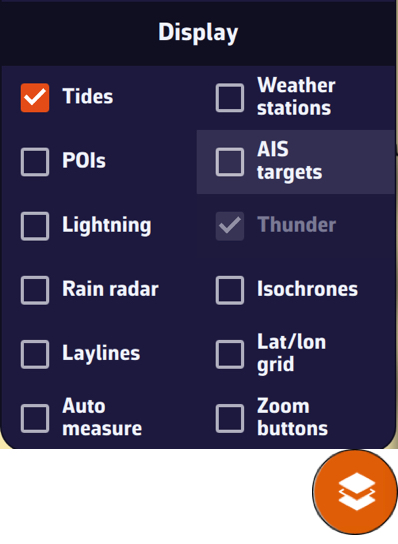
- Display section: lets you show or hide:
- Tides
- Weather stations
- POIs
- AIS targets
- Lightning, Thunder
- Rain radar
- Isochrones
- Laylines
- Lat/lon grid
- Cursor measure, Auto measure
- Zoom buttons
- On the chart
- Target (in the centre of the screen by default):
- orange when it is over the sea,
- dark blue when it is over land.
The target's coordinates are displayed at the bottom right.
- The GRIB file data at the target, at the Timeline time, at the top of the screen.
- Tide icons all over the world:
- Red: falling tide.
- Green: rising tide (blue with the "Colorblind-friendly colors" setting).
Clicking an icon opens the tide details, with times and heights computed directly in the app.
- ZOIs: polygons, red by default, such as Traffic Separation Schemes or offshore wind farms.
- Points of Interest (POIs).
You will find a short tutorial on the basic functions of NavimetriX by following Get Started.
To create a NavimetriX account, you must first take out the Premium subscription, on the device where you will then create the account.
The subscription is taken out in the app, through the App Store (iPhone, iPad, Mac) or the Google Play Store (Android). It is not possible to subscribe from a Windows PC, from Linux or from the browser version: see How do I subscribe on my Windows PC?
1. Take out the Premium subscription
Tap the round orange “Cart” button, at the top right of the chart, to open the Premium Subscription window. You can also open it from the settings drawer (handle on the right edge of the screen): Settings > Premium subscription.
If you open the Authentication window before subscribing, the Sign Up tab shows “Premium Required” and an “Upgrade to Premium” button that opens the same subscription window.
7-day free trial, first subscription only. The trial is granted only once: per Google account on Android, per Apple ID on iPhone, iPad and Mac. If you have already had a trial, you are charged as soon as you subscribe.
If this is your first subscription and you do not wish to continue beyond the 7-day trial, you will need to cancel the subscription before that deadline to avoid being charged.
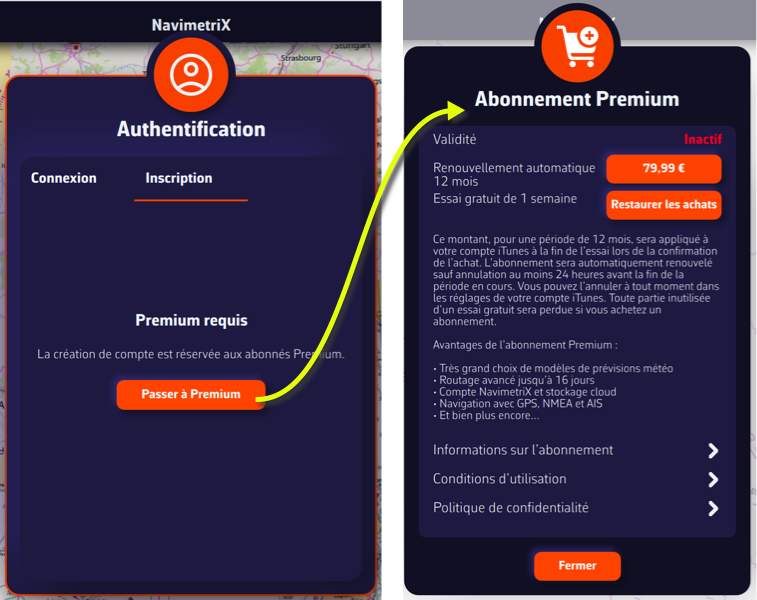
Once subscribed, the "Cart" button disappears from the screen.
2. Create your NavimetriX account
- Open the settings drawer with the handle on the right edge of the screen.
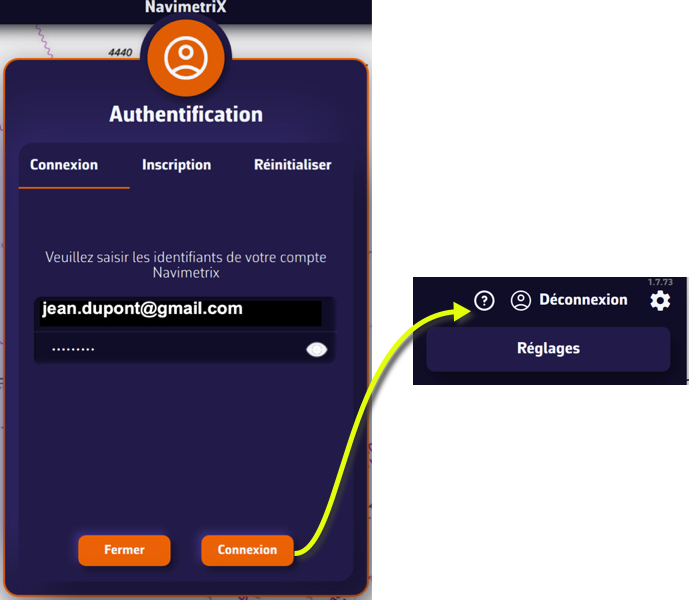
- Tap the person icon shown above, to the right of the "Settings" title. The Authentication window opens.
- Select the Sign Up tab.
- Enter an email address and a password, then confirm the password.
- Press the "Request Code" button.
- Enter the code received by email, then press the "Sign Up" button.
- Then go to the Log In tab.
- Enter your NavimetriX account email address and password, and press the "Log In" button.
Warning: you must create your account on the device you used to take out the Premium subscription. On any other device, the Sign Up tab shows "Premium Required".
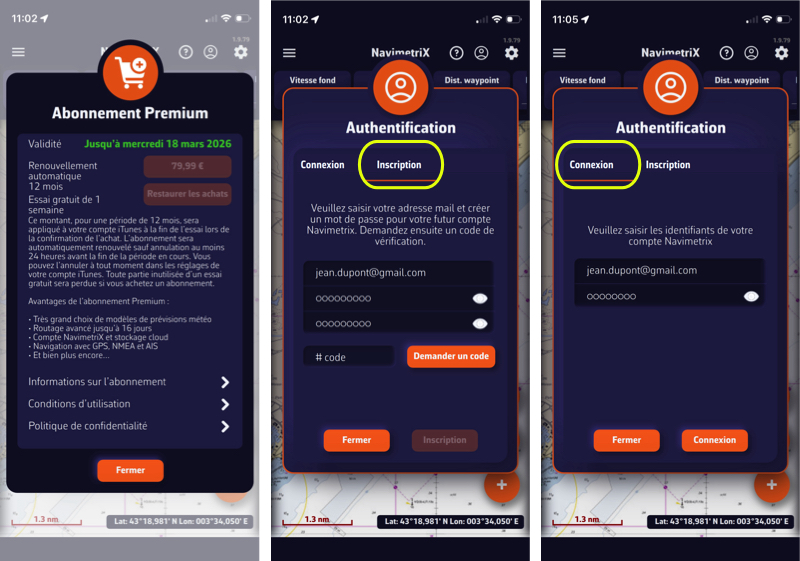
3. Once logged in
- The same person icon now opens a small menu: "Logout" and "Delete Account".
- Log in with the same account on your other devices (iPhone, iPad, Android, Mac, Windows PC, Linux): the Premium subscription is shared and your data is synchronised.
You can now enjoy all NavimetriX features.
Warning: during the free trial, if you wish to keep your subscription for a year, do not cancel it before the end of the 7 days.
Before writing to us, please check the FAQs: you’ll probably find the answer to your question 😉.
There’s no need to browse through all the FAQs one by one: you can search within the FAQs, so don’t hesitate to use the search bar!
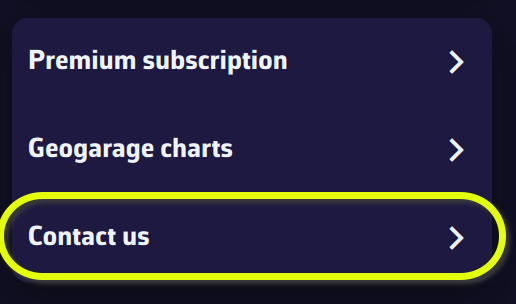
- If you are using the app, please use Settings > “Contact us” (settings drawer, handle on the right edge of the screen):
- on a computer, first choose the Method: Mail or Gmail;
- press the “Send a mail to support” button;
- in the “Contact support” window, describe the problem (what you were doing, what you expected), then press “Send”;
- the application log (“log” file) is sent to us and a reference number is displayed; it is included in the email that opens next, along with some technical data.
- Otherwise, please use the contact form on this website.
Without an Internet connection, or if sending the log fails, the log file is attached to the email instead. If it is not attached, you can add it yourself; it can be found here:
- Windows:
C:\Users\[your username]\AppData\Local\Soft4Sail\NavimetriX\logs\navimetrix.log
- macOS:
~/Library/Containers/navimetrix.soft4sail.com/Data/Library/Application Support/Soft4Sail/NavimetriX/logs/navimetrix.log
(in the Finder, the navimetrix.soft4sail.com folder is shown as “NavimetriX”; open the Library folder with Go > Go to Folder…)
- Linux:
~/.local/share/Soft4Sail/NavimetriX/logs/navimetrix.log
How to synchronise?
In order for NavimetriX to be synchronised across two or more devices, you must:
- Have subscribed to the Premium option and created a NavimetriX account
- Have devices connected to the Internet (Wi-Fi, cellular or satellite).
- Be logged into the same NavimetriX account on all devices
Which items are synchronised and which are not?
Most settings are synchronised, with a few exceptions, namely:
Synchronised
- All application settings, except those specific to each device:
- The Theme (Light, Dark, Night)
- In Settings > General: Language, Starry sky, Display scale, Font (Windows), Timeline scale and Energy saving
- The Instruments configuration (which must be fitted to screen sizes)
- In GPS & NMEA: the NMEA connections, GPS source, AIS source, Speed reference, True wind, the device pressure sensor, relays on the local network, NMEA Outputs and Remote cockpit
- In Settings > Alarms: the voice that reads the alarms (Enable Voice, Voice)
- With no exception
- POIs, ZOIs, routes, routings, routing tables, statistics, AI briefing, input data
- The tracks of your navigations and the logbook: they are sent to your account as soon as the device has Internet access, then appear in the Tracks tab of the other devices
- Screen display of charts, GRIBs, POIs, tides, AIS targets, routing isochrones
Partially synchronised
- GRIBs files

Downloaded GRIB files appear in the GRIB list on all devices. When a GRIB is downloaded or updated on a device, it is followed by a dimmed refresh icon. If a new run is available for that GRIB, this icon is activated.
On other device(s), the list of downloaded GRIBs is displayed, but the GRIBs that are not on the device are marked "Missing" and followed by an activated download icon. The contents of the GRIBs must then be downloaded manually.
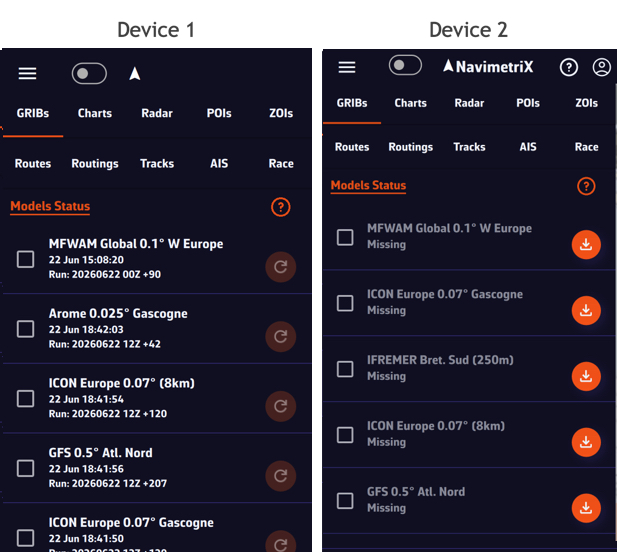
Once the GRIBs are identical on all devices, the download icon is replaced by the refresh icon.
- Geogarage charts
The Geogarage account is synchronised across all devices.
Geogarage charting is not synchronised: charts must be downloaded to each device.
- C-MAP charts
C-MAP charts are not synchronised: each device registers with your C-MAP account (Settings > C-MAP charts > "Register this device") and downloads its own areas.
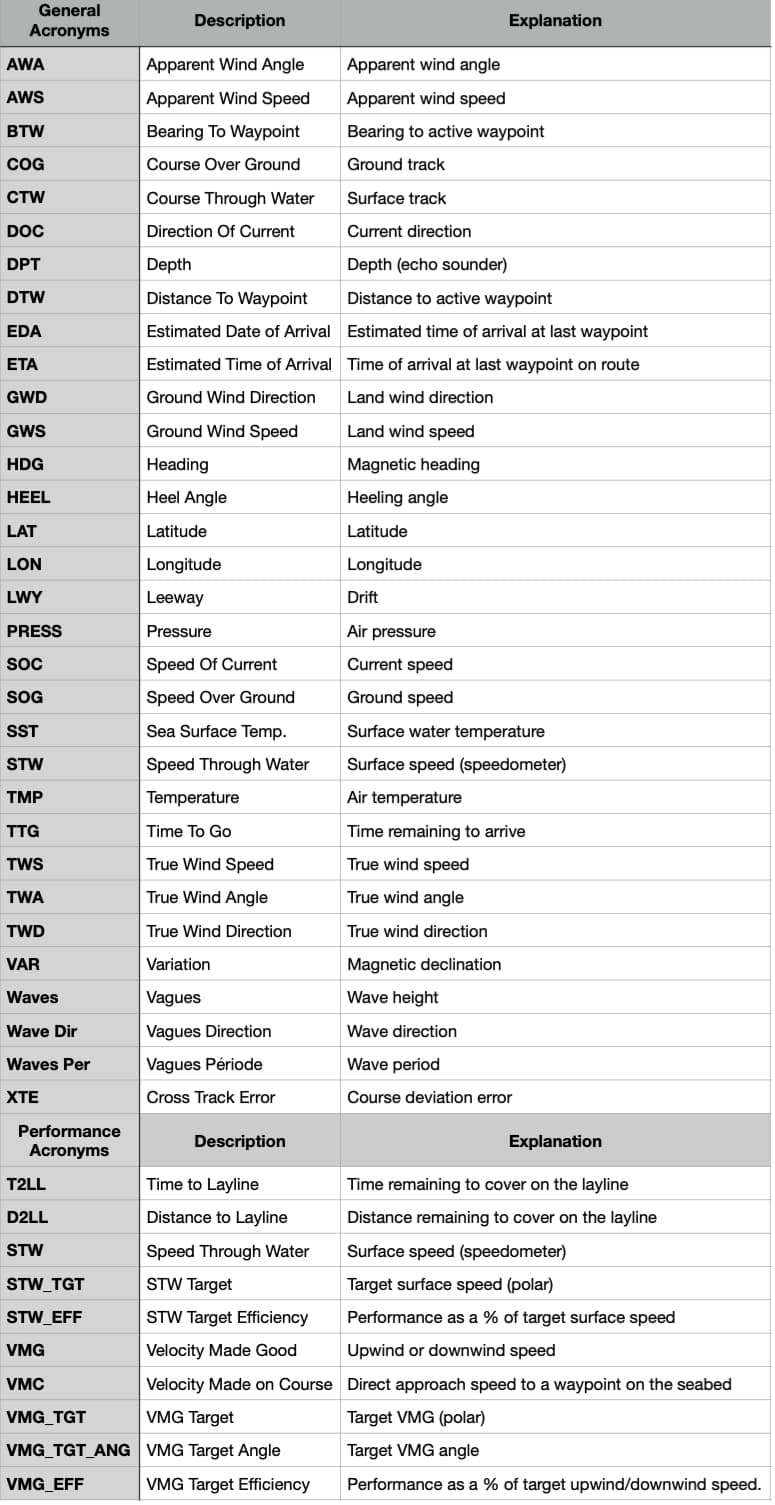
📘 This glossary brings together the main terms used in the NavimetriX application and its FAQs. It helps users better understand concepts related to navigation, routing, and marine weather. A comprehensive table is presented at the bottom of this page.
Course Over Ground (COG)
The actual direction of the boat’s movement over the seabed, expressed in degrees relative to true north. It differs from the compass heading when there is drift caused by wind or current.
Speed Over Ground (SOG)
The boat’s actual speed relative to the ground (not the water). Calculated by GPS, it includes the effect of currents.
Heading (HDG)
The direction in which the boat’s bow is pointing, measured relative to true or magnetic north.
True Wind Angle (TWA)
The angle between the boat’s axis and the true wind direction. It is calculated from the apparent wind and the boat’s speed.
True Wind Speed (TWS)
The wind speed derived from the apparent wind and the boat’s speed. It represents the actual wind strength on the sea surface.
Apparent Wind Angle (AWA)
The wind angle felt on board, influenced by the boat’s motion. Measured relative to the boat’s centerline.
Apparent Wind Speed (AWS)
The wind speed felt on the boat, resulting from the combination of the true wind and the boat’s speed.
Velocity Made Good (VMG)
The useful component of the boat’s speed, indicating the effective progress toward the destination or upwind.
Closest Point of Approach (CPA)
The point at which two vessels will be at their minimum distance from each other, based on their current courses and speeds.
Time to CPA (TCPA)
The time remaining before reaching the CPA, used for collision avoidance and AIS alarms.
Bearing
The angle between north and the direction of an observed object from the boat. Used to determine the relative position of a target or coastline.
Depth
The water depth below the keel, measured by an echo sounder. A key parameter for safe navigation.
Waypoint (POI / Waypoint)
A geographic point used to define a route or a key position. In NavimetriX, POIs represent these waypoints.
GRIB File (Gridded Binary)
A standard file format containing numerical weather forecasts (wind, waves, pressure, temperature, etc.).
Isochrone
A curve connecting all possible boat positions at a given time according to the predicted weather conditions.
Routing
The calculation of an optimal route considering wind, waves, currents, and the boat’s performance.
Polar
A performance curve showing the boat’s speed as a function of wind angle and wind strength. It forms the basis for the routing engine.
Estimated Time of Arrival (ETA)
The predicted time of arrival at the destination, calculated from the remaining distance and the average speed.
Sea State
A description of the waves and swell (height, direction, period). Used to assess routing comfort and safety.
Swell
A regular train of waves formed by distant winds. It differs from the wind sea, which is generated locally.
Significant Wave Height
The average height of the highest one-third of waves, the main indicator of overall sea conditions.
Currents
Water movements caused by tides or ocean circulation. They affect the boat’s speed and trajectory.
Tide
Variation in sea level caused by the gravitational attraction of the Moon and the Sun. It influences depth and coastal currents.
Complete acronym table
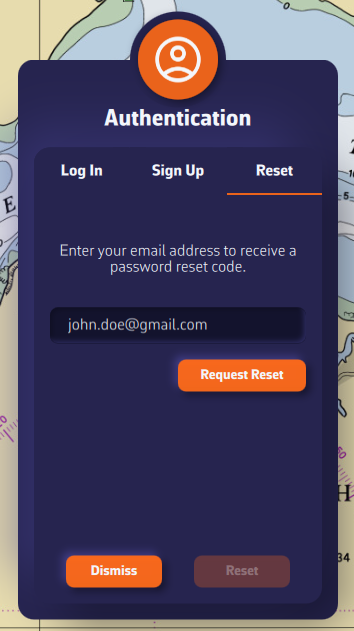
Resetting your password works from any device: all you need is a NavimetriX account.
- Open the settings drawer (handle on the right edge of the screen) and tap the person icon to the right of the “Settings” title. The Authentication window opens.
- In the Log In tab, tap the “Forgot password?” link below the password.
- The Password Reset tab appears. Enter the email address of your NavimetriX account and press Request Reset.
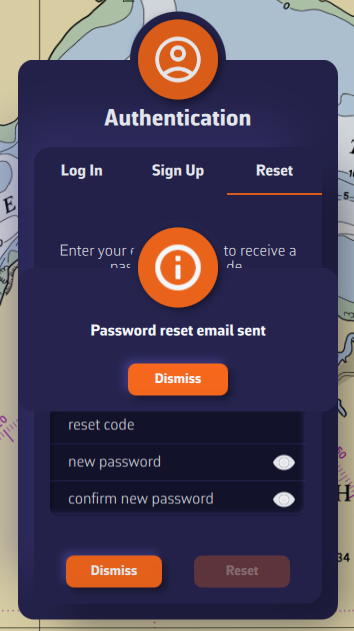
- A message says: “If an account exists for this email, you will receive instructions to reset your password.” Press Dismiss.
- Enter the reset code received by email, then the new password and its confirmation.
- Press the Reset button.
- After the confirmation message, the window returns to the Log In tab with your email address already filled in: enter the new password and press Log In.
NavimetriX improves with every version. We do not publish a schedule for upcoming features: this page lists what has been delivered since late 2025.
Q4 2025
- Distance measurement
- Zone editing (restricted, slow, info)
- Isobar and meteogram redesign
- Display of all weather parameters
- Route plan
- Data along the routing
- Meteogram in grid format
- Alarms
- Laylines display
- “In situ” data
- Autopilot interface
- NKE interface
- “Navigation” demo mode
Q1 2026
- Linux
- Multi-GRIB routings
- Route tracking
- Race tracking
- AIS over Internet
- NMEA data over USB
- Import of third-party GRIB files
- SHOM current atlases
- Automatic routing playback (Play button)
- Timeline extension
Q2 2026
- Satellite images
- Isobaric charts
- Rain radar
- Real-time storm tracking
- “In situ” stations
- Ensemble routing
- Advanced track management
Q3 / Q4 2026
- Synchronised anchor watch
- Anchor watch SMS alert
- Assisted GRIB download (Magic wand)
- Analog instruments (dials)
- Full screen mode on computers (Ctrl+Cmd+F on Mac, F11 on Windows and Linux)
- C-MAP DISCOVER X and REVEAL X charts, including official ENC charts (except in the browser version)
- Polar editor
- Sailchart editor (which sail to carry according to wind and point of sail)
- Logbook
- Sharing a navigation by link, live or afterwards
Follow what is new
The details of each version are in the app, Settings > About > “View version history”, and on the blog.
Missing a feature?
Let us know from the app (Settings > Contact us) or through the contact form. See How can we get in touch with you?
Despite NavimetriX's constant focus on optimisation, the wide variety of devices that can be used makes it impossible to guarantee optimal performance in every case. The prerequisites stated in the FAQ (1) are sometimes not enough, as technical specifications can be limiting on certain device ranges. It is therefore advisable to take precautionary measures to minimise the malfunctions that may be encountered.
Unexpected closure on launch or during use
Saved routings are reloaded at every start-up and stored on our servers for synchronisation. Ensemble routings are particularly heavy. If the application closes right after opening, start by deleting outdated routings.
Only keep routings currently in use. A routing is only valid for the lifetime of the weather models it uses. Once it has expired, there is no need to keep it. If necessary, you can export it, or turn it into a route with “Convert to route”.
RAM saturation can also cause unexpected closures during use, when launching a resource-intensive function: end of a long routing with an "Isochrone duration" that is too short, or an ensemble routing.
Degraded display
Sluggishness during screen interactions (zoom +/- functions, scrolling), or the appearance of black areas (partial or total loss of chart display) are often caused by RAM saturation on poorly equipped devices. Make sure to close and quit unused applications to free up RAM.
Also, to improve smoothness, the heaviest layers to disable in the Layers menu are “AIS targets” and “Weather stations”. For the track, switch the ongoing track to “Short” (last 20 minutes): Tracks tab, ⋮ button of the “Ongoing” row > Display > Live track extent. Also hide saved tracks (eye checkbox) in the Tracks tab. Displaying GRIBs as particles is also graphics-intensive and drains the battery. Prefer arrow or barb display while navigating.
Finally, Settings > General > Energy saving slows down the refresh rate of the instruments, the internal GPS and the alarms, and turns off the animated wind and current particles.
(1) See also: What are the minimum operating system versions?
💻 Computers:
- macOS: version 13 (macOS Ventura, released in October 2022) and all later versions. The app runs on both Intel Macs and Apple silicon Macs (M1 and later).
- Windows: Windows 10 version 1809 (build 10.0.17763, released in October 2018) or later, and Windows 11. 64-bit (x64) version.
- Linux: 64-bit AppImage, in two versions available from our website: x86_64 for PCs, aarch64 for 64-bit ARM computers.
📱 Phones and tablets:
- Android: version 9 (API 28, released in August 2018) and all later versions. The app requires a device with a 64-bit ARM processor (arm64-v8a), which covers almost all recent phones and tablets. Older 32-bit devices and devices with an x86 processor are not supported.
- iOS and iPadOS: version 16 (released in September 2022) and all later versions, on iPhone and iPad.
🌐 Web browser:
- NavimetriX also opens in a web browser at nav.navimetrix.com, with nothing to install. This version does not display C-MAP charts and does not connect directly to the boat's instruments (NMEA).
⚠️ Important:
These operating system versions are prerequisites for running NavimetriX, as they define compatibility with our development framework.
However, they do not guarantee that the application will be fully compatible with your device. Other factors such as insufficient RAM (*) or a low-performance graphics processor may also affect performance and compatibility.
(*) Regarding Windows 11, the system uses 6 GB on a PC fitted with 8 GB of RAM and more than 10 GB on a machine with 16 GB.
- When it starts, NavimetriX checks whether a newer version exists. If so, it displays “A new version is available. Would you like to update your version?”: click Ok to open the download page of our website.
- You can also go directly to the download section of our website.
- Click the “Get it from Microsoft” button. It downloads the installation file NavimetrixSetup_x.y.z.exe directly from our website: there is no need to go through the Microsoft Store app.
- Run the installation file.

⚠️ If you receive a warning from your antivirus, it is most likely a false positive. The NavimetrixSetup_x.y.z.exe file is officially signed with an EV (Extended Validation) code signing certificate issued by SSL.com, on behalf of SOFT4SAIL (France).
You can check on VirusTotal that our .exe file is clean and recognized as safe by major antivirus programs.
The blocking message displayed by Windows corresponds to the “SmartScreen” protection mechanism, which can be temporarily triggered on recent or little-used applications, even when they are correctly signed. You can therefore safely authorize the application to run:
Either in the window that appears:
- Click on the “More info” option, then “Run anyway”.
Or by marking the file as safe:
- Right-click on NavimetrixSetup_x.y.z.exe.
- Select “Properties.”
- At the bottom of the “General” tab, check “Unblock.”
- Click “Apply” then “OK.”
- Restart the installation.
Resolving an issue on a Windows PC can be complex, given the wide variety of possible configurations. Here are some basic steps to check:
- Check the app version
- Make sure you have the latest version of the application.
Your version number is shown in Settings, under About (“Version x.y.z”). When it starts, NavimetriX tells you itself when a newer version exists: “A new version is available. Would you like to update your version?”. To update your app, follow this link and click the “Get it from Microsoft” button (see also How do I update my application on Windows?).
- Make sure you have the latest version of the application.
- Check your Windows version
- Your system must be Windows 10 version 1809 (build 10.0.17763) or later, 64-bit (x64). See the prerequisites in the FAQ section of our website for more details.
- Your system must be Windows 10 version 1809 (build 10.0.17763) or later, 64-bit (x64). See the prerequisites in the FAQ section of our website for more details.
- Try another network
- If you are connected to your home Wi-Fi, try using mobile data sharing (hotspot), or vice versa.
- If you are on a corporate network, make sure you are not behind a firewall that could block certain data (such as coastlines or weather data) from loading.
- If you use a VPN, disable it.
- Restart your PC
- Check our Facebook group
- Visit the NavimetriX users Facebook group to see if other users are experiencing the same issue.
If these steps do not solve the problem, your PC may not be compatible due to insufficient RAM or a graphics card that does not meet the app’s requirements.
To uninstall the application:
- Close NavimetriX
- Uninstall the application from Settings > Apps > Installed apps (on Windows 10: Settings > Apps > Apps & features).
The application will be uninstalled, and all folders where it stores data as well as its registry keys will be removed.
On a Mac, NavimetriX keeps all its data in a protected folder called a “container”: downloaded GRIB files, offline chart zones, settings specific to this Mac. Moving the app to the Trash does not delete this folder. For a complete uninstall, delete it as well.
⚠️ The data in this folder is lost. Whatever is synced with your NavimetriX account is kept: you will get it back when you sign in again. Files you exported to Downloads or to another folder of your choice also stay where they are.
- Quit NavimetriX, then move the app to the Trash (Applications folder).
- In the Finder, choose Go > Go to Folder (Cmd + Shift + G), paste
~/Library/Containersand confirm. - Move the NavimetriX folder to the Trash. That is the name the Finder displays; the folder's real name, the one you see in Terminal, is
navimetrix.soft4sail.com. The full path is therefore/Users/[user]/Library/Containers/navimetrix.soft4sail.com, where [user] is your Mac username. - Empty the Trash.
Another way: open your user folder in the Finder, then show hidden files and folders by pressing Cmd + Shift + . (period) simultaneously. The Library folder appears: open Library > Containers and delete the NavimetriX folder.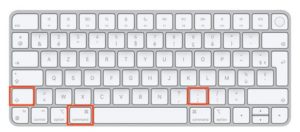


If you get an error message saying “Unable to run a file from the temporary folder. Aborting installation. Error 4551: An application control policy has blocked this file” with Windows 11:
This error is caused by Smart App Control, a Windows 11 security feature that sometimes blocks the installation of new software.
To resolve the issue, you must:
- Go to Settings → Privacy and Security → Windows Security → App and browser control.
- Click Smart App Control and disable it.
- Restart the installation.
⚠️ On some versions of Windows 11, Smart App Control cannot be turned back on once it has been turned off, except by reinstalling Windows.
If there is no Wi-Fi or USB connection to the onboard instruments, you can use a Bluetooth GPS device such as the GNS3000 from GNS Electronics. The procedure is as follows:
- Pairing the device:
- Put your GPS receiver into “pairing” mode (refer to the user manual for specific instructions; this usually involves pressing and holding a button).
- In Windows 11, go to Settings > Bluetooth & devices > Add a device.
- Select Bluetooth, choose your GPS receiver from the list, and complete the pairing process.
- Checking in Device Manager:
- Once connected, Windows usually installs the driver automatically.
- Right-click the Start button > Device Manager.
- Expand the Ports (COM & LPT) section. Your GPS should appear as a USB or Bluetooth serial port (e.g., “Standard Serial over Bluetooth link” with a COM port number, such as COM3). Note this port number.
- Using it with NavimetriX:
- NavimetriX reads the GPS's NMEA data on the COM port noted in the previous step.
- Open Settings by tapping the chevron handle (‹) on the right edge of the screen, then select GPS & NMEA. Set:
- GPS source = NMEA. With “Internal”, NavimetriX uses the position provided by Windows and ignores the Bluetooth GPS.
- NMEA switch: on.
- NMEA Protocol = SERIAL.
- Serial port = the COM port noted above (for example COM3). If the GPS appears on two COM ports and the first one receives nothing, try the other.
- Baud rate = the rate given in the receiver's manual (often 4800 or 9600).
- If you have turned on this page's Advanced mode, choose GPS source = GPS instead, then set the NMEA Protocol, serial port and baud rate in the GPS tab. The NMEA switch, in the Instruments tab, must stay on.
You should see your location data appear. If your GPS isn't detected, make sure the manufacturer-specific drivers (e.g., Garmin, Globalsat, GNS) are installed for your Windows version.
With a Premium subscription, you’ll enjoy the full potential of the application.
In addition to all the features of the free version:
- Synchronization across all your devices with a NavimetriX account: create a route on your phone, and it is instantly available on your PC. Your tracks and logbook are synchronized too.
- Wide selection of weather models: the free version gives access to the U.S. GFS; Premium unlocks all the other models, global ones such as the European IFS, and regional ones
- Wave and current forecasts
- Historical GRIBs (weather archives)
- Routing beyond 2 days (the limit of the free version), over the full range of the GRIB
- Weather briefing generated by our AI
- Navigation mode
- Connection to onboard GPS and NMEA data
- AIS target processing, including AIS over the Internet
- Anchor watch, with SMS alert
- And much more...
You’ll benefit from a 7-day free trial period with your first subscription (only once per Google account or Apple ID), so don’t hesitate to give it a try. We’re confident you’ll be convinced.
The Premium subscription is annual and renews automatically. A 7-day free trial is granted with the first subscription only.
The price depends on the region where you subscribe. The exact price, in your currency, is shown on the purchase button of the app's Premium Subscription window.
For example, it is:
- 70 GBP in the UK
- $80 in the US
- €80 per year in mainland France.
Please note that the subscription does not include nautical charts. To navigate with marine charts, you need either a subscription on the Geogarage platform, or C-MAP charts DISCOVER X or REVEAL X (Digital License), purchased on the Navico web store and used with your C-MAP account (Settings > C-MAP charts; not in the browser version).
At the moment, you cannot subscribe directly from a Windows PC, nor on Linux or in the browser version: the app's Premium Subscription window says so. To get a subscription, use the app on an iPhone, iPad or Mac (App Store) or on an Android device (Google Play Store): see How to subscribe and create a NavimetriX account?
This subscription will then be valid on all your devices, including your PC.
When renewing a subscription or at the end of the trial period, in order to update our database with the information provided by the App Store or the Google Play Store, you must launch the application on the device that took out the subscription, while logged in to your NavimetriX account on that device.
Important: On your PC or any device where you did not take your subscription, make sure to log in to your NavimetriX account to see your subscription.
Unfortunately, this is a fairly common problem with the Google Play Store, whose payment validation process may fail if the bank has not done what is needed. It can also come from the connection with the banks' servers.
The payment is handled by Google, not by NavimetriX: the only options we can suggest are to:
- try again;
- try with another bank card;
- use a Google Play gift card, sold in supermarkets and many shops;
- take out the subscription on an Apple device (iPhone, iPad or Mac). Then create your NavimetriX account on that Apple device, right after subscribing, and log in to that account on your Android device: the subscription will be recognised there. See How to subscribe and create a NavimetriX account?
The NavimetriX app has no cancel button: the subscription is cancelled with the store where you took it out, Apple or Google.
• Cancel your subscription on the App Store (iOS/iPadOS):
Cancellation is done through your Apple account.
To turn off an automatically renewing subscription on an Apple device (iOS/iPadOS):
Settings > Your Account > Subscriptions > Select the subscription > Cancel Subscription
• Cancel your subscription on the App Store (macOS):
To cancel a subscription on a Mac, follow this link.
Note: the 7-day free trial is only granted with the first subscription. During that trial, do not cancel before the end of the 7 days if you wish to keep Premium access. However, if you do not want to continue, you must cancel before the end of the 7th day to avoid being charged. If you have already had a trial, the subscription is charged as soon as you subscribe.
• Cancel your subscription on the Google Play Store (Android):
Cancellation is done through your Play Store account.
To turn off an automatically renewing subscription on an Android device:
Follow the instructions on this page.
Note: the 7-day free trial is only granted with the first subscription. During that trial, do not cancel before the end of the 7 days if you wish to keep Premium access. However, if you do not want to continue, you must cancel before the end of the 7th day to avoid being charged. If you have already had a trial, the subscription is charged as soon as you subscribe.
Yes, this is possible thanks to the Google Play Family Library (family sharing).
NavimetriX supports Google Play family sharing. Your Premium subscription can be shared with the members of your family group, each with their own Gmail address.
Four solutions depending on your situation:
- Google Play Family Library (different Gmail addresses within a family): Create a family group on Google Play, then add your family members. Once added, they will be able to access your NavimetriX Premium subscription on their own Android devices. See Google's help: Share Google Play content with your family.
- Same Gmail account on several devices: If you want to use NavimetriX Premium on several of your own Android devices, sign all of them in with the same Gmail account (the one that purchased the subscription).
- Two subscriptions with the same NavimetriX account: You can also purchase a subscription on each Gmail account (two subscriptions on the Play Store) and use the same NavimetriX account on all your devices. This way, your settings, routes, and points of interest stay synchronized.
- To use NavimetriX Premium on other platforms (iOS, macOS, Windows, or Linux): Create a NavimetriX account in the app after subscribing, on the device that took out the subscription, then sign in to that same account on your other devices. The subscription will be recognized regardless of the platform.
To create your NavimetriX account, see the FAQ "How to subscribe and create a NavimetriX account?".
Yes, this is possible thanks to Apple Family Sharing.
NavimetriX supports Family Sharing. Your Premium subscription can be shared with up to 5 family members, each with their own Apple ID, as long as they belong to your Apple Family group.
Three solutions depending on your situation:
- Apple Family Sharing (different Apple IDs within a family): Set up Family Sharing in Settings > [your name] > Family Sharing, then add your family members. Once added, they will automatically have access to your NavimetriX Premium subscription on their own Apple devices. See Apple's help: Set up Family Sharing.
- Same Apple ID on several devices: If you want to use NavimetriX Premium on several of your own Apple devices (iPhone, iPad, Mac), sign all of them in with the same Apple ID (the one that purchased the subscription).
- To use NavimetriX Premium on other platforms (Android, Windows, or Linux): Create a NavimetriX account in the app after subscribing, on the device that took out the subscription, then sign in to that same account on your other devices. The subscription will be recognized regardless of the platform.
To create your NavimetriX account, see the FAQ "How to subscribe and create a NavimetriX account?".
Open Settings by tapping the chevron handle (‹) on the right edge of the screen. The first section groups the basic settings:
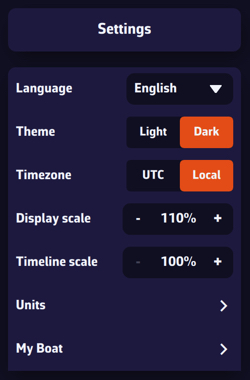
- Theme: Light, Dark (default) or Night. The Night theme shows the interface in red and amber on a black background, to preserve your night vision. The theme is specific to each device: you can stay in Light in the cockpit and switch to Dark at the chart table.
- General: the app preferences, described below.
- My Boat: all the settings about your boat: name, type, MMSI, identity, dimensions, polar, COG vector, heading line, track, etc.
The General page
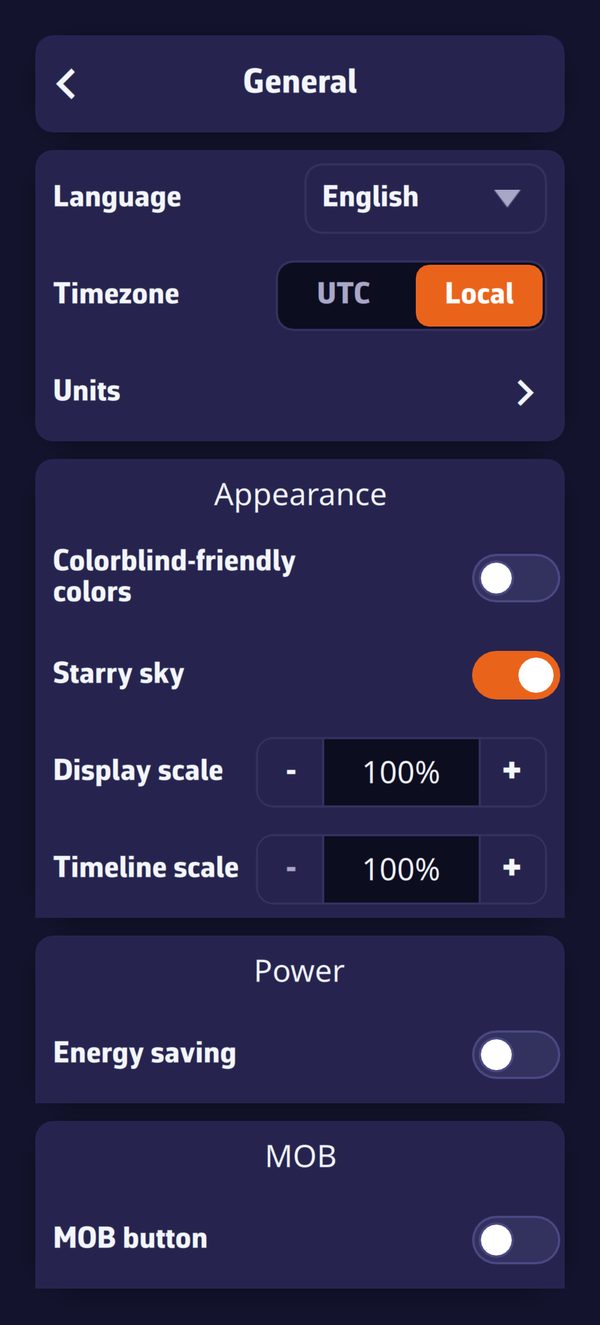
- Language: English, French, German or Spanish.
- Timezone: UTC (Coordinated Universal Time) or Local (your device's time).
- Units: speed, angle, bearings, temperature, rain, waves, pressure, depth, distance and short distance, to suit your habits.
Appearance section:
- Colorblind-friendly colors: colors that carry a meaning (port and starboard, alerts, AIS danger, wind scale…) switch to a palette that colorblind users can read. This setting follows your account on all your devices.
- Starry sky: shows the stars, sun, moon and planets around the globe when you zoom out. It is purely decorative.
- Display scale: enlarges or reduces all the items on the map, from 60% to 200%. See What is the display scale setting?
- Font (Windows only): size of the whole interface, from 75% to 250%. See How to increase the size of text displayed in Windows?
- Timeline scale: stretches the time bar, from 100% to 500% in steps of 100%. The higher the value, the more room each hour takes and the finer you can pick a time with a tap: in one-hour steps at 100%, down to 5 minutes at 500%.
Power section: Energy saving lowers the update rate of the instruments, the device GPS and the alarms, and stops the wind and current particle animation, to save battery.
MOB section: MOB button shows a Man Overboard button at the bottom left of the map, in Navigation mode.
Some settings are essential, both for safety and for the proper functioning of the application.
- Set location access to “Always”
- On iPad / iPhone: Device Settings > Apps > NavimetriX > Location = “Always”.
- On Android: Device Settings > Location = On > App Permissions > Location > Allow only while using the app. (N.B.: NavimetriX keeps location active in Navigation mode.)
- Disable the device unlock code
You and your crew members must be able to access the navigation app instantly, whatever the situation. At sea, a code is useless, even dangerous if you are unable to handle navigation yourself: your crew must be able to take over quickly.
- Disable automatic sleep mode
- On iPad / iPhone: Settings > Display & Brightness > Auto-Lock = “Never”.
- On Android devices: Settings > Display > Screen timeout = from 0 to 30 minutes depending on the brand and model; unfortunately, “Never” is rarely available. Set it to the maximum possible time. Good news: on Android, NavimetriX itself keeps the screen on while Navigation mode is active, so this setting only matters outside that mode.
Unexpected sleep mode during a critical navigation moment (for example, a night landfall in the rain in an unknown area) can be dangerous if you cannot instantly relaunch the app (wet fingers or a wet screen that the touchscreen no longer responds to, for example). It is up to you to switch your screen on or off deliberately, as needed.
- Disable spell checking
- On iPad / iPhone: Settings > General > Keyboard > Auto-Correction = disable.
- On Android devices: Settings > General Management > Samsung Keyboard Settings > Auto spell check = disable.
This prevents wasting time when entering text in the app, such as route names, POIs, etc.
Regarding onboard computers, PC or Mac, the same recommendations apply. Adjust the settings according to the operating system and version used.
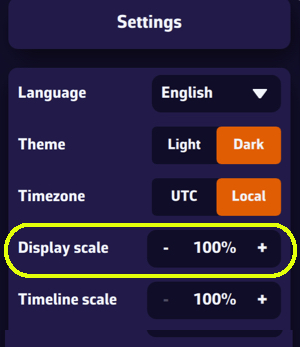
This setting allows you to enlarge or reduce the size of all elements displayed on the map, from 60% to 200% (100% by default). Very useful on board if you want to use the app without wearing your glasses.
Note that the menu font size remains unchanged.
To find it, open Settings by tapping the chevron handle (‹) on the right edge of the screen, select General, then set Display scale in the Appearance section. This setting is specific to each device: you can choose a different value on your phone and on your tablet.
On Windows, to also enlarge text and menus, see How to increase the size of text displayed in Windows?
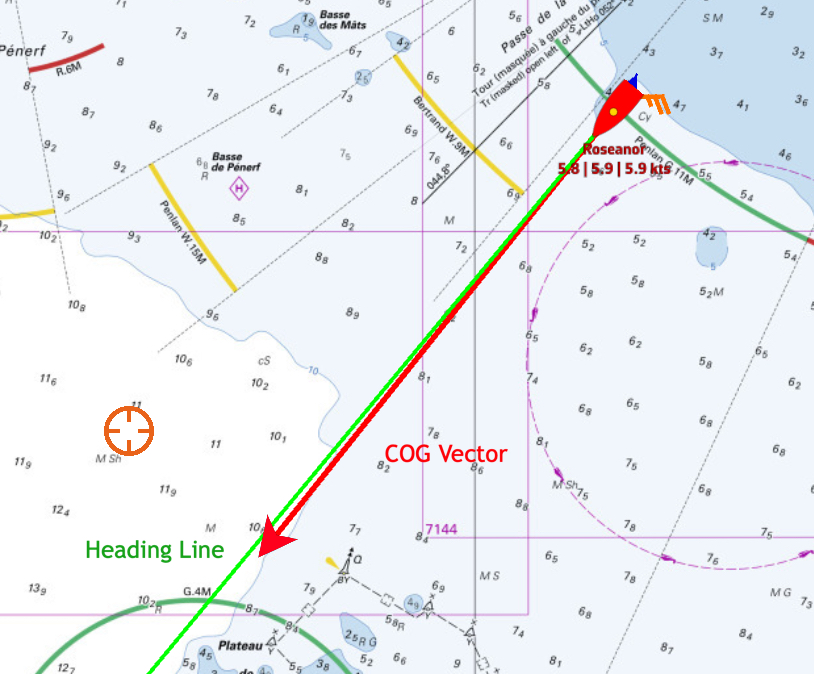
In Navigation mode (Premium only), the map shows two markers ahead of the boat: the COG vector (course over ground), a red arrow by default, and the heading line (HDG), a green line by default. The heading line only appears if NavimetriX receives a heading.
Open Settings by tapping the chevron handle (‹) on the right edge of the screen, then select My Boat.
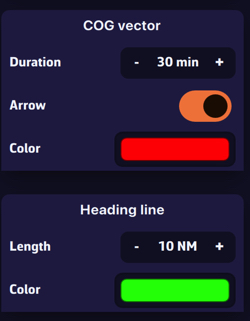
- COG vector: its Duration is set in minutes, from 0 to 300 (60 by default). The vector shows the distance covered during that time at your current speed: for example, 30 minutes at 6 knots gives a 3 nautical mile vector. Its length therefore varies with your speed. The Arrow switch shows or hides the arrowhead, and Color changes its color.
- Heading line: its Length is set as a distance on the map, from 0 to 300 NM (60 NM by default), for example 20 nautical miles. Color changes its color.
On Windows, NavimetriX automatically chooses the size of its interface according to your screen. If the text looks too small (or too large), adjust it directly in the app:
- Open Settings by tapping the chevron handle (‹) on the right edge of the screen.
- Select General.
- In the Appearance section, set Font: from 75% to 250%, in steps of 25%. The value shown at first is the one NavimetriX chose for your screen.
- The app displays “Please restart the application to apply the new scale.”: close NavimetriX, then start it again.
The new size applies to the whole interface: text, menus, settings and buttons.
This setting only appears on Windows. To enlarge only the items displayed on the map, use the Display scale setting just above it: see What is the display scale setting?
By default, the target is placed in the center of the screen, allowing you to drag the map underneath it and use the zoom to position it at a specific location.
However, you can lock the target to other elements, or even disable it.
Tap (or click) the orange round layers button at the bottom right of the screen.
In the “Target” drop-down list, under the “Forecast display” section, choose which element you want to lock the target to:
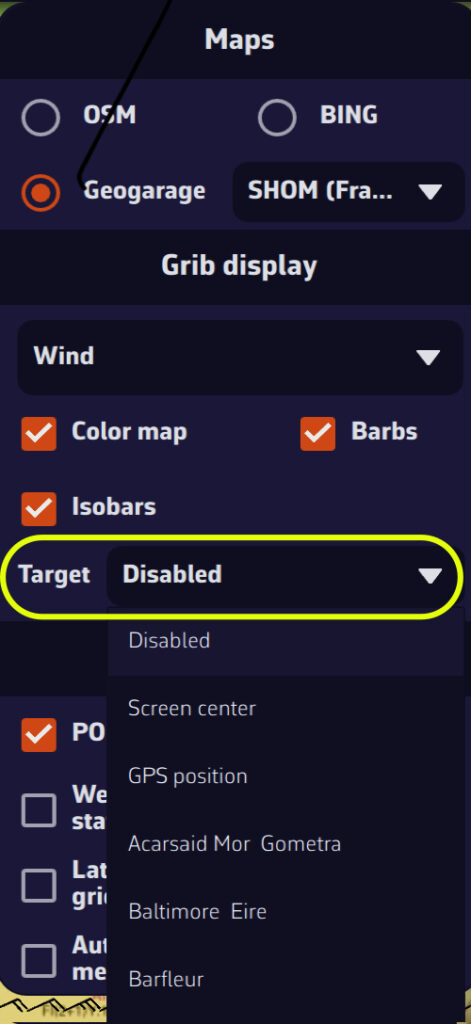
- “Disabled” (to remove the target from the screen)
- “Screen center” (to put it back in its original location)
- “GPS position” (to place it on your boat)
- A POI: the list offers your POIs that are visible on the map, sorted by name.
You can also lock the target onto a POI by editing it.
The target can be set at any time, whether or not a GRIB is loaded.
Changing sails costs time: hoisting a kite, dropping a genoa, taking a reef. Without a penalty, a router changes sail as soon as the instantaneous gain is positive, even a tenth of a knot for three minutes.
The Sail change penalty setting sits in the Routing settings, in the same block as the tack and gybe penalties. Its default is 120 seconds.
When it applies
The penalty only makes sense if your polar carries a Sailchart: without one, routing has no sail identity and the penalty stays inert.
It adds to the others: a gybe that comes with a sail change costs both.
One important point: if the cell you enter still allows the sail you are carrying — that is what alternates in transition bands are for — you do not change sail, so you pay nothing. This is what prevents back-and-forth changes along a boundary.
Which value should I use?
The time it really takes you, crew included, between deciding and having the boat back up to speed. Short-handed on a cruising boat, two to four minutes is realistic; with a trained racing crew, one minute may do. Setting 0 lets the router change sails as often as it likes, free of charge.
A GRIB file (for GRIdded Binary) is a standard file format used by meteorological services to distribute numerical weather forecasts.
It contains the raw data generated by weather models (wind, pressure, rain, waves, currents, etc.) organized on a grid covering a geographic area.
Why use this format?
- It is compact: GRIB files are compressed and therefore quick to download, even with limited internet connections.
- It is standardized: most navigation and weather applications can read GRIB files. There are two formats, grib1 and grib2. NavimetriX downloads its files in the newer grib2 format, and can also read grib1 files that you import.
- It is flexible: you can choose the area, resolution, and parameters (wind, waves, currents, etc.) you wish to download.
What does a GRIB file contain?
Depending on the selected model, a GRIB file may include:
- Wind (direction, speed, gusts)
- Atmospheric pressure
- Temperature, humidity, precipitation
- Sea state (swell, waves)
- Marine, oceanic, and tidal currents
What is it used for in navigation?
A GRIB file allows you to visualize the evolution of the weather over a given area directly within your navigation software or weather app.
To illustrate the process, let’s say we’re planning a 4-day passage from La Rochelle (France) to Cowes (UK).
- Pan and zoom to your sailing area. Unless you’re doing an ocean crossing, pick a selection slightly larger than your route.
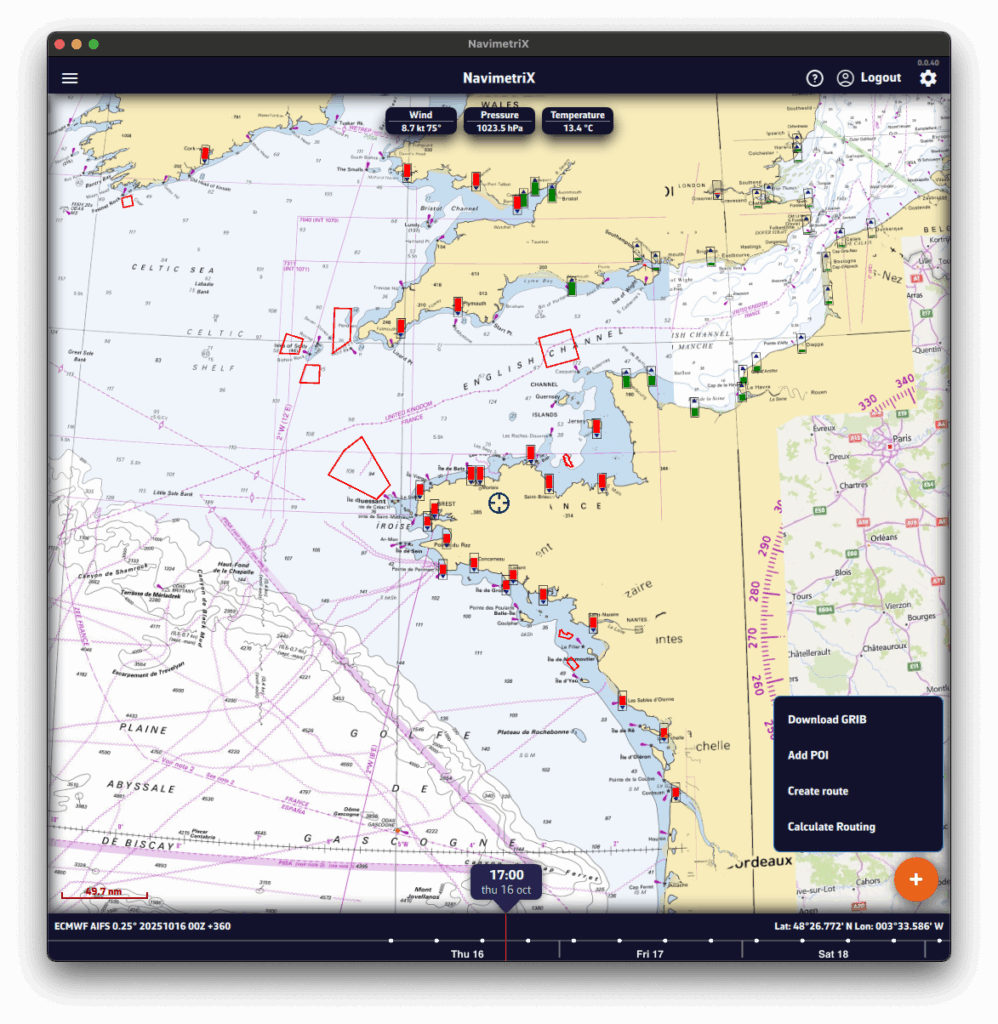
- Press the round orange + button at the bottom right.
- Tap Download GRIB.
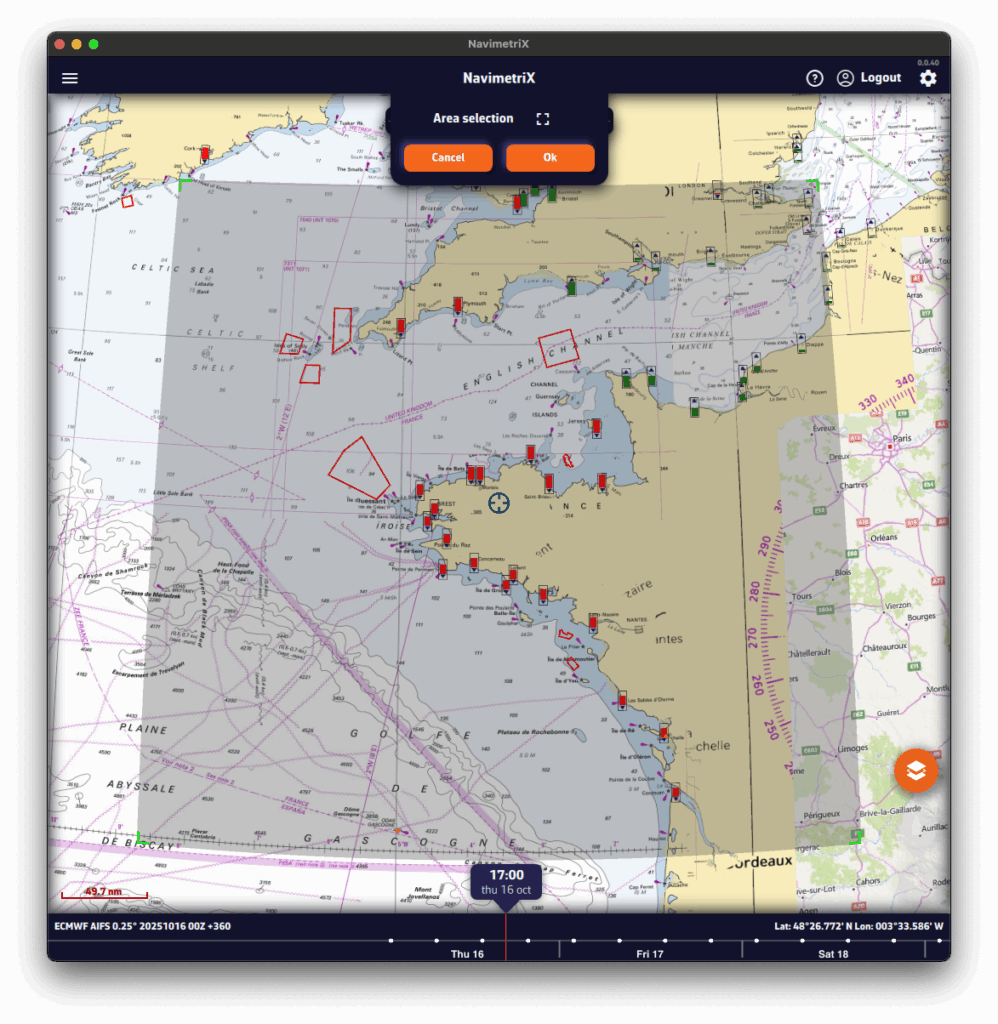
- The Area selection banner appears at the top of the screen. If needed, adjust the selection using the four green corners.
- Press OK. To let NavimetriX pick the models for you, tap the magic wand in the banner instead (see Suggested models below).
A Download GRIB window opens. The choices are filtered to your selected area.
Without the Premium option, you’re limited to the GFS model (the U.S. NOAA global atmospheric model): only the Atmospheric type and Global coverage are offered.
- Choose the Type of data to download:
- Atmospheric
- Current
- Sea State
- Ensemble (ensemble models: GEFS, ECMWF IFS ENS)
- Observations (ASCAT) (satellite-measured wind)
- Choose the Coverage:
- Global
- Regional: for trips up to about 5 days, a regional model is usually best.
- If applicable, select the Region.
- Select the Model.
See our FAQs for guidance on models.
If unsure, choose the atmospheric global ECMWF IFS or GFS. - If needed, check the Model description and map coverage.
- Select the Days and Timestep.
If unsure, keep the defaults. - Tick the parameters to download (Wind, Pressure, etc.).
If unsure, keep the defaults.
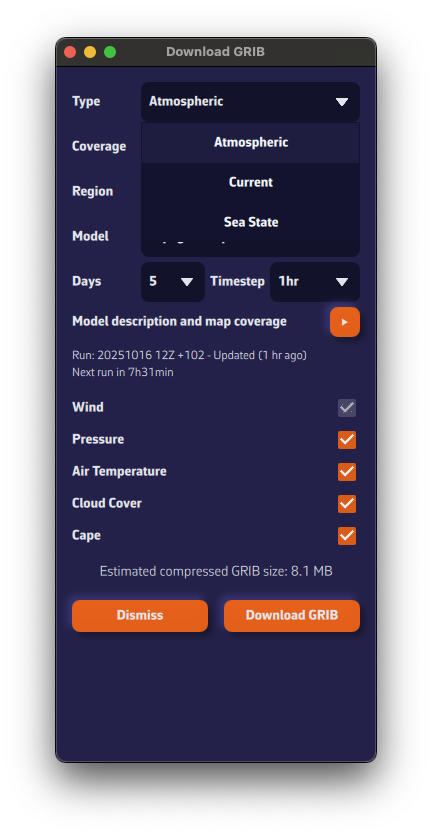
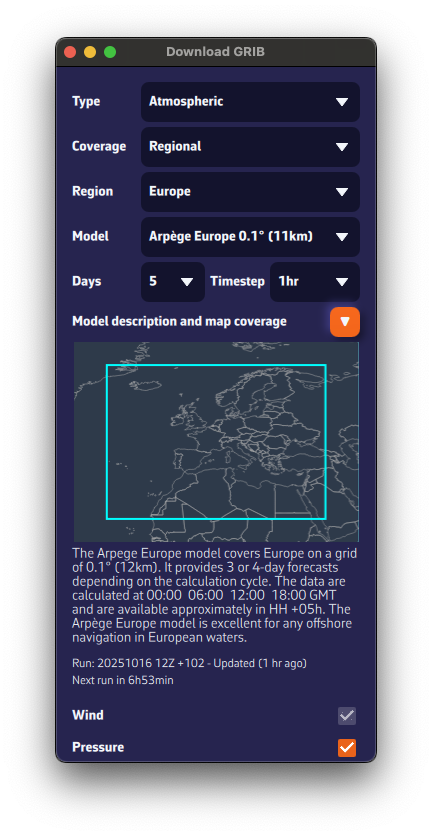
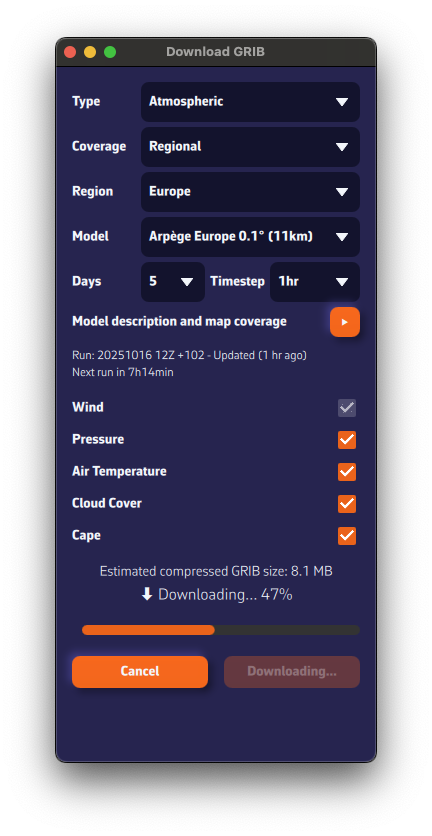
The estimated compressed GRIB size appears at the bottom. Keep it reasonable: if you see about 200 MB, you probably chose a model that’s too fine or too many parameters.
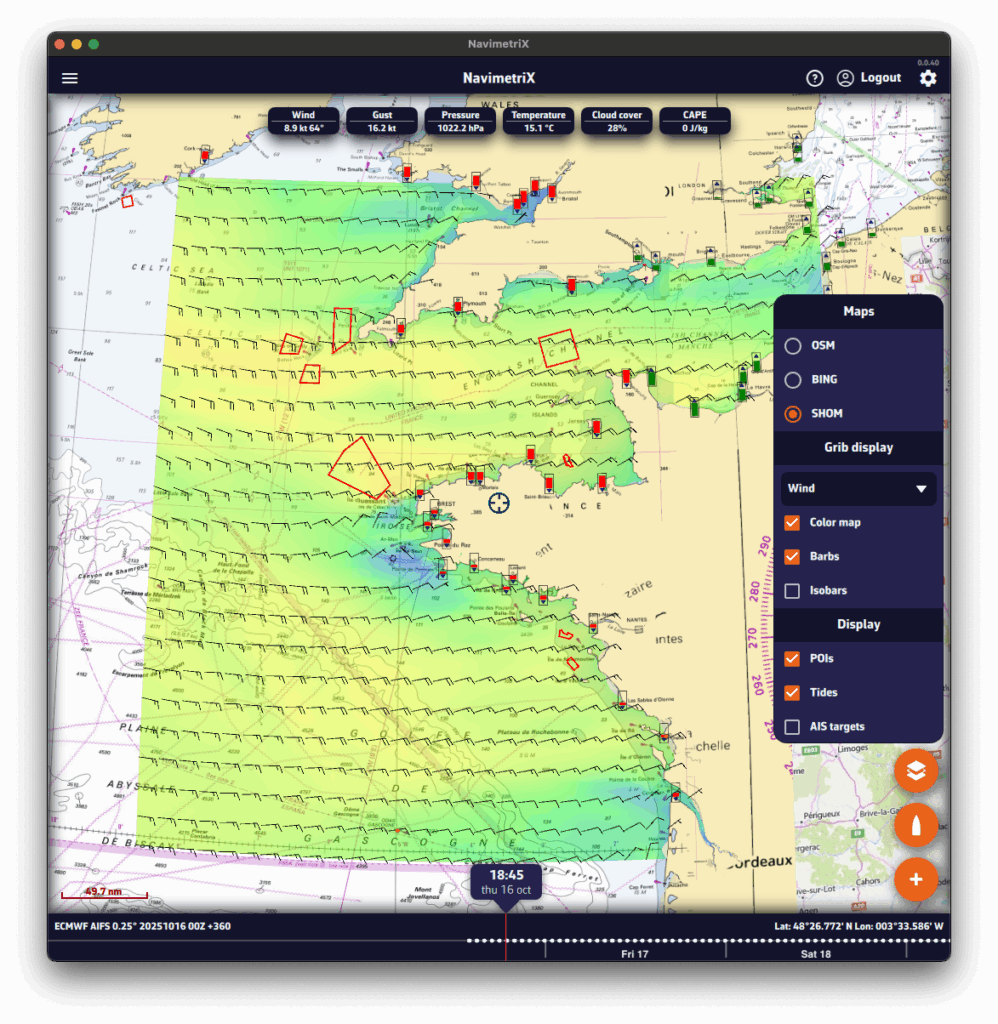
Below the model description, we show the latest model calculation time (the Run).Run: 20251016 12Z +102 means: calculated on Oct 16, 2025; initialized at 12:00 UTC (12Z); contains 102 forecast hours from that run.
We also display the estimated time until the next run is available.

- Press Download GRIB.
- The GRIB file downloads from our fast, redundant servers.
- Once downloaded, it is:
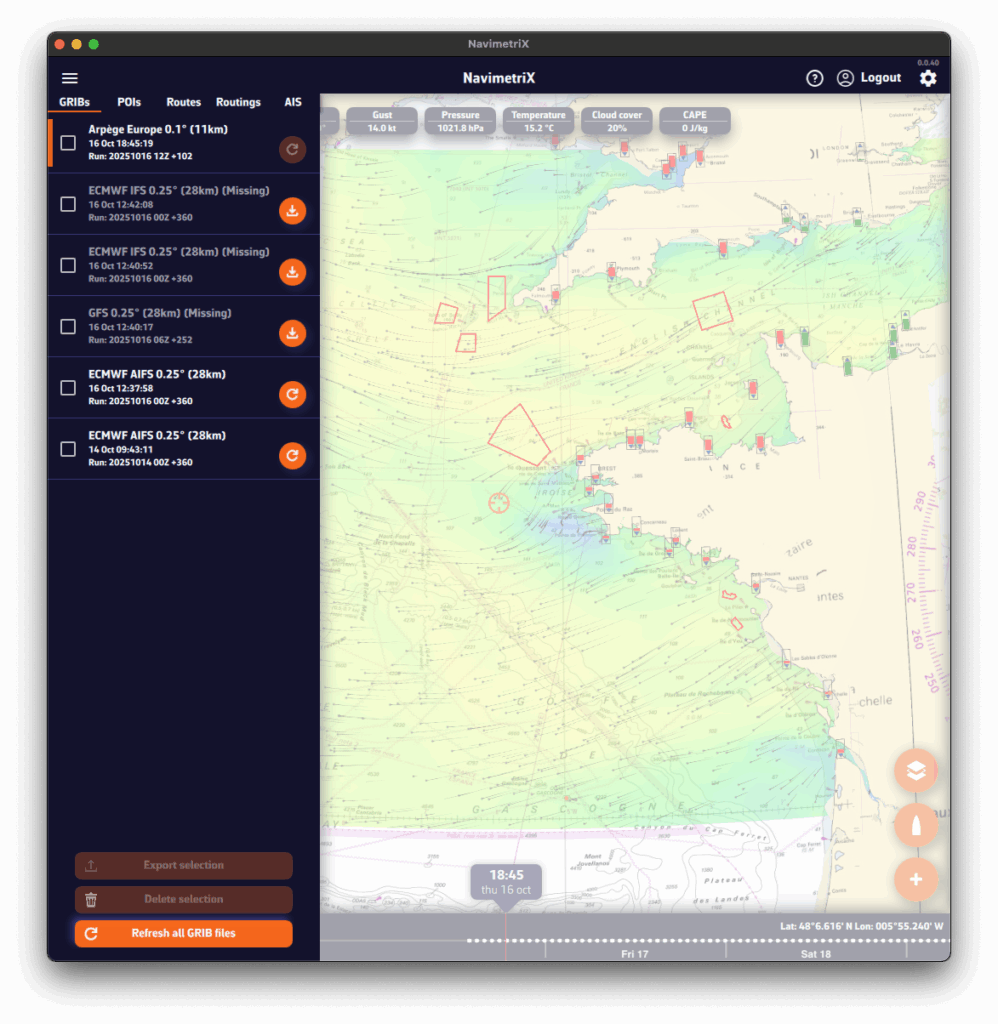
- displayed on the map. If you don’t see it, tap the round orange layers button and tick Color map and Particles (the box reads Barbs if you chose that wind display).
- added to the list in the GRIBs tab of the left panel: open it with the chevron handle (›) on the left edge of the screen.
Suggested models: let NavimetriX choose
In the Area selection banner, the magic wand analyses the area you drew and opens the Suggested models window. It proposes a combination suited to the area:
- Wind: the suggested model, with its coverage (regional or global) and forecast range. A list lets you pick another one, and the + button adds more wind models to compare.
- Current: the SHOM tidal atlas in coastal tidal areas, a current GRIB, or None.
- Waves: a wave model, ticked by default for an offshore passage, optional for coastal sailing.
Each line can be ticked or unticked. An optional Zone name (8 characters at most) is shown in front of these GRIBs’ names in the list. The Download button fetches the missing files, displays the wind on the chart and sets the chosen current and waves as routing sources.
In the GRIBs tab of the left panel (chevron handle (›) on the left edge of the screen), each file has a round button on its right. This button shows the update status of your GRIB file and can display three different states:
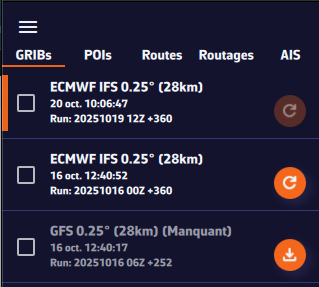
1. Dark orange “Refresh” icon: file up to date
The icon appears in dark orange right after a GRIB file has been downloaded. This means your file is up to date: you already have the latest available version of the weather model.
This is what you will see immediately after downloading a GRIB file.
2. Light orange “Refresh” icon: new run available
The icon turns light orange. This means a new model run (a new forecast) is available. To update your GRIB file, simply click or tap this icon: the file will automatically be replaced with the latest version.
3. Light orange icon with a download symbol: file missing on this device
Finally, the icon may appear in light orange with a small download symbol, and the row reads Missing. This means you have already downloaded this GRIB file on another device, but it is not yet available locally on the one you are using. To retrieve it, simply click or tap the icon: the file will be downloaded automatically.
Update everything at once
The Refresh button in the bar at the bottom of the list updates every GRIB that has a new run in one go, and fetches the missing files. It stays greyed out while there is nothing to refresh.
Let NavimetriX update for you
At the top of the list, turn on the Auto download switch. As soon as a new run is available for one of your GRIBs, NavimetriX refreshes them without waiting for you, including when the app comes back to the foreground.
The other buttons on the row
- The ⋮ button opens the file menu: Rename, Export (Share on phones and tablets) and Delete.
- For the displayed GRIB, when the chart centre is inside its area, a table-shaped button opens the Meteogram: this GRIB’s forecast at the chart centre, time step by time step.
See also: Where can I see weather models status?
Global models (such as GFS or ECMWF IFS) cover the entire planet. They are essential for long crossings and long-range forecasts (up to 15 or 16 days depending on the model). Their grid is coarser than that of regional models: from 9 km for the finest (ECMWF IFS 0.1°) to more than 100 km for the lightest versions. They are used to get an overall view of the weather and for long passages.
Regional models focus on a specific area (France, Europe, the Mediterranean…). Their coverage is smaller, but their resolution is much finer (from 1 to 11 km), which gives a better view of local effects such as thermal breezes, thunderstorms, terrain and coastal winds. In return, they do not look as far ahead: from 18 hours to 5 days depending on the model, most often 2 to 3 days. They are used for day trips or short cruises.
See also: What weather and ocean models are available in NavimetriX?
If you’re not familiar with weather models, you’re probably wondering which ones to choose. The easiest way is to let NavimetriX suggest them.
Let the app choose: “Suggested models”
- Tap the round orange + button, then Download GRIB.
- Adjust the area with the green corners.
- In the Area selection banner, tap the magic wand.
The Suggested models window opens. NavimetriX looks at the size of the area and at the models that cover all of it, then suggests a combination:
- Wind: always suggested. A regional model wins over a global one as soon as it covers the whole area, and the grid resolution follows the size of the area. You can pick another model from the list, or add more to compare them.
- Current: the SHOM tidal atlas when the area is coastal and covered by the atlas, otherwise a current model in GRIB format, or None. It is ticked by default for coastal sailing.
- Waves: ticked by default for an offshore passage, offered as an option for a coastal area.
- Zone name (optional, 8 characters at most): it is shown in front of the name of each downloaded GRIB in the list.
Start the download: NavimetriX downloads the missing files, shows the suggested wind on the chart and sets the current and wave sources of the routing.
Without the Premium option, only GFS models are suggested, plus the SHOM tidal atlas for a coastal area.
Choosing yourself
Select the model according to your sailing area and type of sailing, following the table below.
For weather data, if in doubt, choose the ECMWF IFS model. It covers the entire globe for up to 15 days. However, forecast reliability decreases with time:
| Forecast range | Reliability level |
|---|---|
| Up to 2 days | Excellent |
| 2 to 4 days | Very good |
| 4 to 5 days | Good |
| 5 to 8 days | Reasonable trend |
| 8 to 10 days | Rough trend |
| Beyond | At best a trend, often unreliable. Prefer the AIFS model, computed with artificial intelligence. |
Here’s a table to help you choose.
| Type of data | Type of sailing | France: Atlantic & Channel | France: Mediterranean | Europe (outside France) | United States | Rest of the world |
|---|---|---|---|---|---|---|
| Weather | Day sailing in a bay | Arome Arome HD | Arome Arome HD | Depending on the country: UKV, ICON D2, HARMONIE, MET Nordic, ICON-2I, ALADIN-HR, WRF LaMMA, WRF Cyprus | HRRR CONUS NAM | Arome overseas (Antilles, Guyane, Polynésie, Calédonie, Réunion-Mayotte), otherwise ECMWF IFS |
| Weather | Coastal | Arpège Europe or ICON Europe | Arpège Europe or ICON Europe | UKV, ICON Europe or Arpège Europe | NAM | ECMWF IFS |
| Weather | Offshore | ECMWF IFS and AIFS GFS | ECMWF IFS and AIFS GFS | ECMWF IFS and AIFS GFS | ECMWF IFS and AIFS GFS | ECMWF IFS and AIFS GFS |
| Waves | Coastal | MFWAM France IFREMER WW3 | MFWAM France Copernicus Med Waves | Copernicus Med Waves (Mediterranean) DMI WAM (North Sea, Baltic) MFWAM Global | GFS Wave | IFREMER WW3 overseas (Antilles, New Caledonia, Réunion), otherwise GFS Wave |
| Waves | Offshore | MFWAM Global ECMWF Wave GFS Wave | MFWAM Global ECMWF Wave GFS Wave | MFWAM Global ECMWF Wave GFS Wave | MFWAM Global ECMWF Wave GFS Wave | MFWAM Global ECMWF Wave GFS Wave |
| Currents | Day sailing in a bay | Ifremer | SHOM Méditerranée Nord Copernicus Med | BSH (German Bight, Western Baltic) Copernicus | MSC NCOM | Copernicus SMOC |
| Tidal currents | Coastal | SHOM Manche-Gascogne Copernicus IBI | Copernicus Med | Copernicus IBI or ENWS | MSC NCOM | Copernicus SMOC |
| Ocean currents | All | Copernicus IBI | Copernicus Med | Copernicus IBI or ENWS | Copernicus Global RTOFS Global | Copernicus Global RTOFS Global |
See also: What weather and ocean models are available in NavimetriX?
Regional models require the Premium option.
- Arpège Europe 0.1° (11 km)
Regional model from Météo-France covering Europe, south to the Canary Islands.
Resolution: 11 km
Forecasts up to 4 days (102 h)
👉 Ideal for planning a passage of a few days in the Channel, the Atlantic or the Mediterranean, as it captures the large European weather systems well.
- Arome 0.025° (3 km)
Very high-resolution model from Météo-France.
Resolution: 3 km
Forecasts up to 51 h
👉 Perfect for coastal sailing in France: it captures local effects such as sea breezes, summer thunderstorms and terrain-induced winds.
- Arome HD 0.01° (1 km)
Even finer version of Météo-France’s Arome model.
Resolution: 1 km
Forecasts up to 51 h
This model only contains wind.
👉 Very useful for racing or coastal sailing: it helps anticipate small wind shifts near headlands, bays or high ground. Be aware, it can sometimes be a bit “reactive”.
- ICON Europe 0.07° (8 km)
Regional model from the DWD (German weather service).
Resolution: 8 km
Forecasts up to 5 days
👉 Suitable for sailing in the Channel, the North Sea, the western Mediterranean and the nearby Atlantic. A good complement to the French models, often cited as the best in the Mediterranean.
- ICON D2 0.02° (2 km)
Very high-resolution version of the ICON model, centred on Germany and neighbouring countries.
Resolution: 2 km
Forecasts up to 48 h
👉 Useful for the North Sea and the Baltic, where local effects (coastal winds, thunderstorms) matter.
- UKV 0.027° (2 km)
Regional model from the UK Met Office, covering the British Isles and the Channel.
Resolution: 2 km
Forecasts up to 5 days
This model contains wind and gusts.
👉 Ideal for sailing around the British Isles, in the Channel and in the Celtic Sea, where local accuracy is essential.
- HARMONIE Netherlands 0.02° (2 km)
Regional model from KNMI (Dutch weather service), covering the Netherlands and the southern North Sea.
Resolution: 2 km
Forecasts up to 60 h
👉 For sailing along the Dutch and Belgian coasts and in the southern North Sea.
- MET Nordic 0.01° (1 km)
Regional model from MET Norway, covering Scandinavia and the Baltic.
Resolution: 1 km
Forecasts up to 58 h
👉 For the Norwegian, Swedish and Finnish coasts and the Baltic.
- ICON-2I 0.025° (2 km)
Regional model from ItaliaMeteo, covering Italy and the surrounding seas.
Resolution: 2 km
Forecasts up to 72 h
No gusts in this model.
👉 For sailing in the Tyrrhenian, Ligurian, Adriatic and Ionian seas.
- WRF LaMMA 0.02° (1.5 km)
Regional model from ItaliaMeteo, CIMA and LaMMA, covering Italy and the surrounding seas.
Resolution: 1.5 km
Forecasts up to 72 h
No gusts and no cloud cover in this model.
👉 A second high-resolution opinion around Italy, Corsica and Sardinia.
- ALADIN-HR 0.025° (2 km)
Regional model from DHMZ (Croatian weather service), covering Croatia and the Adriatic.
Resolution: 2 km
Forecasts up to 72 h
👉 For sailing along the Croatian coast and its islands.
- WRF Cyprus 0.025° (3 km)
Regional model from the Cyprus weather service.
Resolution: 3 km
Forecasts up to 5 days
No gusts in this model.
👉 For sailing around Cyprus.
Wave settings
Open Settings by tapping the chevron handle (‹) on the right edge of the screen, then select Forecast display.
- Wave display
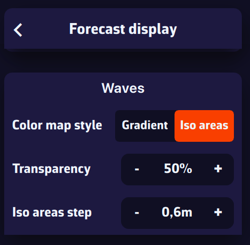
In the Waves section, select the Iso areas colour style, which represents wave height as bands of equal height, using rainbow colours from blue (calm sea) to magenta-red (rough to very rough sea), passing through various shades of green, yellow, orange and red. Particularly well suited for wave data. The Gradient style shows the same colours as a continuous blend.
Transparency lets you adjust the colour mask depending on the background (satellite planisphere or nautical chart).
Iso areas step lets you adjust the spacing of the bands (e.g. in 0.60 m increments).
Displaying waves
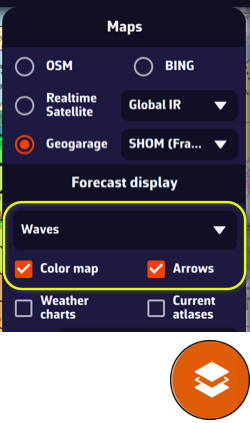
On the chart, the round orange layers button at the bottom right of the screen lets you choose what to display.
In the Forecast display section, the drop-down menu lets you select a data layer to display. If you have loaded a wave GRIB file on screen (for example an MFWAM model), the Waves data will be selected by default. You can then tick or untick the Color map (wave height) and the Arrows (wave direction). With waves, the box is called Arrows: barbs and particles are for the wind only.
This section automatically adapts to the type of GRIB file currently displayed: weather, waves, or currents.
What the chart shows
- The colour map shows the significant height of the total sea, that is the wind sea and the swell combined.
- The arrows start at the grid point and point the way the waves travel. Their length grows with the height. No arrow is drawn over land.
- If the file also contains the wind sea and the swell separately (as GFS Wave, MFWAM Global and France, Copernicus Global and Mediterranean and DMI WAM do in the catalogue), each point carries two arrows: the wind sea in black (white over the satellite background) and the swell in red. Where they are missing, a grey arrow shows the total sea.
The value labels
The value labels give, at the target, the height, the direction the waves come from and the period. When the file contains the wind sea and the swell, the Waves label becomes Total sea, and two labels, Wind sea and Swell, appear next to it with their own height, direction and period.
Without the Premium option, only GFS models can be downloaded.
- ECMWF IFS 0.1° (9 km), 0.25° (28 km), 0.4° (44 km), 1° (111 km)
Global model from the European Centre (ECMWF). Often considered the most reliable for medium-range forecasts.
Resolution: from 9 km to 111 km
Forecasts up to 15 days
👉 A key reference for offshore sailing. Prefer the high-resolution version (0.1°) for a small area, 0.25° with a good connection for a larger area, or a lighter version (0.4° or 1°) when bandwidth is limited and the area very large. The 0.1° version only contains wind, gusts and pressure.
- GFS 0.25° (28 km), 0.5° (56 km), 1° (111 km), 2° (222 km)
Global model from NOAA (United States). Available in several resolutions: the finer the grid, the heavier but more accurate the file.
Resolution: from 28 km to 222 km
Forecasts up to 16 days
👉 A key reference for offshore sailing. Prefer the fine version (0.25°) with a good connection, or a lighter version (1° or 2°) when bandwidth is limited. Very useful to compare with ECMWF IFS before a long passage, especially in the Atlantic and the Mediterranean.
- ECMWF AIFS 0.25° (28 km), 1° (111 km)
Model from the European Centre (ECMWF) using artificial intelligence.
Resolution: 28 km or 111 km
Forecasts up to 15 days, every 6 hours
👉 Interesting for testing the performance of AI models and having an alternative to traditional models. Improving day by day. Already probably better than ECMWF IFS and GFS for forecasts beyond 7 days.
- AIGFS 0.25° (28 km)
NOAA's artificial intelligence global model, started from the GFS analysis.
Resolution: 28 km
Forecasts up to 16 days, every 6 hours
No gusts and no cloud cover in this model.
👉 A second “AI” opinion to compare with ECMWF AIFS and GFS for long-range forecasts.
- GDPS (GEM) 0.15° (17 km)
Global model produced by Environment Canada. One of the finest global models available.
Resolution: 17 km
Forecasts up to 10 days
👉 Relevant for North Atlantic crossings and high latitudes near the Arctic.
- ICON Global 0.125° (14 km), 0.25° (28 km), 0.5° (56 km), 1° (111 km)
Global model from the DWD (German weather service).
Resolution: from 14 km to 111 km
Forecasts up to 5 days
👉 A good alternative to GFS and ECMWF IFS, especially for sailing in Europe and the Mediterranean.
- Arpège Monde 0.25° (28 km)
Global model from Météo-France.
Resolution: 28 km
Forecasts up to 102 hours (just over 4 days)
👉 Useful for offshore sailing off France, in the Atlantic or the Mediterranean, as it is well tuned for these areas.
These models give a simplified description of the sea state.
They provide the significant height of the total sea, its period and its direction. GFS Wave, MFWAM, Copernicus and DMI WAM also give this information for the wind sea and the swell; ECMWF Wave and IFREMER WW3 give the height for the total sea only.
They are used in routing mainly when conditions are rough. Wave models require the Premium option.
Global models
- GFS Wave 0.25° (28 km), 0.5° (56 km), 1° (111 km)
Global model from NOAA (United States).
Forecasts up to 16 days
3-hour time step
A reference for offshore sailing. Prefer the fine version (0.25°) with a good connection, or a lighter version (0.5° or 1°) when bandwidth is limited. - ECMWF Wave 0.25° (28 km)
Wave model of the European Centre (ECMWF), coupled with its winds.
Forecasts up to 15 days
3-hour time step up to 6 days, then 6-hour
Total sea only. - MFWAM Global 0.1° (11 km), 0.5° (56 km)
Global model from Météo-France.
Forecasts up to 102 hours (just over 4 days)
Hourly time step for 48 hours, then 3-hour
The most accurate of the global models, but with a shorter range. - Copernicus Global Waves 0.083° (9 km)
Global forecast from the Copernicus Marine Service.
Forecasts up to 8 days
3-hour time step
Regional models
- MFWAM France 0.025° (3 km)
Regional model from Météo-France covering the coasts of mainland France.
Forecasts up to 42 hours
Hourly time step
Excellent for coastal sailing. - Copernicus Med Waves 0.042° (4 km)
Copernicus Marine Service forecast for the whole Mediterranean.
Forecasts up to 8 days
3-hour time step - DMI WAM North Sea-Baltic 0.083° (5 km)
Model from the Danish weather service (DMI) covering the North Sea, the Baltic, the Channel and the Celtic Sea.
Forecasts up to 132 hours (5.5 days)
Hourly time step - IFREMER WW3 500 m
IFREMER regional models in four areas: Manche Nord, Manche Sud, Gascogne Nord and Gascogne Sud.
Forecasts up to 100 hours (just over 4 days)
Hourly time step - IFREMER WW3 190 m
IFREMER local models in nine areas: Pas de Calais, Normandie, Cotentin, Armor, Finistère, Bretagne Sud, Loire, Charentes and Aquitaine.
Forecasts up to 100 hours (just over 4 days)
Hourly time step
The most accurate wave models. A must when passing through areas known for rough water. - IFREMER WW3 overseas
Antilles (5 km), Guadeloupe-Martinique (1 km), Martinique (500 m), Nouvelle-Calédonie (5 km) and Réunion (180 m).
Forecasts up to 99 hours
3-hour time step
Global models cover the entire planet. Regional models only cover an area: make sure it includes your whole passage.
Checking the coverage in the app
- In the Download GRIB window, with Regional coverage, the Model list only offers the models that cover the selected area.
- Tap the small triangle on the Model description and map coverage line to show a map of the area covered by the chosen model.
The online coverage map
Our Regional Models Coverage page draws the area of each regional model. Hover over the map to see the models available at a given point.
Regional models by area
Atmospheric models
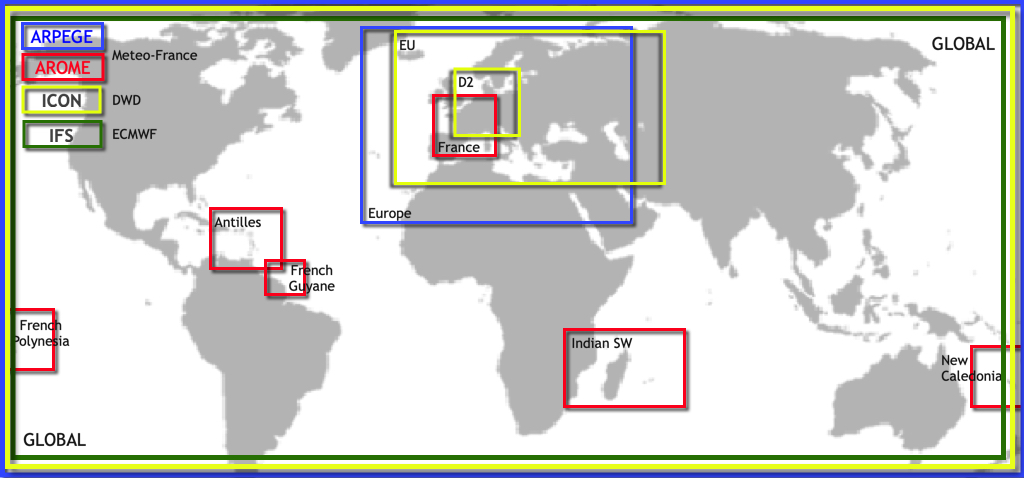
- Mainland France and neighbouring countries: Arome, Arome HD
- Europe and the Mediterranean: Arpège Europe, ICON Europe
- Germany and neighbouring countries: ICON D2
- British Isles and the Channel: UKV
- Netherlands and southern North Sea: HARMONIE
- Scandinavia and the Baltic: MET Nordic
- Italy and surrounding seas: ICON-2I, WRF LaMMA
- Adriatic: ALADIN-HR
- Cyprus: WRF Cyprus
- French overseas territories: Arome Antilles, Arome Guyane, Arome Polynésie, Arome Calédonie, Arome Réunion-Mayotte
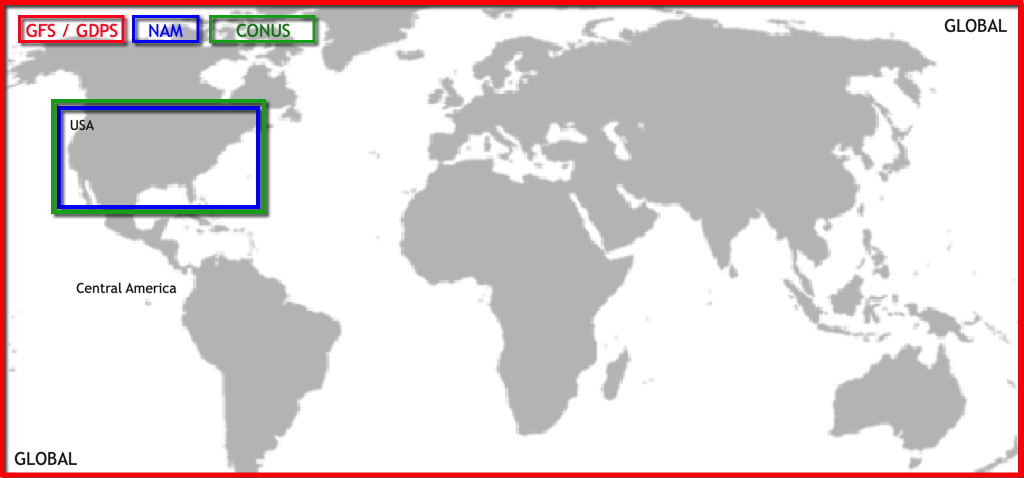
- United States: NAM, HRRR CONUS
Wave models
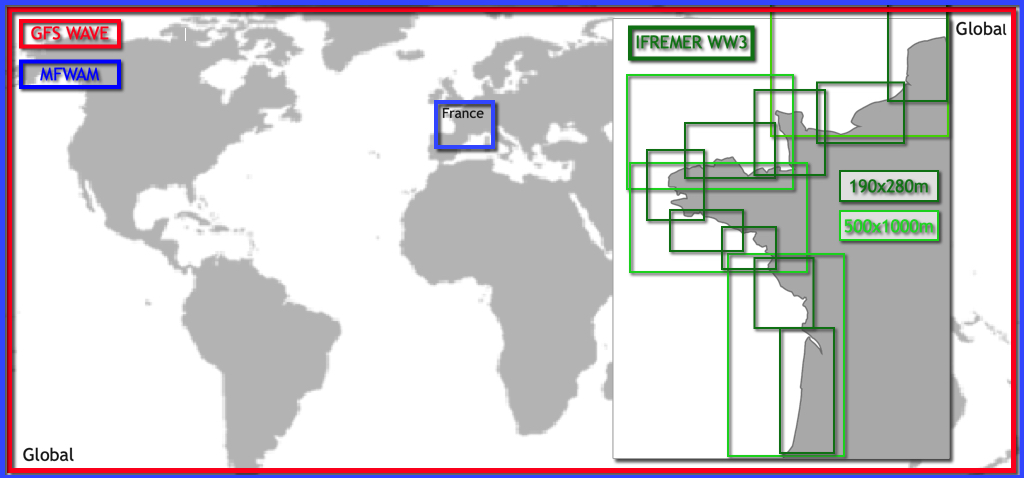
- Coasts of mainland France: MFWAM France
- Channel and French Atlantic coast: IFREMER WW3, 13 areas from 190 m to 500 m
- Mediterranean: Copernicus Med Waves
- North Sea, Baltic, Channel and Celtic Sea: DMI WAM
- Overseas: IFREMER WW3 Antilles, Guadeloupe-Martinique, Martinique, Nouvelle-Calédonie and Réunion
Current models
- Channel and French Atlantic coast: SHOM Manche-Gascogne, IFREMER (8 areas, from 250 m to 3 km)
- North-western Mediterranean: SHOM Méditerranée Nord
- Mediterranean: Copernicus MED
- Iberia, Biscay and Ireland: Copernicus IBI
- European North-West Shelf (North Sea, Channel): Copernicus ENWS
- Baltic: Copernicus BALTIC
- German Bight and Western Baltic: BSH (2 areas)
- Saint Lawrence: MSC Saint Laurent
- US coasts, Caribbean, Hawaii and Alaska: NCOM (5 areas)
All other models (GFS, ECMWF, ICON Global, GDPS, Arpège Monde, GFS Wave, MFWAM Global, Copernicus Global, RTOFS…) are global.
Coverage maps
European atmospheric models
American atmospheric models
Wave models
Current models
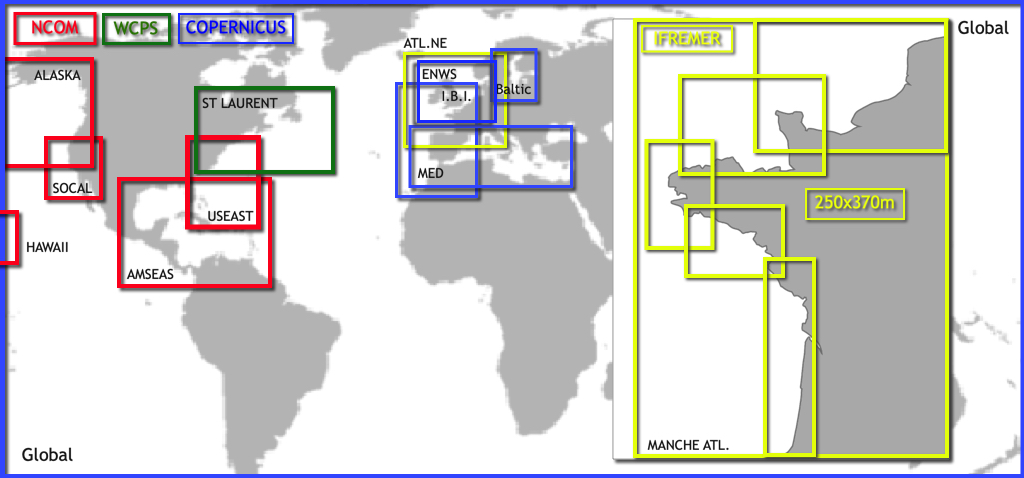
See also: It’s great to have so many models to choose from, but which one should I choose?
Wind Settings
Open Settings by tapping the chevron handle (‹) on the right edge of the screen, then select Forecast display.
- Wind display
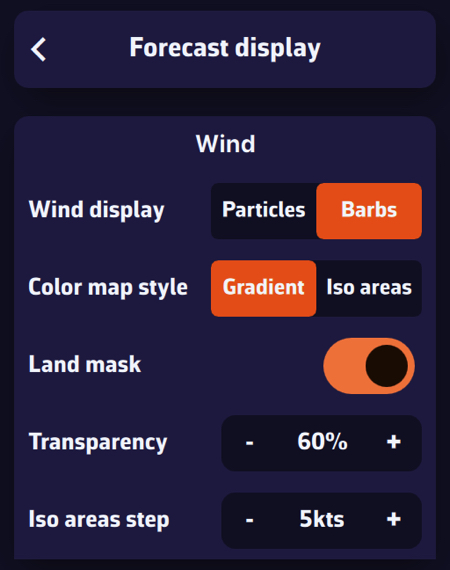
In the Wind section, select Particles or Barbs. Animated particles show the wind flow but consume more system resources and therefore battery: best avoided while sailing. Vectors and barbs are the classic meteorological representation of wind direction and strength. They are placed on the grid points of the GRIB file, further apart when you zoom out, and are more resource-efficient.
Particle density (25 to 300 %, 100 % by default) sets how many particles are shown, and Particle length (25 to 150 %) the length of their trail.
The Gradient style represents wind strength using a rainbow colour scale, from blue (light or calm winds) to magenta (strong winds), through shades of green, yellow, orange and red. Especially suitable for wind data.
The Iso areas style displays the data with the same colours but as bands of equal value. It also suits wave height well.
The Land mask, on by default, hides the colour map and the barbs over land: only the sea is coloured. Turn it off to keep the wind data visible over land too, for instance to keep a continuous sea/land display when sailing among islands. When you zoom in very close (a harbour view or closer), the colour map disappears altogether, sea included.
Transparency allows you to adjust the colour overlay depending on the background (satellite map or nautical chart).
Iso areas step sets the width of the bands of the Iso areas style, in knots.
Energy saving: when this mode is on (Settings, General, Power section), particles are switched off and the chart shows barbs. The Wind display, Particle density and Particle length rows are then greyed out; your choice comes back when you turn the mode off.
Wind Display
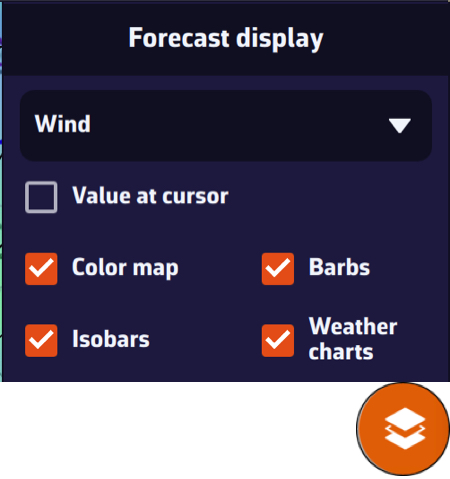
On the map, the round orange layers button at the bottom right of the screen lets you choose what to display.
In the Forecast display section, the drop-down menu allows you to select which data to display. If a weather GRIB (for example an IFS model) is displayed, Wind will be selected by default. You can enable or disable the Color map, the Particles or Barbs (the box is named after the mode set above), and the Isobars (lines of equal atmospheric pressure).
If you have displayed a wave GRIB file, you can enable or disable the Color map and the wave direction Arrows.
This section automatically adapts to the type of GRIB file displayed on the screen: weather, waves, or currents.
By default, when you display an atmospheric GRIB file on the map, wind is shown (barbs or particles, with the colour gradient). But your GRIB file contains many other parameters: precipitation, cloud cover, temperature, pressure, gusts, CAPE, etc.
To change the parameter displayed as a colour overlay on the map:
- Tap the round orange layers button at the bottom right of the screen.
- In the menu that opens, find the Forecast display section.
- Tap the drop-down menu (showing "Wind" by default) to see the parameters contained in the file. For a typical atmospheric GRIB:
- Wind
- Gust
- Delta Gust (if the file contains both wind and gusts)
- Pressure
- Temperature
- Precipitations
- Cloud cover
- CAPE
- Select the desired parameter (e.g. "Precipitations" or "Cloud cover"): the map updates immediately with the corresponding colour gradient.
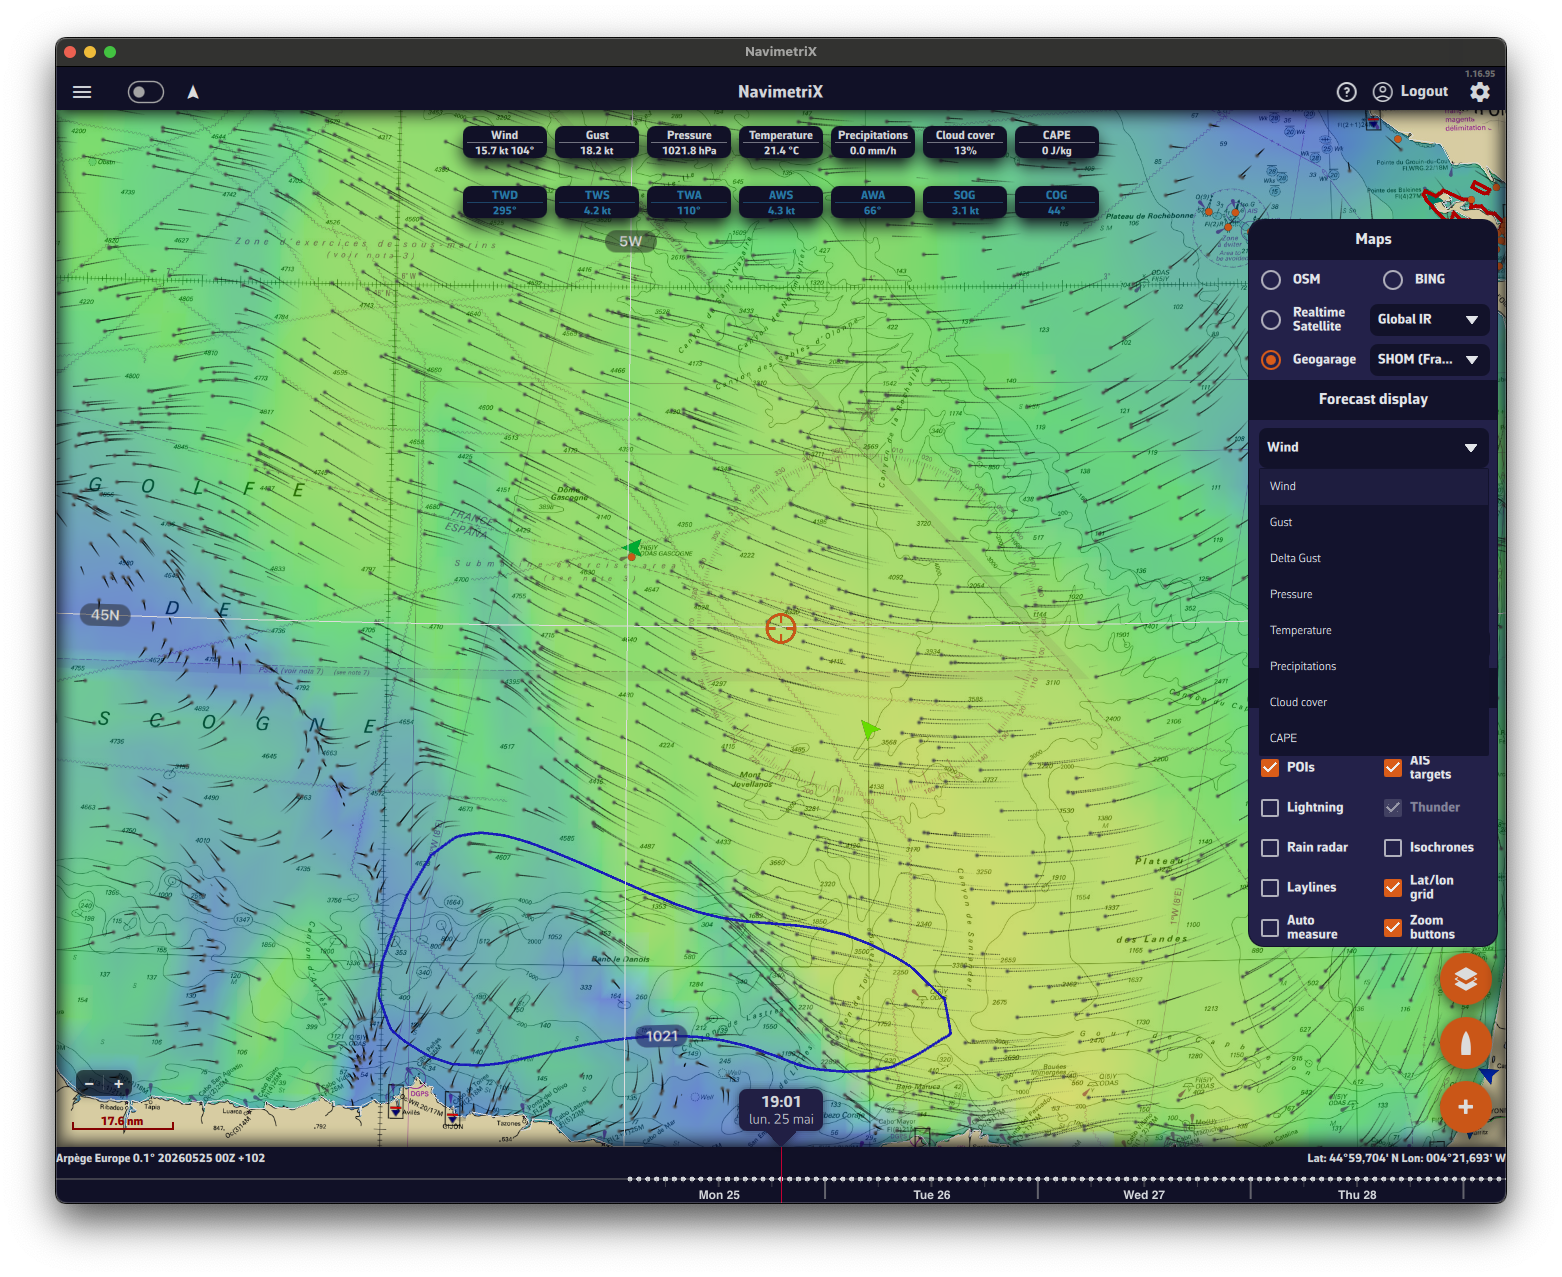
Tip: once the parameter is selected, use the timeline bar at the bottom of the screen to scroll through hours and see how precipitation, cloud cover or any other parameter evolves over the entire area covered by your GRIB file.
Note: for a wave GRIB, the drop-down offers a single entry, Waves. Height, direction and period are shown in the value labels at the top of the screen. See How do I display waves?
The parameters available in the drop-down depend on the data contained in your GRIB file. If you do not see "Precipitations" or "Cloud cover" in the list, make sure you ticked those parameters when downloading the GRIB file.
By default, a tide gauge is displayed on the cartography for each referenced station.
The gauge display can be disabled by opening the layers menu and unticking the Tides box.
The gauges dynamically show, for the current time:
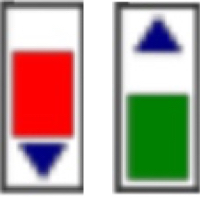
- Rising tide in green
- Falling tide in red
If you have turned on Colorblind-friendly colors (Settings, General, Appearance section), the rising tide turns blue; the falling tide stays red. The arrow on each gauge also shows the direction.
Tapping on each gauge opens a tide graph showing the tide curve and the current water level, represented by the vertical timeline.
The graph is topped by a table showing the times, water heights and tidal coefficients for the day.
Tapping/clicking on the date above the table opens the calendar, allowing you to select another day/month. You can also move from one day to the next by swiping the table or the graph horizontally: to the left for the next day, to the right for the previous day.
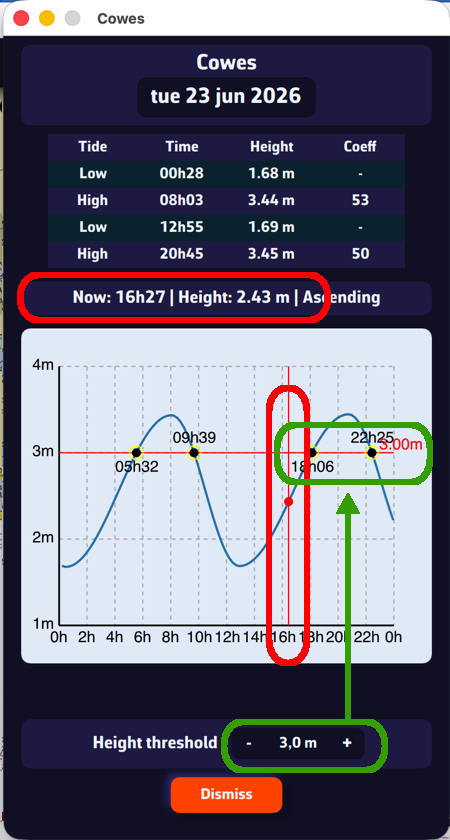
Below the graph, set the Height threshold with the - and + buttons. The threshold line moves on the graph and tells you:
- What the water level will be at a given time.
- What time a given threshold will be reached.
The timeline at the bottom of the screen lets you move through time. It only appears when there is time-stamped data to browse:
- a displayed GRIB file;
- a visible routing;
- the current atlas (Current atlases box in the layers menu);
- the rain radar.
If it has disappeared, there are two possible causes.
1. You collapsed it
A small chevron handle, on the top edge of the timeline to the right of the time bubble, collapses the timeline and opens it again. Once the timeline is collapsed, the handle stays visible at the bottom of the screen: tap it to bring the timeline back. This choice is remembered on the device, even after restarting the app.
On a phone held in landscape, the timeline becomes a column on the side of the screen; its handle then sits against that column.
2. No GRIB is displayed
Without a visible routing, the current atlas or the rain radar, the timeline only appears when a GRIB is displayed. Tapping the GRIB that is already displayed in the list deselects it: the chart no longer shows a forecast and the timeline disappears.
To fix this, open the left panel with the chevron handle (›) on the left edge of the screen, choose the GRIBs tab and tap a file to display it, or download one.
See also: How do I download a GRIB file?
Tapping the time bubble above the timeline cursor normally brings the chart back to the current time. If nothing happens, the displayed GRIB is probably too old: it does not contain “now”.
The timeline only covers the period of the displayed data: that of the GRIB, extended where relevant to that of the visible routings. If only a GRIB is displayed, the timeline ends with the last day of that GRIB, and the cursor cannot go beyond it.
For example, it is 16 October and I am looking at an Arome GRIB file from 11 October. This model only holds 51 hours of forecast: the file ends on 13 October, so it does not contain the current time.
What can I do? Update the GRIB with the refresh button on its row in the GRIBs tab, or download a recent one.
Special case: if the current atlas or the rain radar is displayed, the timeline extends to today (unless the GRIB ended more than 2 days ago). The cursor then does reach the current time, but the GRIB has no forecast for that time: the solution is the same.
NavimetriX offers several high-resolution regional models for popular sailing destinations worldwide, in addition to global models such as GFS, ECMWF and ICON Global. Regional models require the Premium option.
North America
NAM (11 km resolution): NOAA's North American Mesoscale model covers the continental United States. Forecasts up to 84 hours with hourly time steps. Ideal for coastal sailing along the US East Coast, West Coast and Gulf of Mexico.
HRRR CONUS (3 km resolution): the High-Resolution Rapid Refresh model provides the finest resolution available for the continental US. Forecasts up to 18 hours, updated every hour. Perfect for racing and for catching fast-changing conditions such as sea breezes and thunderstorms.
Caribbean & South America
Arome Antilles (3 km resolution): Météo-France model covering the Lesser Antilles from Puerto Rico to Trinidad. Forecasts up to 42 hours. Excellent for inter-island passages and for spotting trade wind variations.
Arome Guyane (3 km resolution): covers the waters off French Guiana and the nearby South American coast. Forecasts up to 33 hours. Useful for sailors in transit between the Caribbean and Brazil.
Pacific Islands
Arome Polynésie (3 km resolution): covers French Polynesia, including Tahiti and the Society Islands. Forecasts up to 42 hours. Ideal for spotting local effects around the high volcanic islands and the reef passes.
Arome Calédonie (3 km resolution): covers New Caledonia and the Coral Sea. Forecasts up to 42 hours. Essential for sailing in the lagoon and anticipating thermal effects around Grande Terre.
Indian Ocean
Arome Réunion-Mayotte (3 km resolution): covers the western Indian Ocean from the Mozambique Channel to the Mascarene Islands, including Madagascar, Réunion, Mauritius and Mayotte. Forecasts up to 42 hours. Essential in this cyclone-prone region.
NavimetriX gives access to over 90 weather, wave and current models (resolutions included) from the main meteorological and oceanographic agencies worldwide. Without the Premium option, only GFS models are offered.
The list grows as models are added: the Models Status page shows every model available today and the time of its latest run.
🌍 Atmospheric models: Global
| Model | Provider | Area | Resolution | Range |
|---|---|---|---|---|
| GFS | NOAA | World | 28 to 222 km | 16 days |
| AIGFS | NOAA | World | 28 km | 16 days |
| ECMWF IFS | ECMWF | World | 9 to 111 km | 15 days |
| ECMWF AIFS | ECMWF | World | 28 to 111 km | 15 days |
| ICON Global | DWD | World | 14 to 111 km | 5 days |
| Arpège Monde | Météo-France | World | 28 km | 102 h |
| GDPS (GEM) | CMC (Canada) | World | 17 km | 10 days |
🇪🇺 Atmospheric models: Europe
| Model | Provider | Area | Resolution | Range |
|---|---|---|---|---|
| Arpège Europe | Météo-France | Europe | 11 km | 102 h |
| Arome | Météo-France | France and neighbouring countries | 3 km | 51 h |
| Arome HD | Météo-France | France and neighbouring countries | 1 km | 51 h |
| ICON Europe | DWD | Europe | 8 km | 5 days |
| ICON D2 | DWD | Germany and neighbouring countries | 2 km | 48 h |
| UKV | Met Office | British Isles | 2 km | 5 days |
| HARMONIE | KNMI | Netherlands | 2 km | 60 h |
| MET Nordic | MET Norway | Scandinavia, Baltic | 1 km | 58 h |
| ICON-2I | ItaliaMeteo | Italy | 2 km | 72 h |
| WRF LaMMA | ItaliaMeteo-CIMA-LaMMA | Italy | 1.5 km | 72 h |
| ALADIN-HR | DHMZ | Adriatic | 2 km | 72 h |
| WRF Cyprus | DoM Cyprus | Cyprus | 3 km | 5 days |
🌎 Atmospheric models: Americas
| Model | Provider | Area | Resolution | Range |
|---|---|---|---|---|
| NAM | NOAA | United States | 11 km | 84 h |
| HRRR CONUS | NOAA | United States | 3 km | 18 h |
| Arome Antilles | Météo-France | Lesser Antilles | 3 km | 42 h |
| Arome Guyane | Météo-France | French Guiana | 3 km | 33 h |
🌏 Atmospheric models: Pacific and Indian Ocean
| Model | Provider | Area | Resolution | Range |
|---|---|---|---|---|
| Arome Polynésie | Météo-France | French Polynesia | 3 km | 42 h |
| Arome Calédonie | Météo-France | New Caledonia | 3 km | 42 h |
| Arome Réunion-Mayotte | Météo-France | Réunion, Mayotte, Madagascar | 3 km | 42 h |
🎲 Ensemble models
| Model | Provider | Area | Resolution | Range |
|---|---|---|---|---|
| GEFS (31 members) | NOAA | World | 55 km | 30 days |
| ECMWF IFS ENS (51 members) | ECMWF | World | 28 km | 15 days |
🛰️ Observations
| Model | Provider | Area | Resolution | Range |
|---|---|---|---|---|
| ASCAT | EUMETSAT OSI SAF / KNMI | World | 0.125° | last 15 hours |
🌊 Wave models (sea state)
| Model | Provider | Area | Resolution | Range |
|---|---|---|---|---|
| GFS Wave | NOAA | World | 28 to 111 km | 16 days |
| ECMWF Wave | ECMWF | World | 28 km | 15 days |
| MFWAM Global | Météo-France | World | 11 to 56 km | 102 h |
| Copernicus Global Waves | Copernicus | World | 9 km | 8 days |
| MFWAM France | Météo-France | Coasts of mainland France | 3 km | 42 h |
| Copernicus Med Waves | Copernicus | Mediterranean | 4 km | 8 days |
| DMI WAM | DMI | North Sea, Baltic, Channel | 5 km | 132 h |
| IFREMER WW3 | Ifremer | Channel and French Atlantic coast (13 areas) | 190 to 500 m | 100 h |
| IFREMER WW3 | Ifremer | Antilles, New Caledonia, Réunion (5 areas) | 180 m to 5 km | 99 h |
🔵 Ocean current models: Global
| Model | Provider | Area | Resolution | Range |
|---|---|---|---|---|
| Copernicus Global ocean currents only (daily mean) | Copernicus | World | 9 km | 5 days |
| RTOFS Global | NOAA | World | 9 km | 8 days |
🔵 Tidal current models: Global
| Model | Provider | Area | Resolution | Range |
|---|---|---|---|---|
| Copernicus Global SMOC | Copernicus | World | 9 to 56 km | 5 days |
🔵 Tidal current models: Europe
| Model | Provider | Area | Resolution | Range |
|---|---|---|---|---|
| Copernicus IBI | Copernicus | Iberia, Biscay, Ireland | 3 km | 5 days |
| Copernicus ENWS | Copernicus | North Sea, North-West European Shelf | 1.5 km | 5 days |
| Copernicus BALTIC | Copernicus | Baltic | 4 km | 5 days |
| Copernicus MED | Copernicus | Mediterranean | 5 km | 5 days |
| SHOM Manche-Gascogne | SHOM | Channel and Bay of Biscay | 2 km | 5 days |
| SHOM Méditerranée Nord | SHOM | North-western Mediterranean | 2 km | 5 days |
| BSH | BSH | German Bight, Western Baltic (2 areas) | 900 m | 72 h |
| IFREMER | Ifremer | Channel and French Atlantic coast (8 areas) | 250 m to 3 km | 96 to 100 h |
🔵 Tidal current models: Americas
| Model | Provider | Area | Resolution | Range |
|---|---|---|---|---|
| MSC Saint Laurent | MSC | Saint Lawrence, Atlantic Canada | 930 m | 84 h |
| NCOM Alaska - N. Calif | NCOM | Alaska to Northern California | 4 km | 90 h |
| NCOM Caribbean | NCOM | Gulf of Mexico and Caribbean | 3 km | 90 h |
| NCOM Hawaii | NCOM | Hawaii | 4 km | 90 h |
| NCOM South California | NCOM | Southern California | 4 km | 90 h |
| NCOM US East Coast | NCOM | US East Coast | 4 km | 90 h |
To rename a GRIB file, in the GRIBs tab, do a long click or long press on its name: the name becomes editable and the keyboard appears.
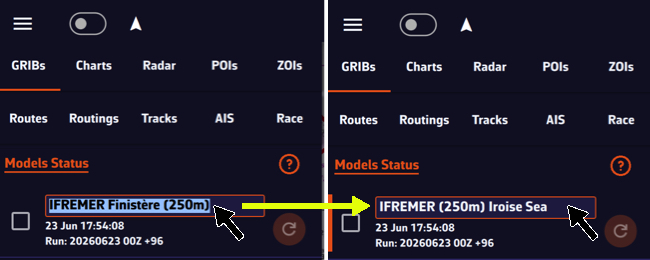
You can also tap the row’s ⋮ button, then Rename: the Rename GRIB window opens.
The name will be preserved during updates and synchronization. An empty name gives the file back the model’s name.
GRIBs downloaded with the magic wand (Suggested models) can also get a Zone name (8 characters at most), shown in front of the model name as long as you do not rename them.
Check our real-time model status page by following this link:
In the app, the Models Status link at the top of the GRIBs tab of the left panel opens the same page.
For each model it shows the current run, when it was published and the estimated time of the next run. It also offers a timeline of the runs received over the last 24 hours (24h Timeline) and a coverage map of the regional models (Coverage map).
How to Read Marine Weather Charts (Surface Analysis Charts)
Surface analysis charts are essential tools for any sailor. They provide a synoptic view of current weather conditions and help anticipate weather changes. This guide explains how to interpret the symbols and information on these charts.
What is a Surface Analysis Chart?
A Surface Analysis Chart is a representation of weather conditions at the Earth's surface at a given time. These charts are produced by national weather services such as NOAA (USA), the Met Office (UK), or Météo-France.
They use a combination of lines, symbols, and color codes to represent:
- Pressure systems (highs and lows)
- Weather fronts
- Isobars (lines of equal pressure)
- Weather station observations
- Precipitation areas
Pressure Systems: Highs (H) and Lows (L)
Pressure systems are the main drivers of weather. They are indicated by the letters H (High pressure) and L (Low pressure).
High Pressure (H) - Anticyclone
H
Symbol: H (blue) with central pressure in millibars (e.g., 1035)
Characteristics: Air descends and spreads out, creating divergent winds. Clockwise rotation (Northern Hemisphere).
Associated weather: Generally stable conditions, clear skies, light to moderate winds, good visibility.
Low Pressure (L) - Depression
L
Symbol: L (red) with central pressure in millibars (e.g., 995)
Characteristics: Air converges toward the center and rises, creating clouds. Counter-clockwise rotation (Northern Hemisphere).
Associated weather: Unsettled weather, clouds, precipitation, strong winds. The lower the pressure, the more intense the storm.
💡 Navigation tip: A low with pressure below 980 mb is considered deep. NOAA charts sometimes indicate "GALE" (34-47 knots), "STORM" (48-63 knots), or "HURRICANE FORCE" (≥64 knots) near intense lows.
Isobars: Lines of Equal Pressure
Isobars are the thin lines connecting points of equal atmospheric pressure. They are typically spaced 4 millibars apart (1008, 1012, 1016, 1020 mb, etc.).
Key rule: Isobar spacing indicates wind strength:
| Closely spaced isobars | → | Strong gradient = Strong winds |
| Widely spaced isobars | → | Weak gradient = Light winds |
💡 Buys-Ballot's Law: In the Northern Hemisphere, if you stand with your back to the wind, low pressure is always on your left. Wind blows parallel to isobars (with a slight angle toward low pressure due to friction).
Weather Fronts
Fronts are boundaries between different air masses. Their passage typically brings significant changes in temperature, wind direction, and weather conditions.
Cold Front

Symbol: Blue line with triangles pointing in the direction of movement
Description: Cold air mass pushing into warm air. Cold fronts move faster (25-30 knots) because the denser cold air undercuts the warm air.
Weather at passage: Thunderstorms or intense but brief showers, rapid wind shift (SW → NW), sharp temperature drop, quick clearing after passage.
Warm Front

Symbol: Red line with half-circles pointing in the direction of movement
Description: Warm air mass sliding over cold air. Slower (10-15 knots) because warm air must ride up over cold air.
Weather at passage: Prolonged steady precipitation, stratiform clouds (cirrus → altostratus → nimbostratus), reduced visibility, possible fog, gradual temperature rise.
Stationary Front
Symbol: Alternating blue triangles and red half-circles on opposite sides of the line
Description: Two air masses that aren't moving relative to each other. Can persist for several days.
Associated weather: Prolonged overcast conditions, persistent precipitation over the area, stagnant conditions.
Occluded Front
Symbol: Purple line with alternating triangles and half-circles on the same side
Description: The faster cold front catches up to the warm front. Warm air is lifted aloft.
Associated weather: Mixed conditions, varied precipitation. Significance: The low is reaching maturity and beginning to weaken.
Other Boundaries
Trough
Symbol: Brown/orange dashed line in a U or V shape, often marked "TROF"
Description: Elongated area of relatively low pressure, without being a true front.
Associated weather: Atmospheric instability, wind convergence, risk of thunderstorms or unsettled weather.
Squall Line
Symbol: Line with two red dots, often marked "SQLN"
Description: Organized line of thunderstorms, often located ahead of a cold front.
⚠️ DANGER: Violent winds, possible hail, destructive gusts. Potentially dangerous conditions for navigation!
Dry Line

Symbol: Orange/brown line with half-circles pointing toward moist air
Description: Boundary between dry continental air and moist maritime air (common in the US between Gulf of Mexico air and Southwest desert air).
Associated weather: Violent thunderstorm development along the line, especially in spring/summer.
Tropical wave
Symbol: Wide dotted red line.
Description: Rainy and stormy front moving from east to west in the intertropical zone. Frequent during the hurricane season between Africa and the Caribbean.
Associated weather: Squalls, sometimes intense, which can develop into tropical storms and then hurricanes as they progress.
📥 Complete reference: Official WPC/NOAA Front Legend
Weather Station Observations (Station Plots)
Detailed charts display weather station observations as station plots. These compact symbols summarize a lot of information at a glance.
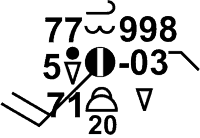
Station Plot Elements
| Position | Information |
|---|---|
| Center | Cloud cover (● overcast, ◐ partly cloudy, ○ clear) |
| Upper left | Temperature (°F or °C) |
| Lower left | Dew point |
| Right | Pressure (last 3 digits: 218 = 1021.8 mb) |
| Extending line | Wind direction (where it's coming from) |
| Barbs | Wind speed (see below) |
Reading Wind Barbs
Wind barbs indicate wind speed. Add the symbols together to get the total speed:

💡 Example: 1 pennant + 2 full barbs + 1 half barb = 50 + 20 + 5 = 75 knots
Precipitation Symbols
| Symbol | Description |
|---|---|
 | Rain (more dots = heavier) |
 | Snow |
 | Drizzle |
 | Showers |
 | Thunderstorm |
 | Fog |
📥 Download: Complete Weather Symbol Guide (PDF) - NOAA
Understanding "Ahead" and "Behind" a Front
These terms refer to front movement, not geographic direction:
| Term | Meaning | Example (Cold Front) |
|---|---|---|
| Ahead of the front | In front of the frontal movement | In the warm air mass |
| Behind the front | After the front has passed | In the cold air mass |
💡 Practical application: If a forecast says "showers behind the cold front," expect precipitation AFTER the front passes through your location.
Common Units
| Measurement | Unit | Conversion |
|---|---|---|
| Pressure | millibars (mb) or hectopascals (hPa) | 1 mb = 1 hPa = 0.0295 inHg |
| Wind speed | knots (kt) | 1 kt = 1.15 mph = 1.85 km/h |
| Temperature | °F (US) or °C (international) | °C = (°F - 32) × 5/9 |
Chart Sources
NavimetriX collects charts from the following official sources (Charts tab of the left panel):
| Source | Coverage | Forecast range |
|---|---|---|
| NOAA (Ocean Prediction Center and National Weather Service radiofax) | North Atlantic, tropical Atlantic, North Pacific, central Pacific | Analysis, 24 h and 48 h; up to 72 h or 96 h for some black and white charts |
| Met Office | Europe, North-East Atlantic | Analysis and forecasts up to 120 h |
| BOM | Australia, Indian Ocean, South Pacific | Analysis |
| Marinha do Brasil | South Atlantic | Analysis |
| USF (University of South Florida) | Eastern Caribbean | Sargassum density map |
Technical References
Official documentation:
- NOAA Unified Surface Analysis Manual (PDF) - Complete 33-page technical reference
- NOAA JetStream - Surface Weather Maps - Official NOAA online tutorial
- WPC Front Codes - Official front symbol reference
Additional learning resources:
- How to read Surface Weather Maps (NOAA JetStream) - Official NOAA guide with illustrations
- Surface Weather Plots (NOAA JetStream) - Station plot details
The SHOM Tidal Current Atlas can be used for routing, in addition to GRIB format models (¹): in the routing window (+ button, then Calculate Routing), choose SHOM atlases on the Current line.
The Atlas data can also be displayed on the chart, as particles or arrows.
Tap or click the round orange layers button, then tick Current atlases:
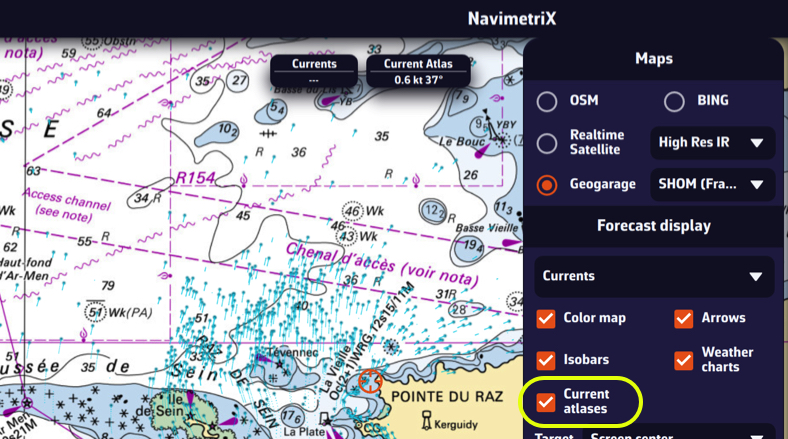
The choice between particles and arrows, and the density, are set in Settings (chevron handle (‹) on the right edge of the screen), Forecast display, Currents section: Currents display and Particle density. These settings apply to the atlas as well as to GRIB currents.
You can overlay this display with a high-resolution GRIB from Ifremer, for example, in order to compare them by dragging the timeline:
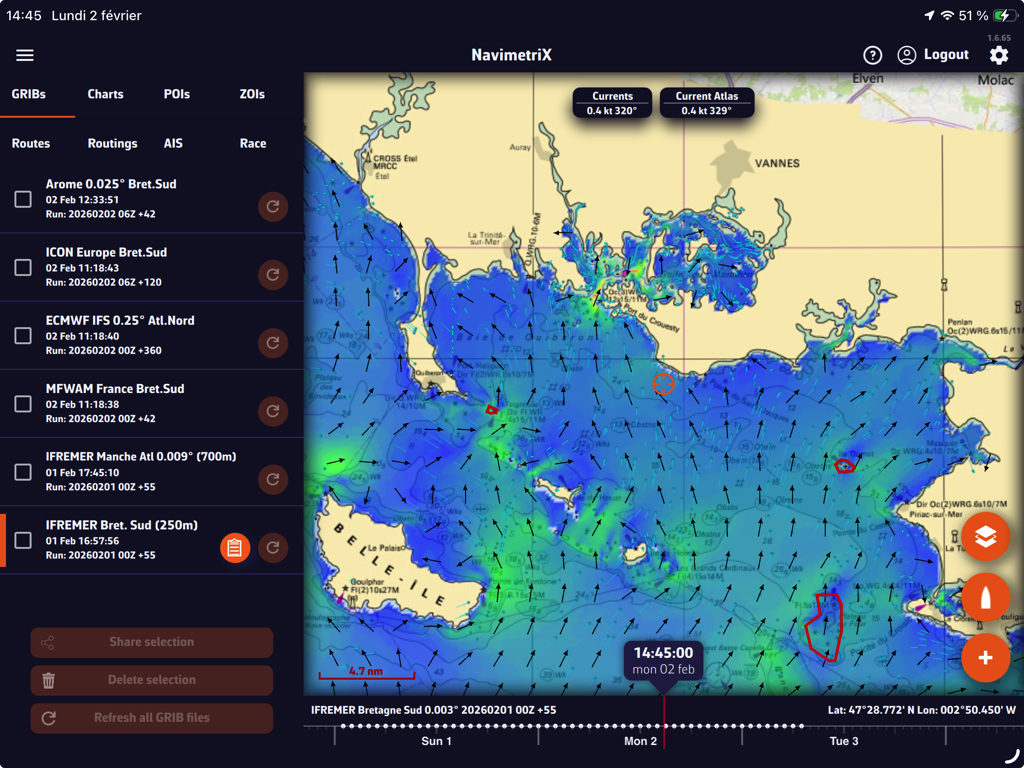
Tip: adjust the zoom according to the circumstances for better readability.
(¹) See: How do I calculate a routing?
Numerous weather surface analysis maps, also known as isobaric or fronts maps, are available in the application to supplement GRIB files and facilitate the interpretation of weather situations and forecasts.
These charts come from various meteorological agencies and are produced by forecasters: NOAA (USA), Met Office (UK), BOM (Australia), Marinha do Brasil (Brazil). A special chart for observing Sargassum off the coast of the Caribbean is also provided by USF (University of South Florida). All are stored on our own servers.
Open the left panel with the chevron handle (›) on the left edge of the screen, then select the Charts tab.
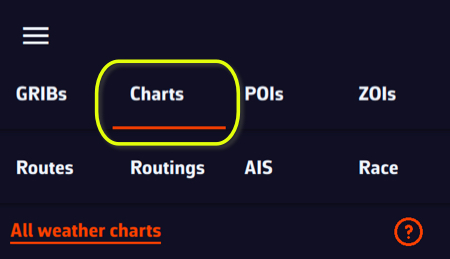
The chart list is dynamic: it only offers the charts that cover the centre of the screen. Move the map to see those of another region. The All weather charts link at the top of the tab opens the full list on our website.
Displaying NOAA weather maps
NOAA maps range from the current analysis up to 48-hour forecasts in colour. A few black and white charts go further: 72 hours for the tropical Atlantic and the central Pacific, 96 hours for the North Atlantic and the North-West Pacific.
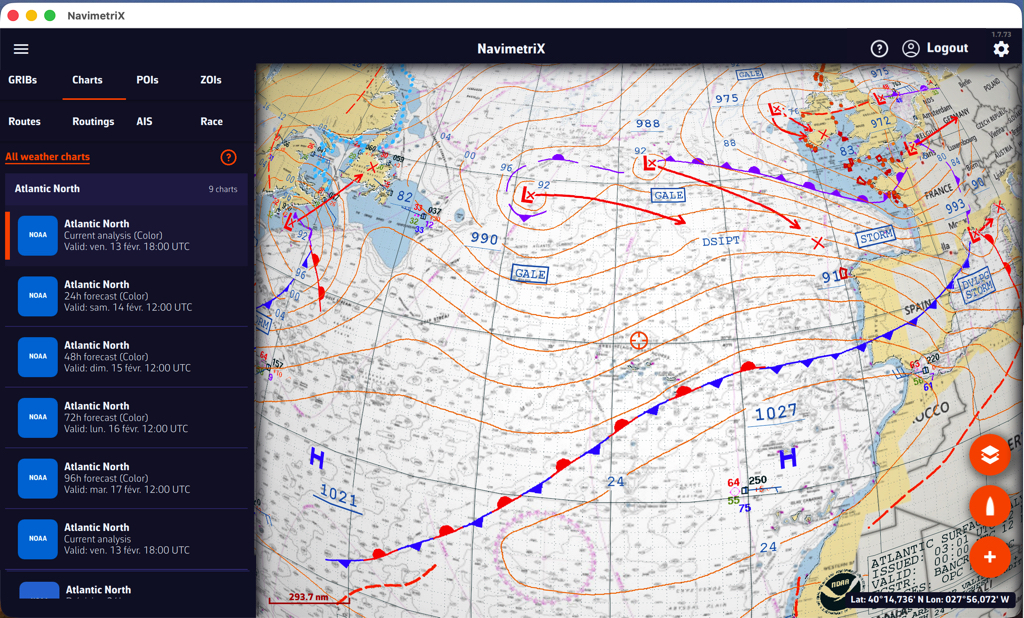
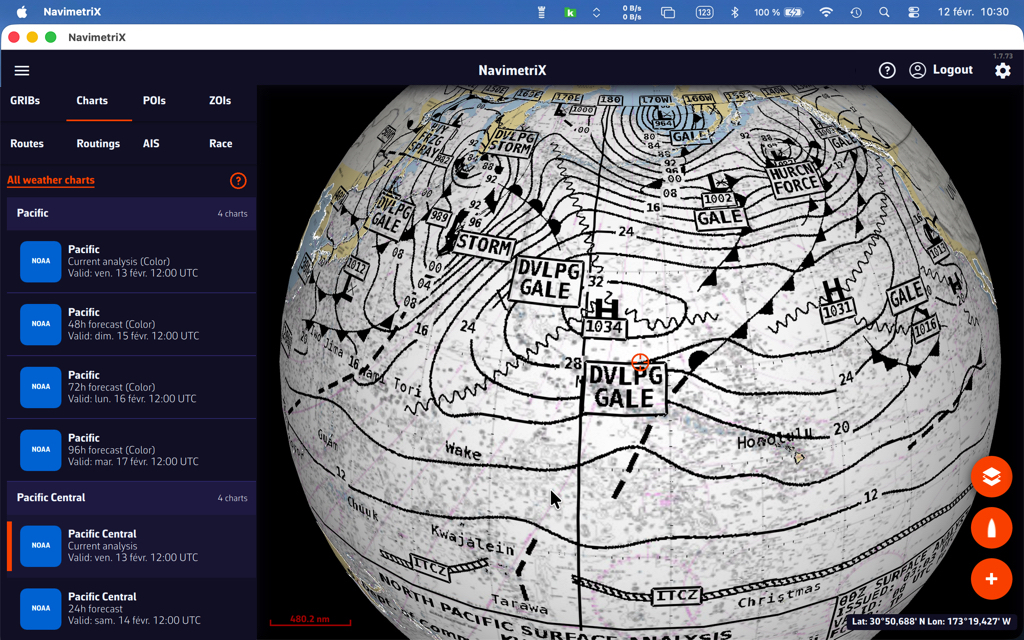
Overlaying NOAA weather maps with GRIBs
Overlaying the NOAA map with the GFS file provides additional insight with the drawing of fronts and specific annotations.
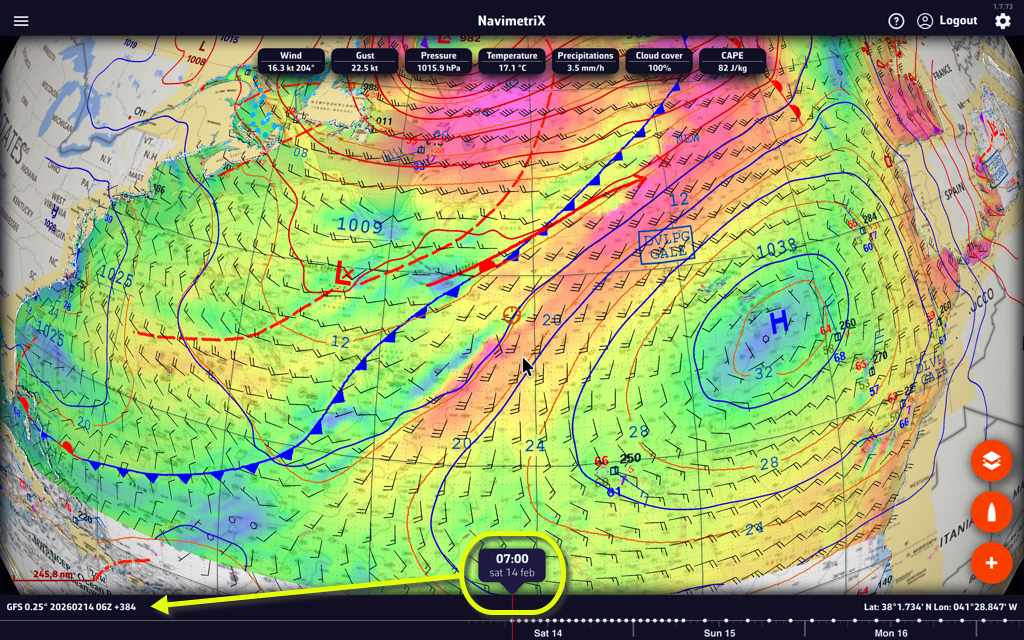
Displaying Met Office and BOM weather maps
Met Office maps are not in a format that allows them to be overlaid on the nautical chart in 3D. They are therefore displayed in their original format, in colour or black and white. They only cover the North-East Atlantic and Europe. They range from the current analysis up to 5-day forecasts.
BOM analysis charts (Indian Ocean, South Pacific, Australia) open the same way, in their original format.
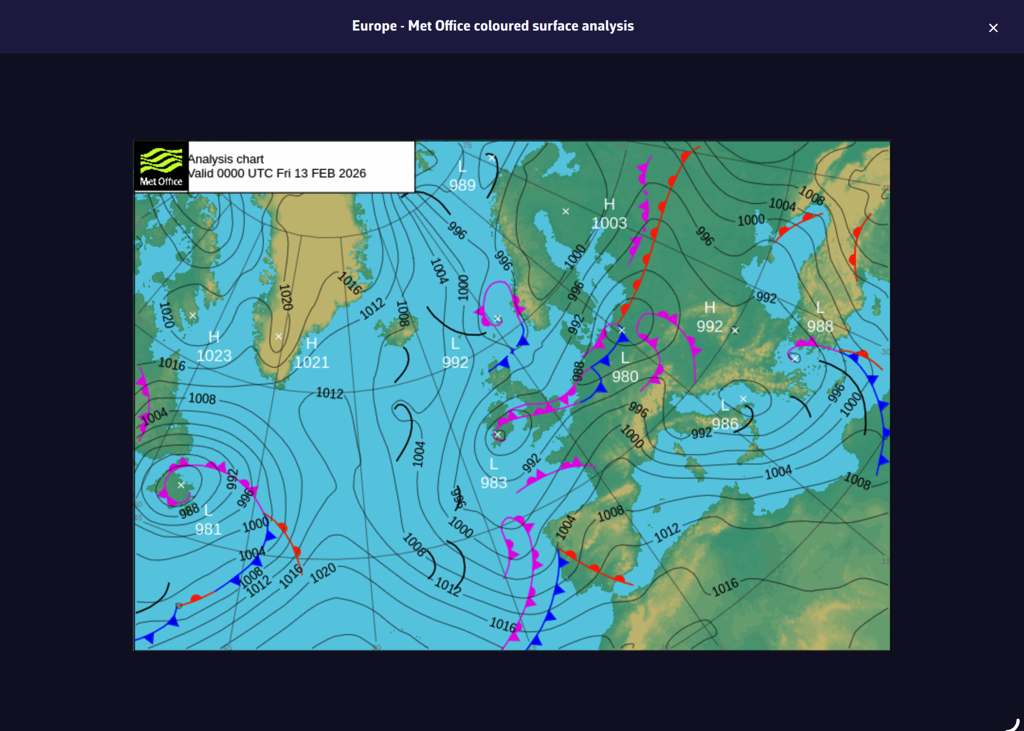
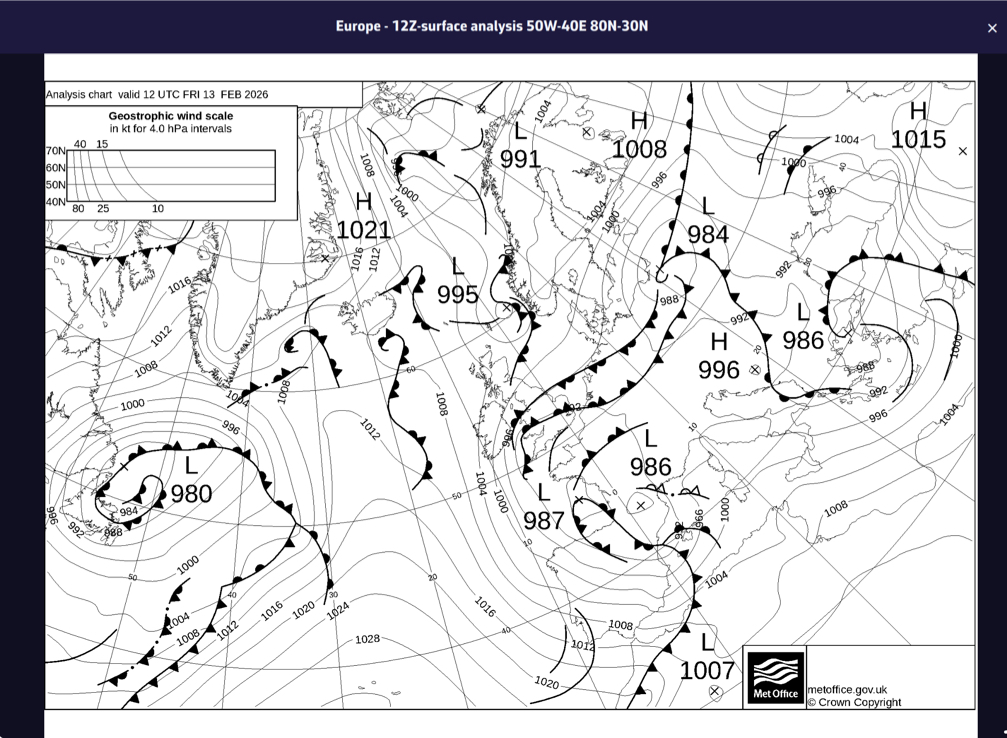
The South Atlantic
The Marinha do Brasil surface analysis covers the South Atlantic, from 90W to the Greenwich meridian and from 20N to 70S. It is displayed on the nautical chart like the NOAA charts.
Sargassum map
Published by the USF, the sargassum density map covers the eastern Caribbean, from 63W to 39W and from 10N to 22N. It is updated daily. It is mainly of interest for crossings to the West Indies.
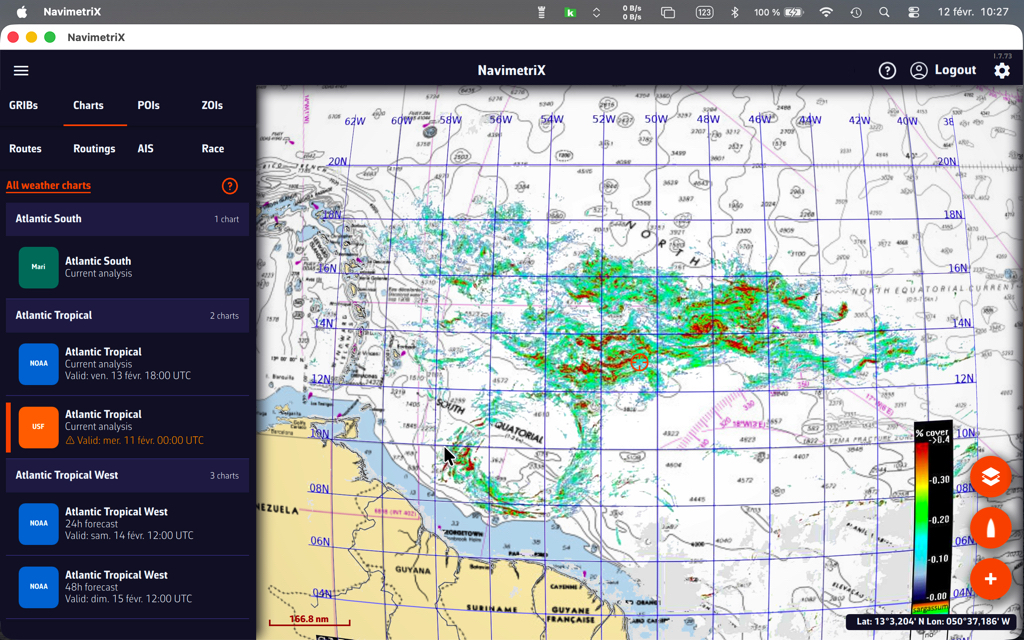
Satellite images
Three types of satellite images are available, covering the entire world. They are taken from different weather satellites and provide a near real-time view of cloud cover.
Tap or click the round orange layers button and tick Realtime Satellite in the Maps section.
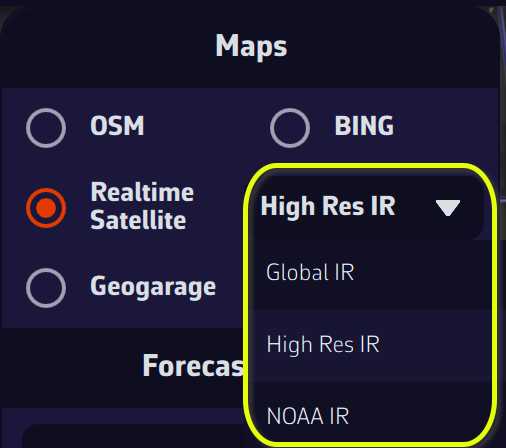
High Res IR, Global IR, and NOAA IR are combinations of infrared images that show cloud cover. By combining a satellite image and an isobaric map, you can obtain an instant view of weather conditions.
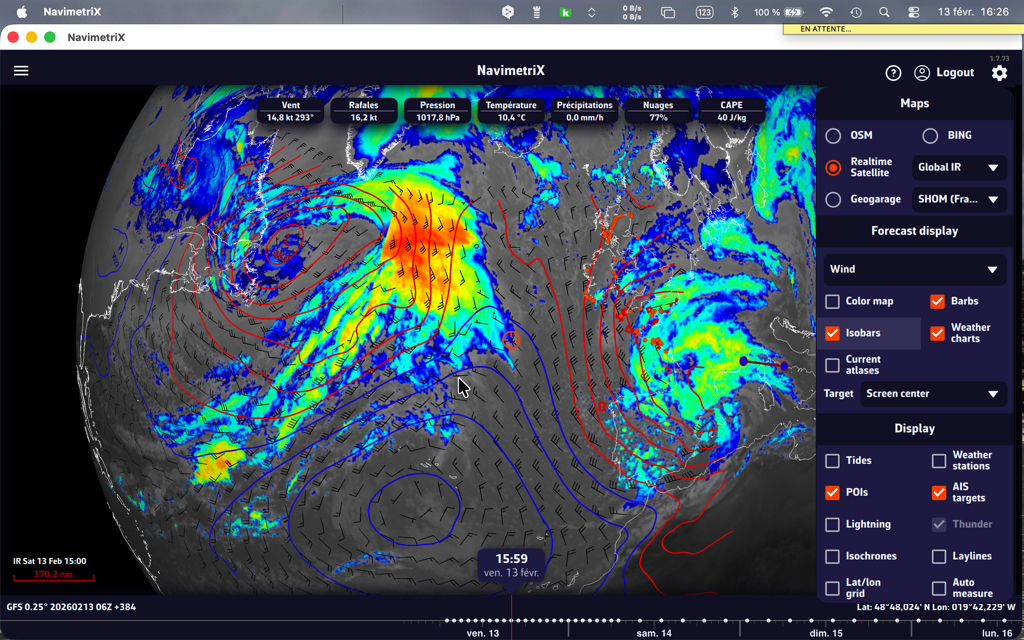
You can also add thunder and lightning displays!
The colour coding of precipitation totals on radar images follows the scale below (source: Météo-France):

For information on interpreting frontology (isobaric) maps, see this FAQ: How to read marine weather maps.
“In-situ” weather stations provide instant weather readings that allow you to compare this data with weather model forecasts. These stations can be semaphores along the coastline, fixed or floating buoys at sea, accredited ships, airports on land, or weather satellites.
How to display them?
Tap or click the round orange layers button and tick the Weather stations box in the Display section.
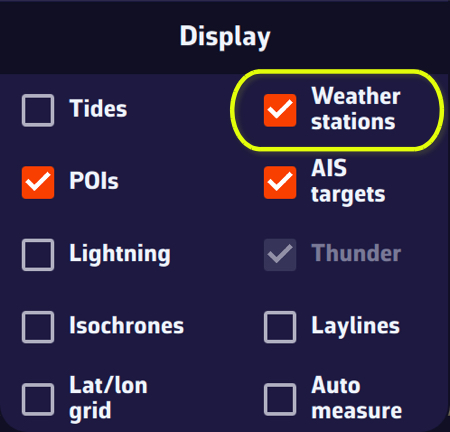
The stations are represented by an “arrowhead” symbol that takes the orientation of the “wind direction” data and the colorimetry of the “wind strength.”
Tapping/clicking on a symbol opens a window displaying the characteristics of the station and the most recent data values.
Station types and their info data
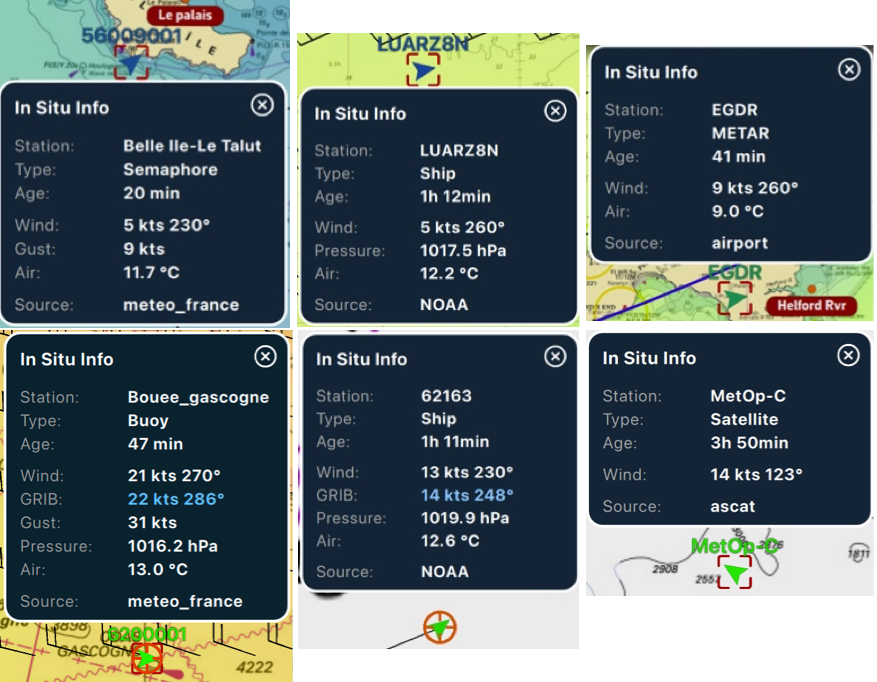
If the time of the information is within the coverage period of the displayed GRIB file, then tapping/clicking in the center of the popup centers the map on the station's coordinates and returns the timeline to the exact time of the station, allowing you to compare the data value and the GRIB file forecast.
Setting the weather data display in NavimetriX
Open Settings by tapping the chevron handle (‹) on the right edge of the screen, then select Forecast display. The page has nine sections: Wind, Pressure, Currents, Waves, Precipitations, Temperature, Cloud cover, CAPE and Lightning.
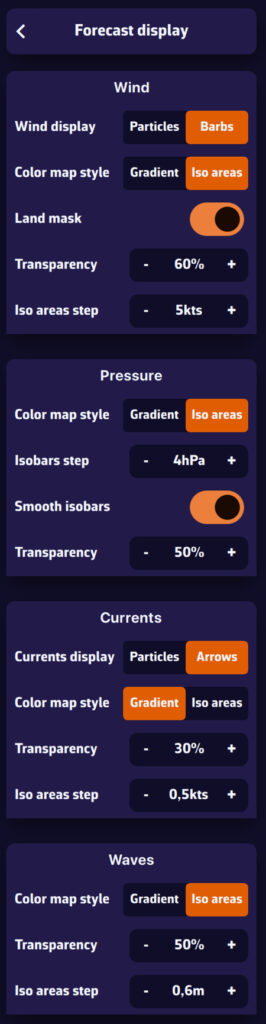
These settings define how the data is drawn. Which data is shown (wind, pressure, rain…) and which layers are visible (Color map, Barbs or Arrows, Isobars) is chosen in the menu of the round orange layers button, Forecast display section.
Wind
- Wind display: Particles (small animated particles following the flow, very telling but heavier on the battery) or Barbs (the classic display of wind direction and strength).
- Particle density: from 25 to 300 % (100 % by default).
- Particle length: from 25 to 150 % (100 % by default), the length of each particle's trail.
- Color map style: Gradient (continuous colour variation with wind strength) or Iso areas (colour bands, e.g. 5-10 knots, 10-15 knots).
- Land mask: on by default, it hides the colour map and the barbs over land so that only the sea shows. When off, the wind data stays visible over land. When you zoom in very close (a harbour view or closer), the colour map disappears altogether, sea included.
- Transparency: how visible the colour map is over the chart.
- Iso areas step: the width of the wind bands in knots, for the Iso areas style.
Pressure
- Color map style: Gradient or Iso areas (colour bands by pressure range).
- Isobars step: the interval between two isobars, from 1 to 5 hPa (2 hPa by default).
- Smooth isobars: on by default, it rounds off the isobar lines.
- Transparency: how visible the colour map is.
The isobars themselves (the lines) are shown by ticking Isobars in the layers menu.
Currents
- Currents display: animated Particles or Arrows showing current direction and strength.
- Particle density: from 25 to 300 %. It also applies to the SHOM current atlases, as particles or as arrows.
- Particle length: from 25 to 150 %.
- Color map style, Transparency and Iso areas step (in knots): as for the wind.
- Speed values: shows the current speed next to the arrows when you zoom in close (a harbour view or closer).
Waves
- Color map style: Gradient or Iso areas for wave height.
- Transparency: how visible the colour map is.
- Iso areas step: the width of the height bands, in metres.
Wave direction is shown by arrows, ticked in the layers menu (Arrows box). See How do I display waves?
Precipitations, Temperature, Cloud cover, CAPE
Each of these sections offers a Transparency setting for the colour map.
Lightning
- Max strikes: from 100 to 1,000 strikes displayed (500 by default).
- Max age: from 10 to 120 minutes (60 by default); older strikes disappear.
Energy saving mode
When Energy saving is on (Settings, General, Power section), wind and current particles are switched off: the chart draws barbs and arrows. The Wind display, Currents display and Particle length rows, and the wind particle density, are then greyed out. Your choice is kept and comes back as soon as you turn energy saving off.
Tip: use particles or iso areas for a better reading of large-scale conditions. At sea, prefer barbs and isobars, which are more precise and use fewer resources.
You check the weather forecast before setting sail: southwesterly wind 15 knots, slight sea. Perfect. But how reliable is this forecast? Could it just as easily be 10 knots… or 25? This is exactly the question that an ensemble model answers.
One forecast is good. Thirty-one is better.
A standard weather model such as the GFS produces a single forecast: the best available estimate of the future atmosphere. The problem is that the atmosphere is chaotic: tiny differences in initial conditions can lead to very different outcomes a few days later.
An ensemble model such as NOAA's GEFS (Global Ensemble Forecast System) takes a radically different approach. Instead of running a single simulation, it runs 31 in parallel:
- 1 control run (gec00): the reference simulation, without perturbation
- 30 perturbed members (gep01 to gep30): each starts from slightly different initial conditions, simulating the natural uncertainty of observations
Result: instead of a single scenario, you get 31 possible futures. If the 31 forecasts converge, confidence is high. If they diverge, it is a clear signal that the situation is uncertain and caution is needed.
Two ensemble models in NavimetriX
- GEFS 0.50° (NOAA): 31 members, forecasts up to 30 days. It provides wind and pressure, each with its spread.
- ECMWF IFS ENS 0.25° (European Centre): 51 members, finer grid, forecasts up to 15 days. It provides wind and its spread, but not pressure. Its control run, shown on the chart, is the ECMWF IFS forecast itself: for the same run, the wind is that of the ECMWF IFS 0.25° model.
The control run and the spread: see the uncertainty at a glance
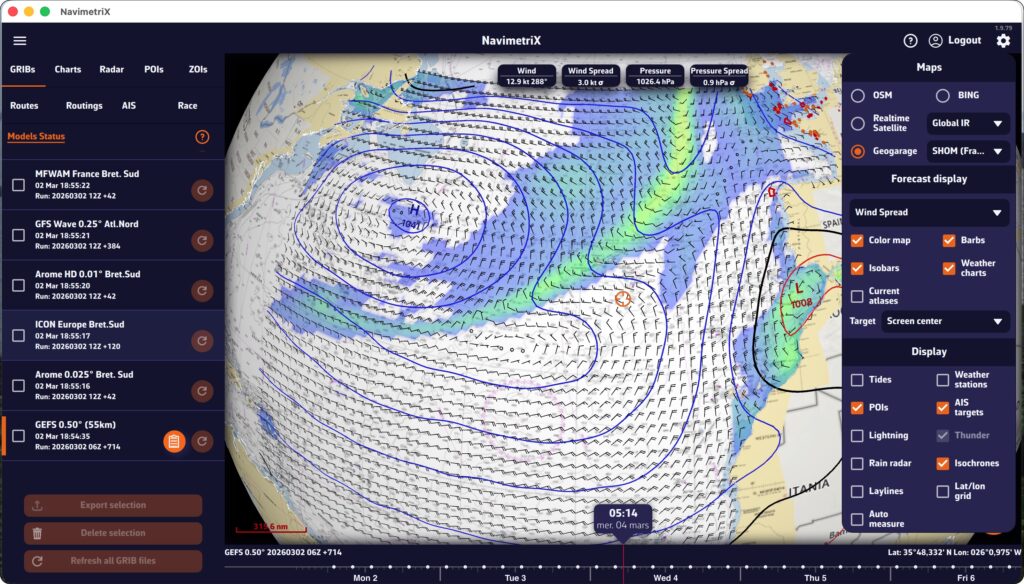
The ensemble file provides, for each point on the grid, two pieces of information:
- The wind (and the pressure with the GEFS) of the control run: a complete scenario, where lows, isobars and winds fit together
- The spread (standard deviation): how far apart the members are at that point
To display the spread, open the round orange layers button and choose Wind Spread (or Pressure Spread with the GEFS) in the parameter list, under Forecast display.
Read the spread as a confidence index. A low spread means the members agree and the scenario shown is solid. A high spread means they diverge: the scenario shown is then only one possibility among others. The spread is not a range around the wind shown, though: it measures how the members scatter around their average, and the control run is no more likely than any other member.
Why not show the average of the members? When they place a low in different spots, their average wipes it out and winds from opposite directions cancel each other out: the chart would show light wind where most members forecast a gale.
Why it's essential for navigation
At sea, the weather determines your route, your speed and your safety. Here's what an ensemble model gives you in concrete terms:
1. Quantifying uncertainty
A classic deterministic model tells you: “15-knot wind”. An ensemble model also tells you how reliable that figure is: with a 3-knot spread, the members agree; with 12 knots, some forecast light wind and others a gale. This information is invaluable for choosing the right sails, planning a backup, or simply deciding whether it's the right time to set sail.
2. Evaluating the reliability of your routing
Your weather routing gives you an optimal route, but this route is calculated on a single scenario. What happens if the wind shifts 20°? If the low moves faster? Ensemble routing calculates the optimal route for each of the scenarios. If all routes pass through the same place, you can go with confidence. If they spread out, caution is advised.
3. Anticipating beyond 5 to 7 days
The reliability of a classic model declines rapidly after 5 to 7 days. The ensemble model, on the other hand, remains useful beyond that point, not because it predicts better, but because it shows you how uncertain the forecast is. When the members diverge at D+7, you know it's still too early to decide; that's already very useful information!
Ensemble models in NavimetriX: easy and accessible
Until now, using an ensemble model was the stuff of professional meteorologists and offshore racing skippers. NavimetriX is changing that by making this data accessible to all sailors:
- Integrated download: GEFS and ECMWF IFS ENS are downloaded like any other GRIB file, directly from the app (Type Ensemble in the Download GRIB window, with the Premium option)
- Spread display: you see at a glance where the forecast is reliable and where it is not
- One-click ensemble routing: NavimetriX downloads the members and automatically calculates one route per member; no need to handle files or run scripts
- Intuitive display: colored “spaghetti” routes and confidence corridor directly on the chart
The ensemble model is no longer just for experts. It is a tool that helps all sailors make better decisions by turning uncertainty into clear, usable visual information.
In NavimetriX, a point you place on the chart is called a POI (Point Of Interest), a generic term that can include many elements (targets, anchorages, beacons, race marks, etc.). The points that make up a route are called waypoints; a POI can be used as a waypoint when you create a route.
Creating a POI
On a tablet or smartphone

Drag the chart under the target in the centre of the screen, zooming in to position it accurately.
Tap the round orange + button in the bottom right corner of the screen and select “Add POI” from the menu.
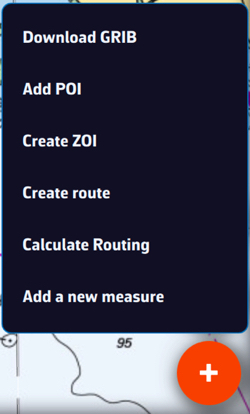
In the creation window that opens, you can:
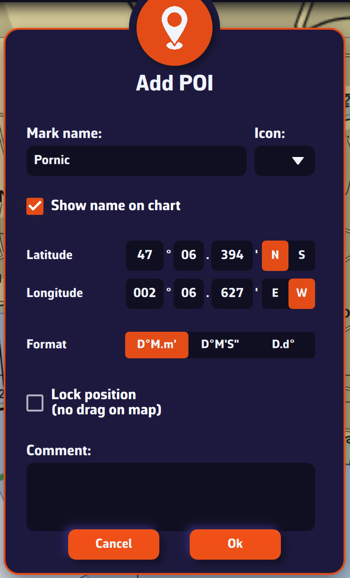
- Enter the name of the point
- Select an icon from the drop-down list
- Choose whether to show the name on the chart
- Enter a specific latitude and longitude manually
- Choose the coordinate format
- Lock the POI's position, so that it cannot be dragged on the chart
- Enter a comment about this POI
Tap “Ok” to confirm.
On a Mac or PC
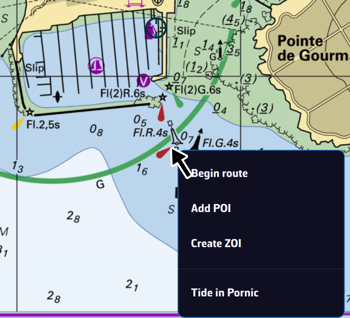
Place the mouse or trackpad pointer on the desired location on the chart, without worrying about the target, and right-click. In the menu that appears, select “Add POI”. The creation window opens as shown above.
You can also proceed as on a tablet or smartphone.
Saving
The points are saved in the POI list: open the left panel with the chevron handle on the left edge of the screen, then choose the POIs tab.
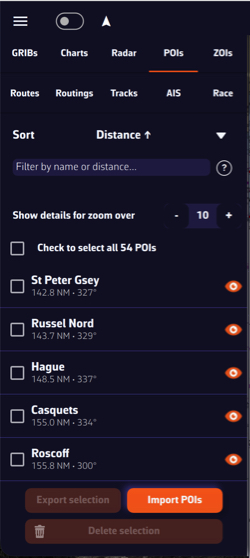
You can show or hide each point individually by tapping the eye icon on the right of its row. Tapping the name centres the chart on the POI. The ⋮ button of the row offers “Rename” and “Delete”. Tick the checkboxes to select several POIs for the buttons at the bottom of the panel, “Export” (“Share” on a smartphone or tablet) and “Delete”.
Adjusting POI display
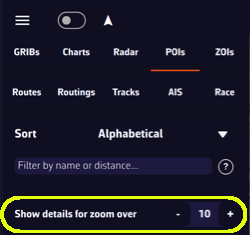
The “Show details for zoom over” setting, at the top of the POIs tab, makes the name and optional icon appear only from a certain zoom level, so that the chart is not cluttered if you have many points.
Moving a POI
To move a POI, tap or click on it, select “Move POI” from the menu that opens, then drag it on the chart. This item does not appear if the POI's position is locked: unlock it first with “Edit POI”.
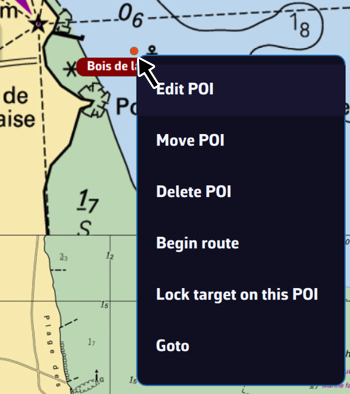
On a tablet or smartphone
Tap the round orange + button in the lower right corner of the screen. From the menu, select “Create route”.
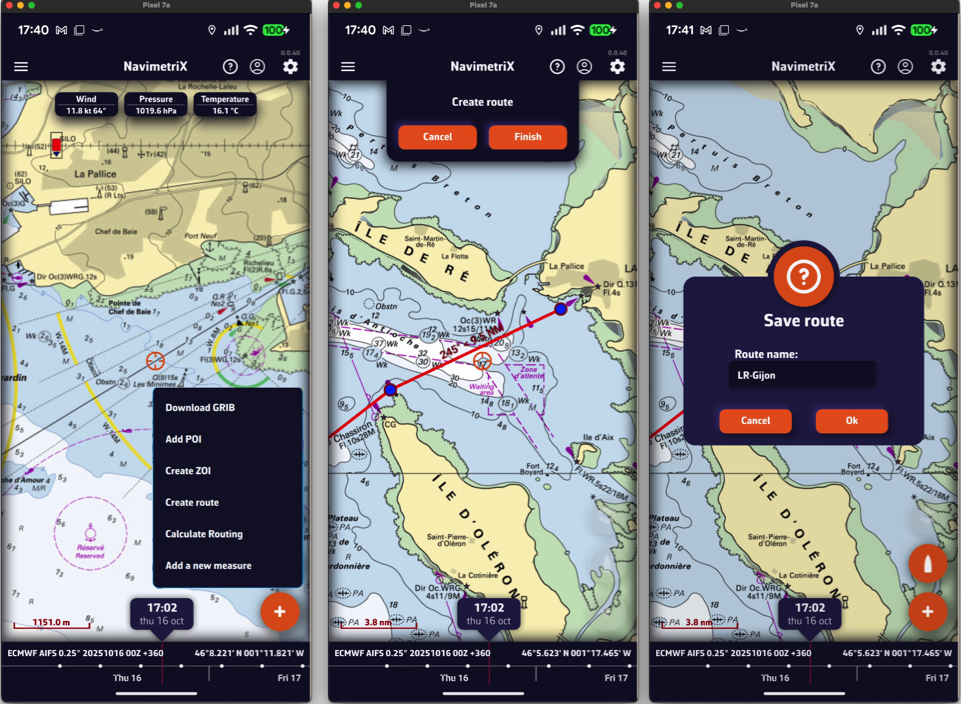
Tap the chart successively to place the desired points; a point dropped on a POI snaps to it. You can drag the points with your finger to move them, and tap a point to edit or delete it. Zoom in for more precise placement if needed. Once the route is complete, tap the “Finish” button at the top of the screen. Enter a name for your route in the “Save route” window and confirm with “Ok”. A route must have at least 2 points.
On a Mac or PC
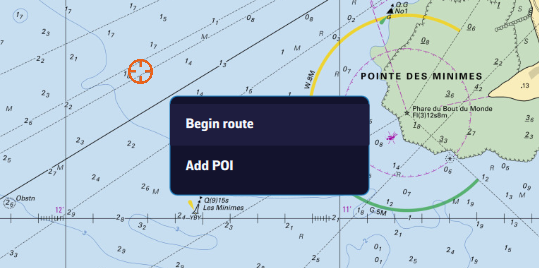
Right-click the chart with the mouse or trackpad. From the menu, select “Begin route”.
Click the chart to create successive points, zooming in for better accuracy. You can drag the points to move them, and right-click a point to edit or delete it. Click the “Finish” button at the top of the screen. Enter a name for your route and confirm by clicking “Ok”. You can also proceed as on a tablet or smartphone, with the + button.
From a POI
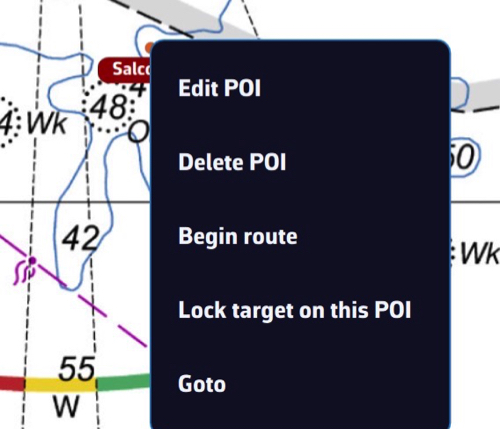
In any case, you can also create a route by tapping or clicking an existing POI (waypoint) and selecting “Begin route” from the menu: the route starts from that point.
To chain several existing POIs without touching the chart, open the Routes tab (see below) and tap the “From POI” button at the bottom of the panel. In the “Create route from POIs” window, tap the POIs in the order you will sail them, give the route a name, then tap “Create route”.
Saving
Routes are saved in the Routes list: open the left panel with the chevron handle on the left edge of the screen, then choose the Routes tab.
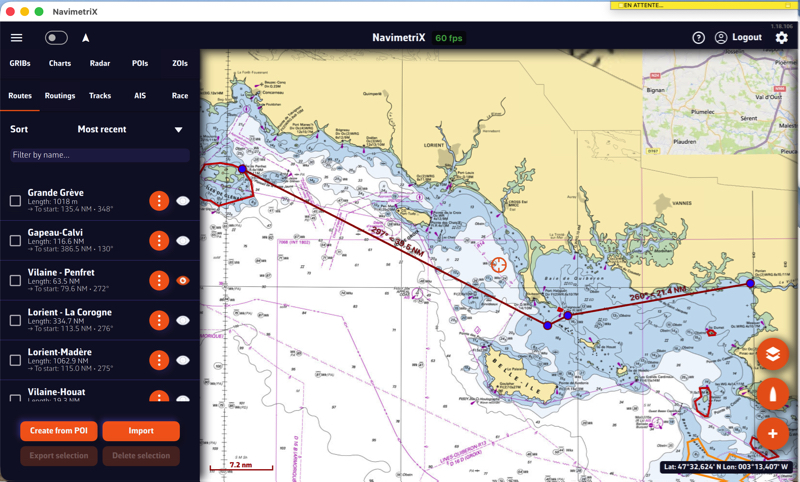
Tap the “eye” icon next to each route to show or hide it. Tick the checkboxes in front of the routes to select them for the buttons at the bottom of the panel, “Export” (“Share” on a smartphone or tablet) and “Delete”.
Reverse / duplicate a route

The ⋮ (“kebab”) button next to each route opens a menu with the functions available for the route: Details opens a detailed passage plan, Edit on Map, Edit from POIs, Rename, Duplicate, Reverse, Export (Share on a smartphone or tablet) and Delete.
Duplicate creates a copy of the route, named “(copy)”. Reverse creates a new route sailed in the opposite direction, named “(reversed)”; points to leave to port are switched to starboard and vice versa. The original route is not changed.
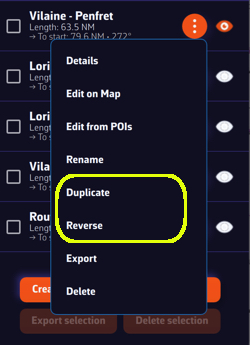
Tap or click, depending on your device, on a POI, and in the menu that appears select “Edit POI” to open the edit window.
You can also move the POI from this menu.
See also: How do I create a POI or waypoint
Open the left sidebar and select the “Routes” section. Display the route on the map by activating the “eye” symbol, then tap or right-click (depending on your device) on any part of the route. In the menu that appears, choose the option “Edit route”.
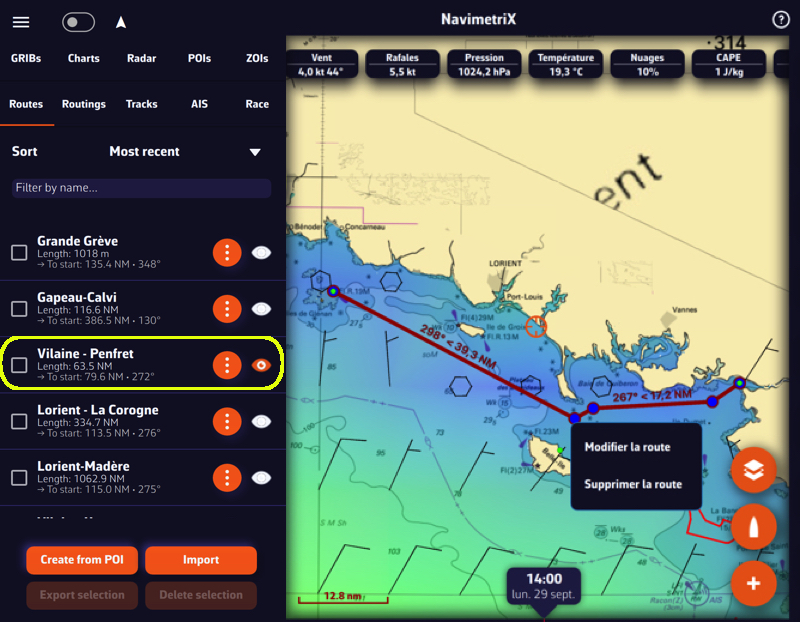
Below, the procedure on a smartphone:
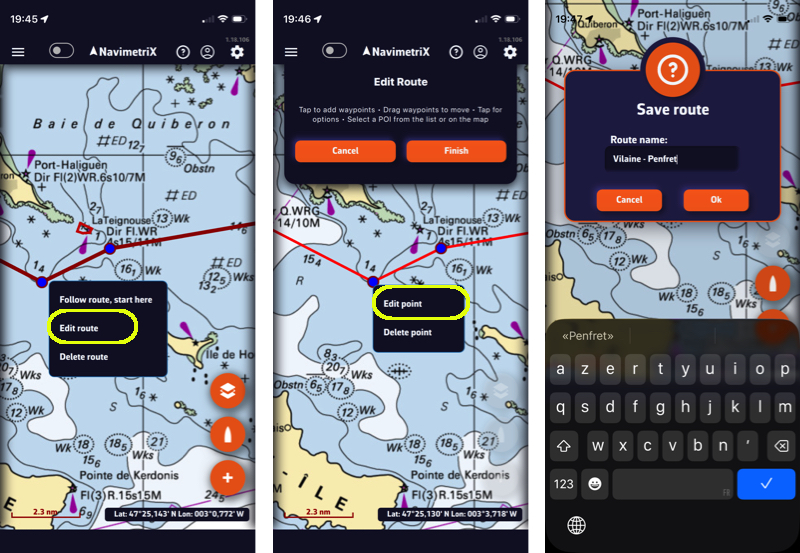
You can then drag points on the map to move them, add new ones by tapping on a segment of the route, and edit or delete any existing route point.
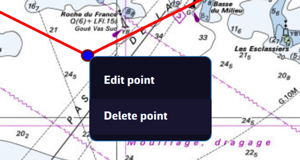
———
See also: How do I create a route?
To start navigation toward a POI (or waypoint):
💻 On a computer: click the POI you previously saved, then select Goto from the menu. Confirm that you want to navigate to this POI.
📱 On a smartphone or tablet: tap the POI, then select Goto and confirm navigation.
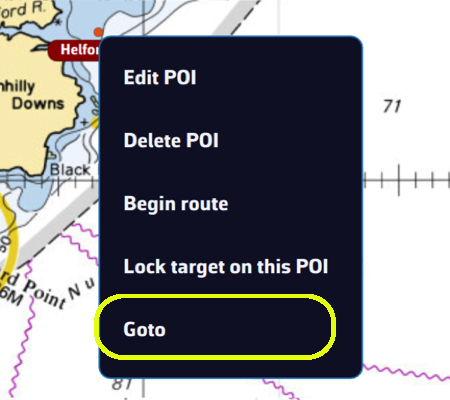
Once the POI is selected, if Navigation mode is on (Navigation switch at the top of the left panel, reserved for the Premium subscription) and your boat (your GPS) is at sea, a black dashed line is drawn between your boat and the POI.
If you are following a route, starting a “Goto” stops the route tracking: you then navigate to the chosen POI.
To stop navigation, tap or click again on the POI you are navigating to, then choose Stop goto from the menu and confirm.
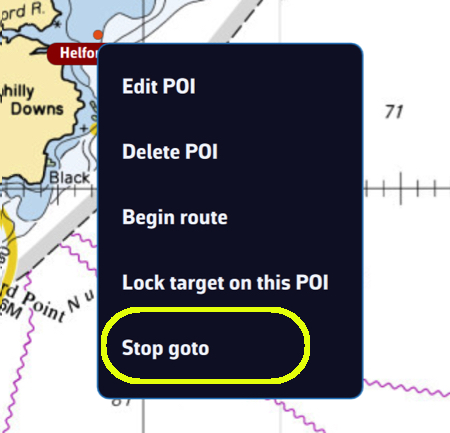
- Check that the option to display POIs is enabled.
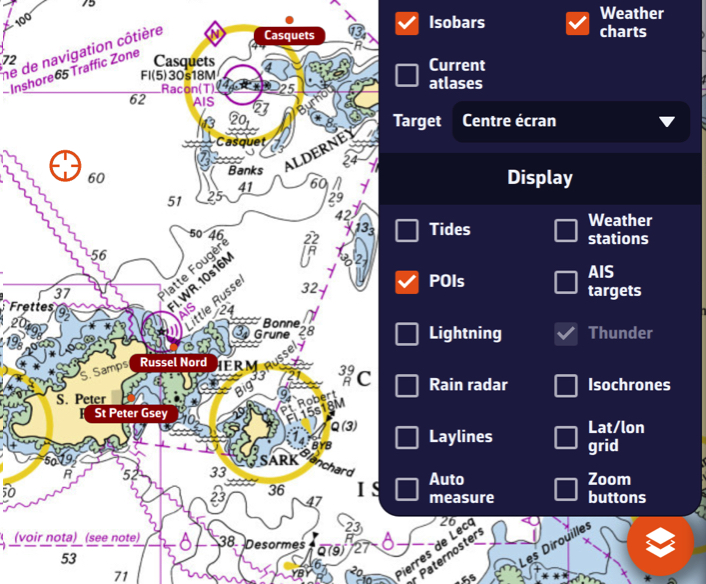
- If POIs only appear when zoomed in too far, lower the value of the option: "Show details for zoom over".
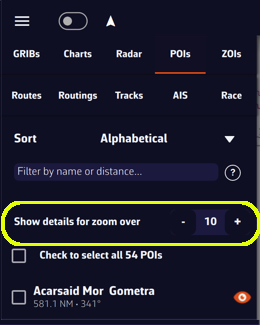
- Edit the route: tap or click the route shown on the chart and choose “Edit route” (or, in the Routes tab, ⋮ menu of the route, “Edit on Map”).
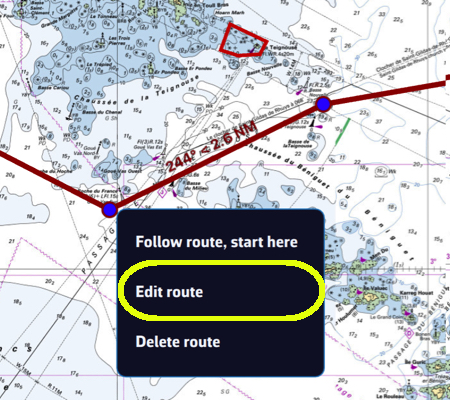
- Edit the waypoint: tap the point (right-click on a computer) and choose “Edit point”.
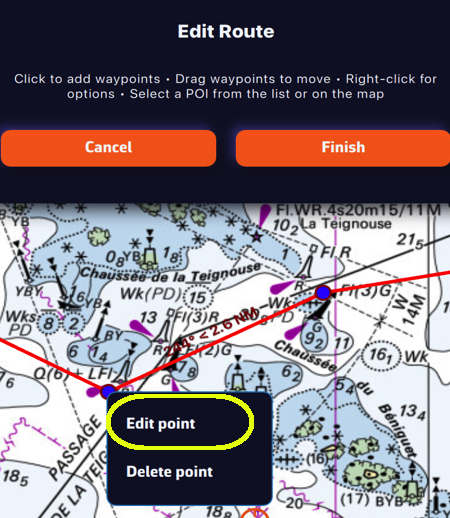
In the Waypoint window, change the default type “Pass through this point” to “Leave to starboard” or “Leave to port”. The routing takes this choice into account. For the first and last points of the route the list is greyed out: they remain pass-through points.
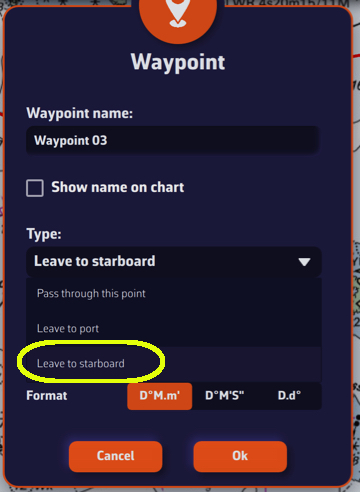
Confirm, then tap “Finish” and save the route. On the chart, the colour of the point shows the choice:
- Green: leave to starboard
- Red: leave to port
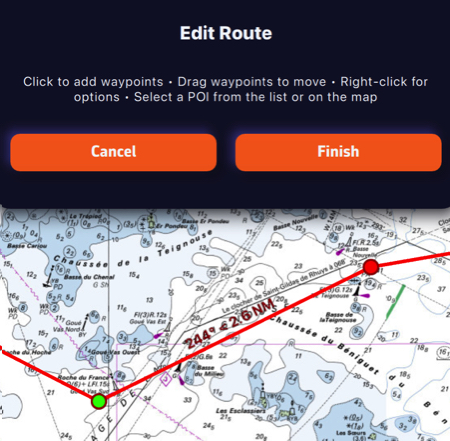
Course mark to round
Below the type, the “Side:” selector (None, Port, Starboard) tells which side to leave a mark you must round, a race buoy for example. This is racing information: the routing ignores it and still passes through the point.
The “Edit from POIs” window (⋮ menu of the route) and the “Details” window offer the same choices in a single list: “Pass through this point”, “Round, leaving to port”, “Round, leaving to starboard”, “Leave to port” and “Leave to starboard”.
Import POIs
Open the left panel with the chevron handle on the left edge of the screen, then select the POIs tab. Tap the Import button (down arrow) at the bottom of the panel.
You can import POIs in GPX, KML and WP format (format used by Adrena). Several files can be imported at once. POIs already in your list are not imported a second time.
Import routes
In the left panel, select the Routes tab, then tap the Import button at the bottom of the panel.
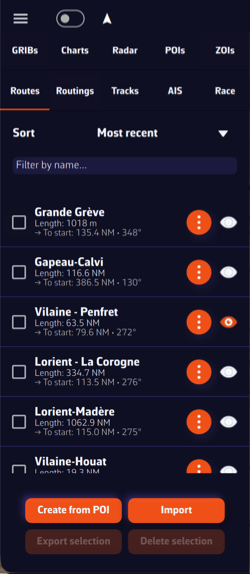
You can import routes in GPX, KML, RT (format used by Adrena) and RTZ (the route exchange format of ECDIS) format.
The “Export” buttons (“Share” on a smartphone or tablet) of the same tabs do the reverse for the ticked items: POIs as GPX or KML, routes as GPX, KML, RT or RTZ.
Route tracking allows you to set the boat to automatically navigate through each point on a route. If you control your autopilot by sending it NMEA data (*), it will steer the boat by following the successive legs from one point to the next.
Start route tracking
- Turn on Navigation mode with the “Navigation” switch at the top of the left panel (Navigation mode is reserved for the Premium subscription).
- Display a previously created route.
- Tap or click the point of the route from which you want to start tracking.
- Select “Follow route, start here”.
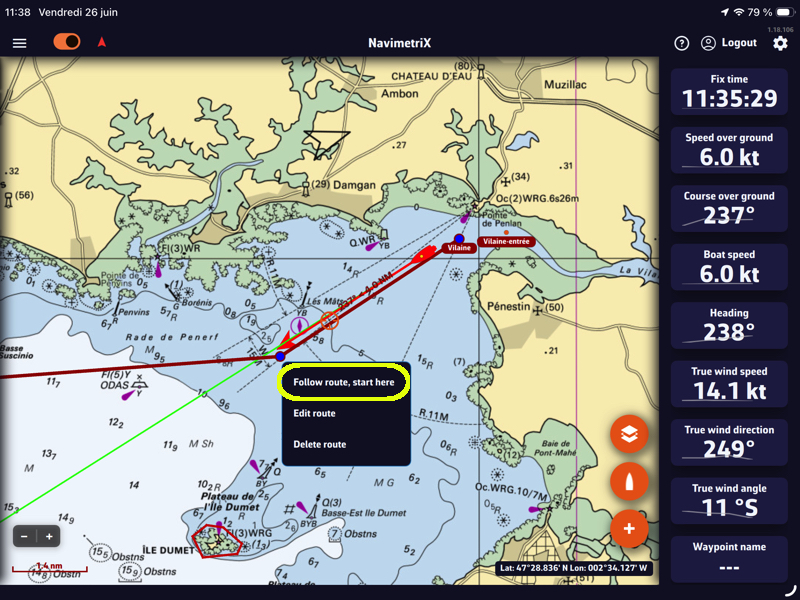
Tracking displays a cross-track corridor, whose width you set in the settings (handle on the right edge of the screen): My Boat > Cross track > XTE limit.
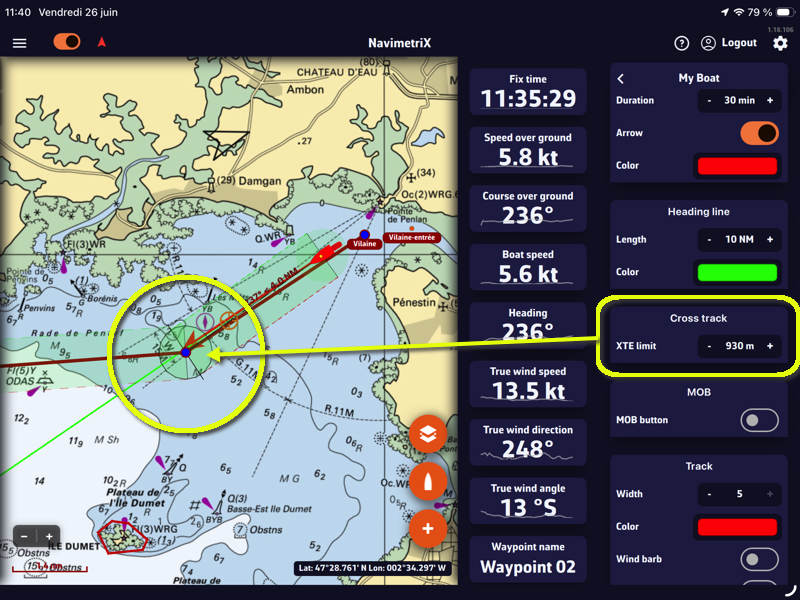
The cross-track corridor starts from the boat's position when tracking begins and follows all the remaining legs of the route, up to the last point. It is shown in Navigation mode, when the chart is zoomed in enough (a harbour view or closer):
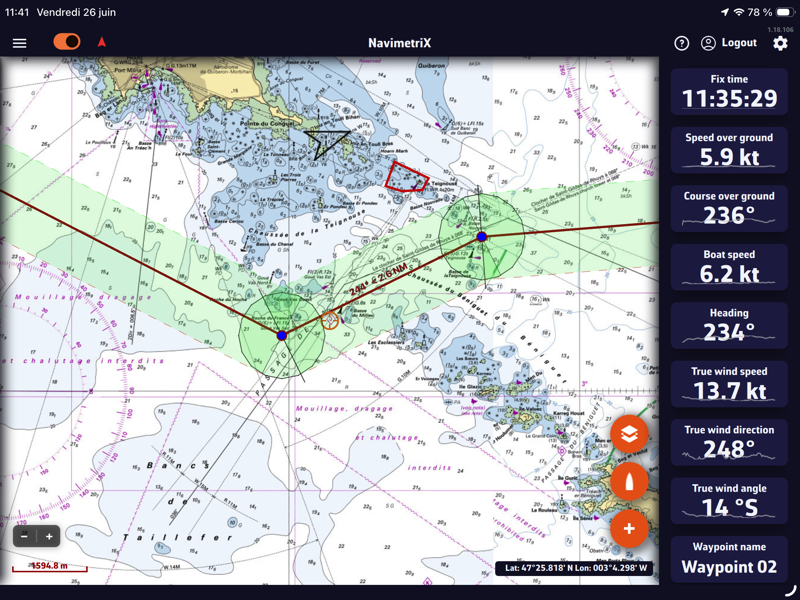
Change mark, stop tracking
While tracking, tapping or clicking another point of the route offers “Go to this mark”: tracking resumes towards that point, for example to skip an abandoned mark or to go back to a mark passed too early.
You can stop tracking (“Stop following”) or reset the cross-track error (“Reset XTE”) at any time from the route menu:
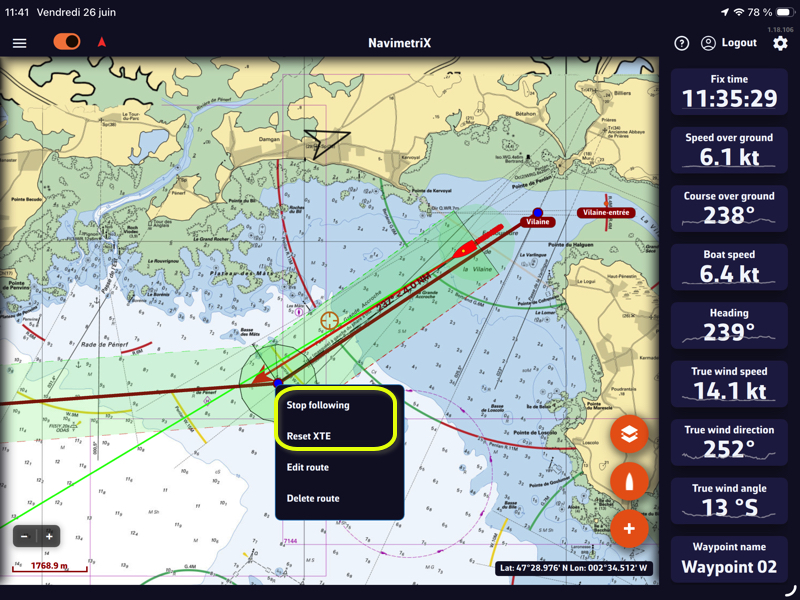
Cross-Track Alarm
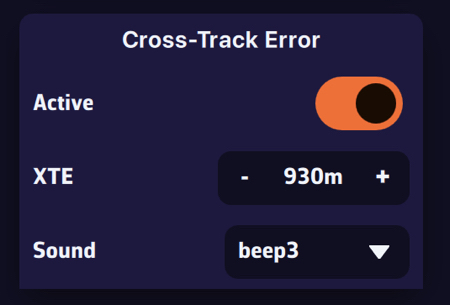
You can enable an alarm if the boat leaves the cross-track corridor.
- In the settings, select the Alarms section, Cross-Track Error, and turn on the “Active” switch.
- Use “XTE” to set the width of the corridor on either side of the direct route. It is the same setting as the XTE limit in My Boat.
- Choose a sound from the drop-down menu.
___
(*) See: How to send NMEA data to instruments
List of ZOIs
Open the left panel with the chevron handle on the left edge of the screen, then select the ZOIs tab.
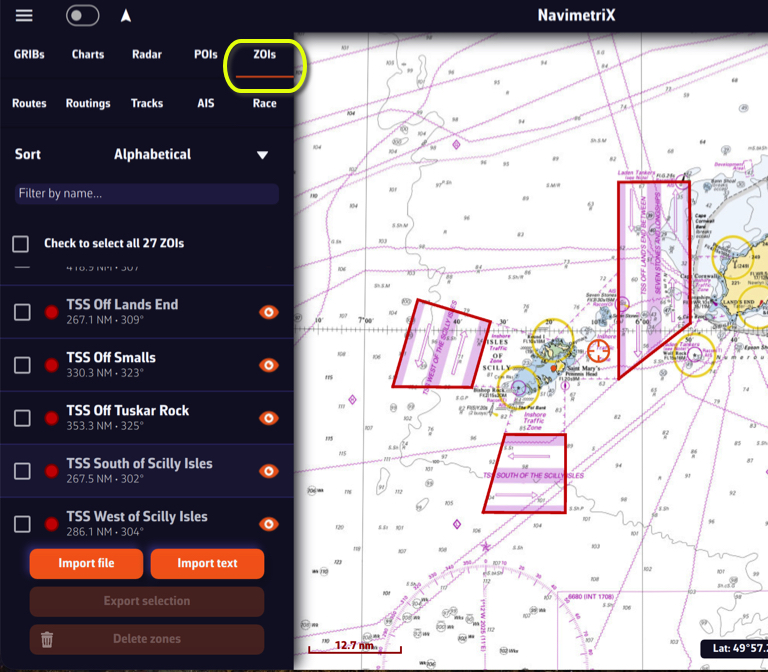
ZOIs are areas to avoid or areas of particular interest. Some are pre-existing in the application, but you can create as many as you need. There are three types:
- No-go zones: Traffic Separation Schemes (TSS), wind farms, protected environmental areas, shallow waters, etc., drawn in red.
- Slow zones: sargassum fields, speed-restricted areas, areas where the sea state is dangerous, etc., drawn in orange.
- Information zones: areas of particular interest for navigation, drawn in blue.
You can sort the list alphabetically, by increasing distance, or by date added. You can also filter the list by name.
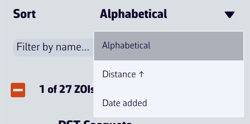
In the list, tapping or clicking a zone centres the chart on it. The eye icon shows or hides it on the chart. The ⋮ button of the row offers “Rename” and “Delete”. Tick one or more boxes to select zones for the buttons at the bottom of the panel, “Export” (“Share” on a smartphone or tablet, in KML format) and “Delete”.
The “Import” button accepts KML and MaxSea/TimeZero (.cl10) files. The “Text” button lets you import ZOIs in text format, from sailing instructions for example.
ZOIs and routing
Only no-go zones and slow zones are taken into account by the routing, and only if they are shown on the chart (eye on). You also need to turn on “Avoid no go zones” and “Slow boat in slow zones” in the routing settings: both are off by default.
Create a ZOI
Tap the round orange + button in the bottom right corner of the screen and choose “Create ZOI” (on a computer, you can also right-click the chart). Tap the chart to place the points of the outline (at least 3, with no crossing sides), then tap “Finish” at the top of the screen. In the “Save zone” window, enter a name, choose the type (Information, No-Go Zone, Slow Zone) and add a comment if needed. For a slow zone, the “Speed Factor (0.0 - 2.0)” is the coefficient applied to the boat's speed inside the zone.

Modify a ZOI
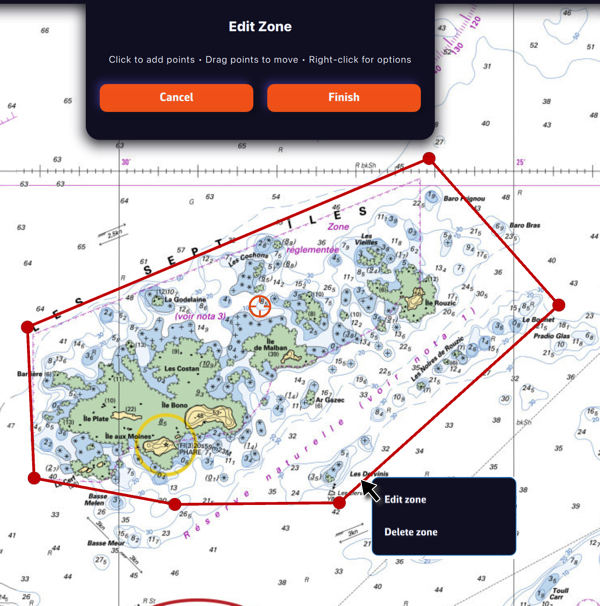
Tap or click the border of a ZOI to edit it (“Edit zone”) or delete it (“Delete zone”). You can move the borders by dragging the corners, and add an intermediate point anywhere on the border to modify it. After selecting the “Finish” button, you can also change the name and type of the zone.
Your boat’s polar determines all routing calculations. It represents your boat’s performance depending on wind speed and angle.
The application supports files in the .pol format (also used by SailGrib, Adrena, and others).
To choose your boat's polar from the library:
- Open the settings drawer (handle on the right edge of the screen) and go to "My Boat".
- Press the Polar row, which shows the selected polar.
- The "Polars" dialog opens, with four tabs: Library, My polars, iPolar and ORC.
- The "Library" tab offers nearly 500 polars of well-known boats.
Most of these polars come from naval architects or ORC certificates.
To find your polar, you can:
- Scroll through the list.
- Use the search field: for example, type "3600" to find the polar of the Sun Fast 3600.
Tap the polar you want to select it: its name appears at the top of the dialog, next to "Selected polar". Then press OK to confirm it.
The Polar row also appears at the top of the Routing section of the settings: it is the same setting, and you can change it from either place.
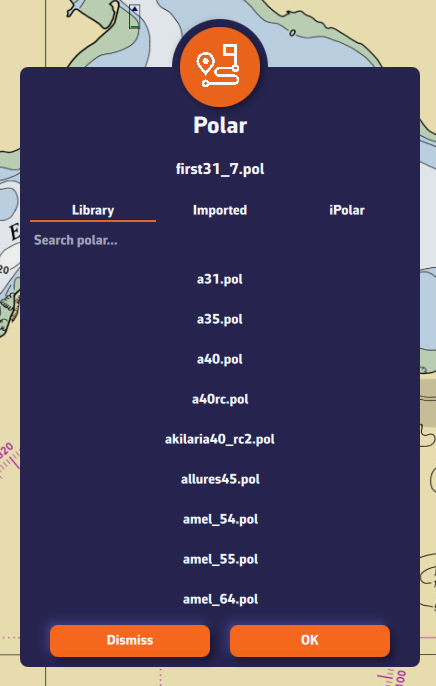
The app imports polars in .pol, .csv and .txt format, whatever the separator (see Which polar formats can I import and export?).
To import your own polar:
- Open the settings drawer (handle on the right edge of the screen), go to "My Boat" and press the Polar row. The "Polars" dialog opens.
- Select the "My polars" tab.
- Press the "Import Polar" button.
- Choose your polar file (.pol, .csv or .txt) saved on your computer, tablet or phone. On a computer, the file picker opens on the Downloads folder.
- The imported polar appears in "My polars" under the name of your file, with the .pol extension, and it is already selected. If the app had to correct something in the file, a "Polar imported with warnings" message details what it did.
- Press OK to confirm the polar.
Advantage: if you are logged into your NavimetriX account, the selected polar is synchronised across all your devices!
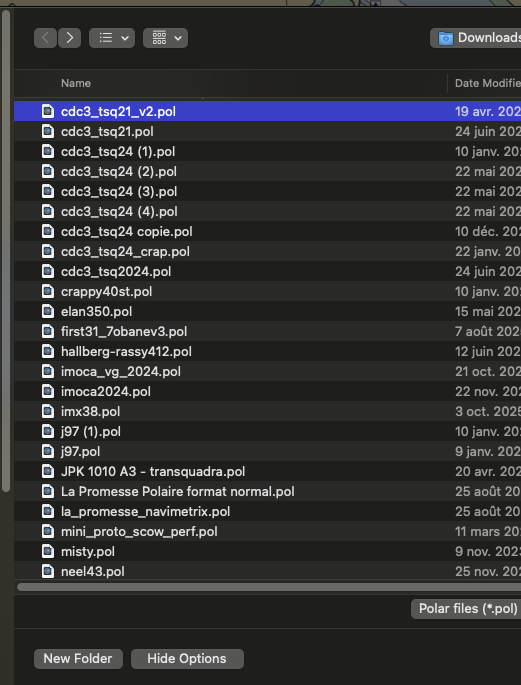
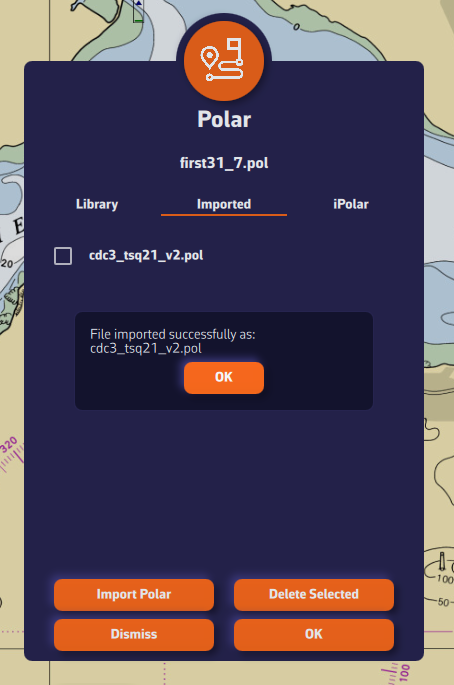
Can I build my own polar from my sailing data?
Yes, it is possible… but in practice it is often very complicated.
You first have to record your passages with well-calibrated instruments. This gives a large cloud of points, which then has to be filtered (engine, manoeuvres, stops, etc.).
Then comes smoothing and checking the consistency between neighbouring wind speeds (for example 8, 12 and 16 knots).
It is long, painstaking work: for my Sun Fast 3200, it took me nearly two years to get a reliable result with a well-known software package.
A simple method (90% of the result)
- Choose a polar close to your boat from the library or from your ORC certificate, or create one with the iPolar module built into the app.
- Ask yourself these questions:
- In 12 knots of wind and flat water,
- at what angle and what speed do you sail upwind?
- what speed do you reach on a beam reach?
- at what angle and what speed do you sail downwind?
- In 12 knots of wind and flat water,
- Compare these speeds with those of the polar (for example with a "Constant wind" routing at 12 knots) to work out an average efficiency percentage. Then enter it in the routing settings, rows "Speed scale under 10 knots" and "Speed scale over 20 knots". If your boat does not point as high as the polar claims, also set "Minimum upwind angle".
- Sail and adjust: if your real speeds or angles differ from the routing, refine step by step, distinguishing:
- light winds, where the first efficiency applies;
- strong winds, where the second one applies.
The two thresholds that separate light and strong wind are 10 and 20 knots by default. They are set in My Boat, under the polar: "Light wind threshold" and "Strong wind threshold". The efficiency labels in the routing settings then show your values. Between the two thresholds, the efficiency changes gradually from one to the other; below the lower threshold and above the upper one, it stays constant.
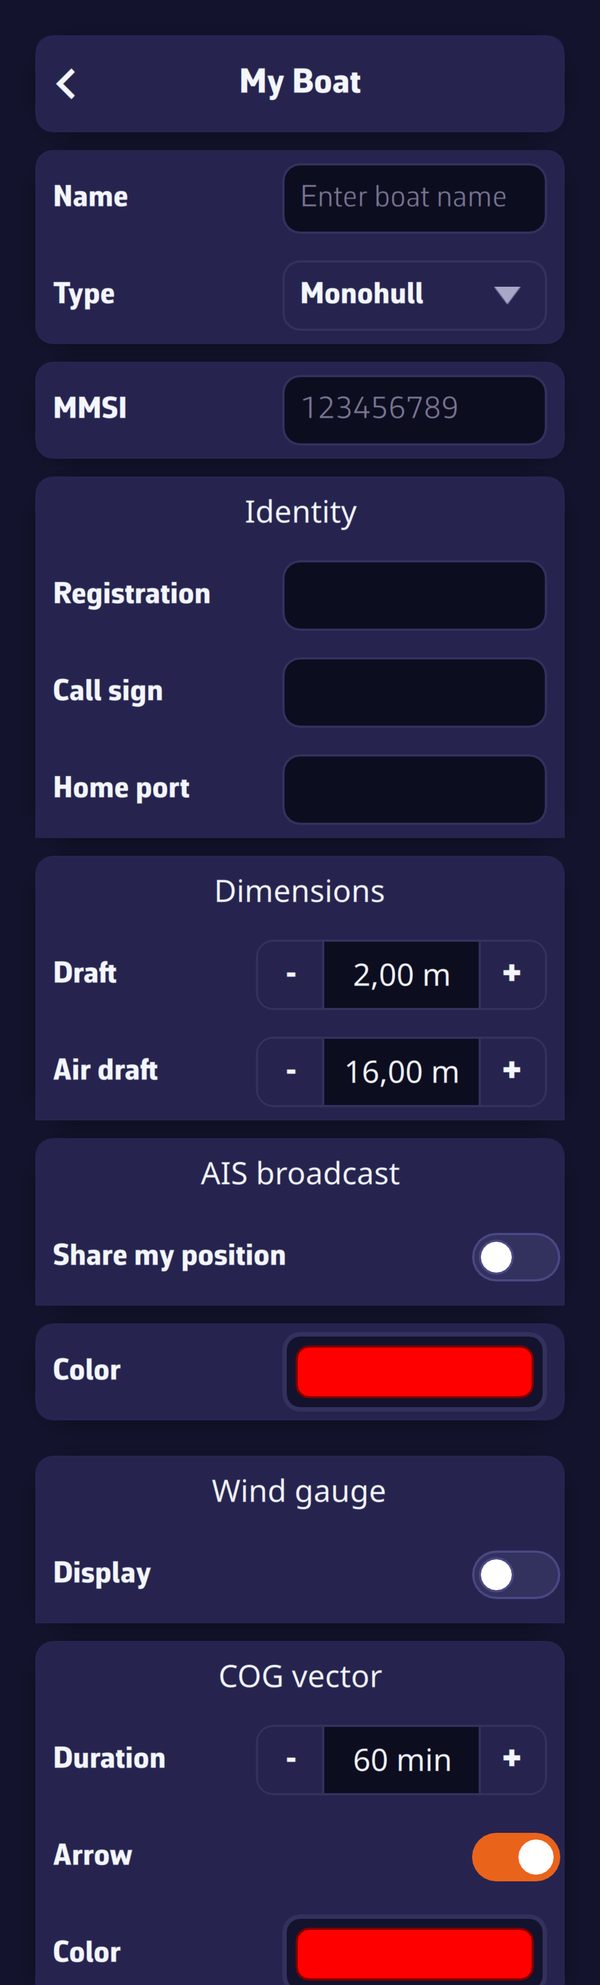
These settings are detailed in How do I calculate a routing? What are the different settings?
Refining the polar in the app
To correct the shape of the polar itself, there is no need for a spreadsheet: the polar editor opens from the kebab menu of the selected polar, "Edit" entry.
- The Curves and Slice views show the polar by wind speed and by angle; the "Smooth neighbours while dragging" box gently reshapes the neighbouring points when you move one.
- The Targets view shows the best VMG angles and speeds, to be smoothed first.
- The "Consistency warnings" point out inconsistencies while you work.
- The Report tab scores the polar out of 100 and compares it with the five closest polars of the library.
Save as stores the refined polar in My polars; a library polar is never overwritten.
iPolar lets you create a polar in one minute from your boat's characteristics:
- Open the settings drawer (handle on the right edge of the screen), go to "My Boat" and press the Polar row. The "Polars" dialog opens.
- Select the "iPolar" tab, then press "Create Polar".
- Enter the required information:
- Polar name (at least 3 characters)
- Length overall
- Displacement
- Mainsail area
- Jib area
- Optional information (tick the box to fill it in):
- Waterline length
- Symmetrical spinnaker area
- Asymmetrical spinnaker area
- Choose your parameters:
- Navigation style: Cruising or Racing
- Polar type: Routing or Performance. The Routing type gives speeds equal to 92% of those of the Performance type.
- (For most users: Cruising + Routing)
- Press "Calculate Polar".
- The new polar appears in the list, already selected. Press OK to confirm it.
The file name ends with _routing or _perf depending on the type chosen.
A Sailchart comes with the polar
iPolar also creates a Sailchart for the new polar: a genoa that is progressively furled as the wind builds and, if you entered their areas, the symmetrical and asymmetrical spinnakers. The routing can then colour the route by sail and account for sail changes. You can adjust it afterwards in the Sailchart editor.
Note: The iPolar method was developed by KND, experts who work for the America's Cup, TP52s and IMOCAs, the best in their field!
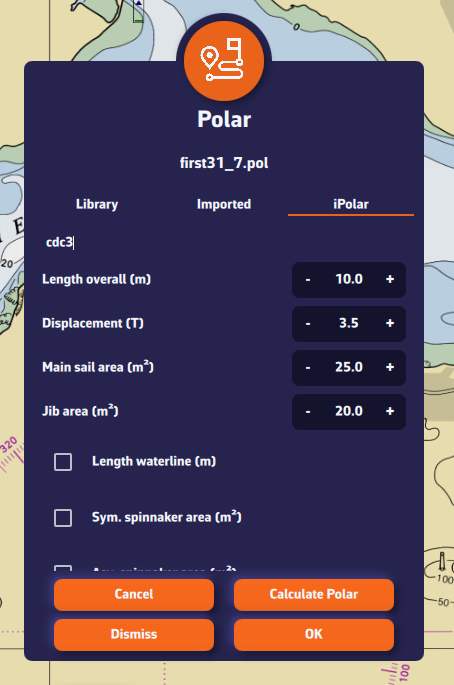
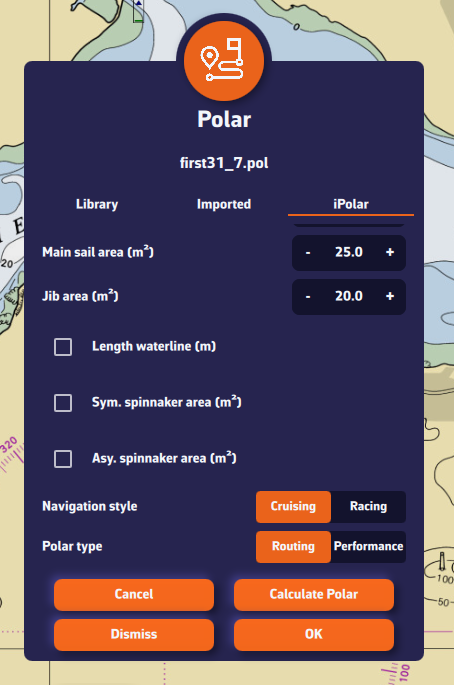
No, this is no longer needed. Earlier versions of NavimetriX only accepted tab-separated .pol files, and a .csv file had to be converted with a spreadsheet. This is no longer the case.
The "Import Polar" button accepts .pol, .csv and .txt files directly:
- whatever the separator: semicolon, comma, tab or spaces;
- with decimal commas as well as decimal points.
The app converts the file to its internal format and keeps your original file alongside it. If something deserves your attention (for example an empty cell filled by interpolation), a warning is shown without blocking the import.
For the steps to follow, see How to import a polar file? The full list of formats read and exported is in Which polar formats can I import and export?
Before you start
To calculate a routing, you first need to have:
- Selected your boat's polar:
- from the library of nearly 500 boats,
- by importing your polar,
- from your ORC certificate,
- or by creating it very easily with iPolar.
- Created a route: see How do I create, reverse, duplicate a route?
- Downloaded the weather forecast along the route: see How do I download a GRIB file?
Remember that a routing is only useful if it is well calibrated and if you understand the result. Running a single calculation and treating the result like a railway timetable will, at best, lead to disappointment. We therefore recommend this approach:
- load the weather, try to understand it, especially its risks;
- always start simple:
- a route that is not too complicated and leaves the calculation room to "breathe",
- route with the wind only,
- no wind or sea-state constraints;
- add currents and waves only if necessary;
- for the more studious, study the stability of the routing by varying the wind percentage of the GRIB and the polar efficiencies;
- start again with another weather model;
- sum up: understand the risks of deviation and how to react if they happen;
- start again every 12 hours…
1. Open the routing dialog
Press the + button and choose "Calculate Routing". The Routing dialog opens.
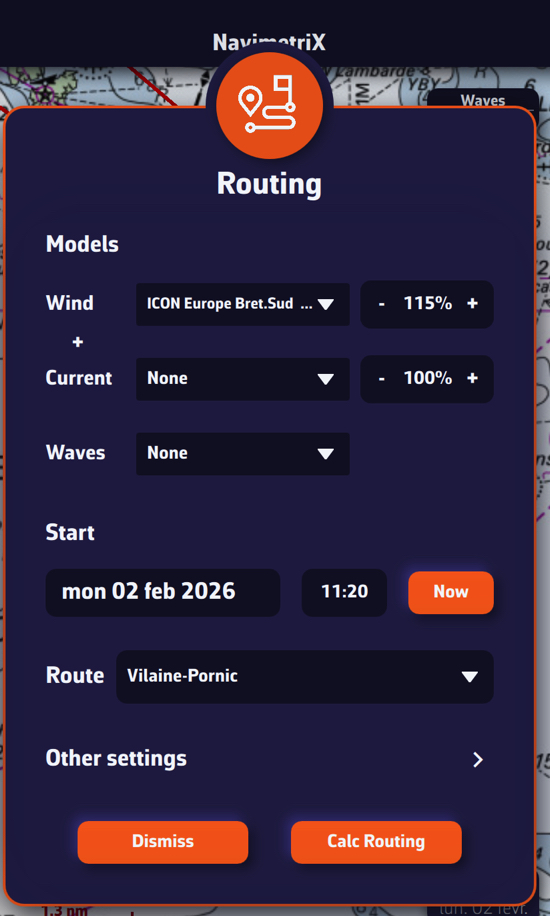
Models
You can choose three forecast files: Wind, Current and Waves.
To begin with, choose only a wind file. Next to the file, a percentage (80 to 150%, 100% by default) multiplies the wind speed of the GRIB. We recommend 115%: GRIB wind speeds are quite often below reality. The current has the same setting.
The small + button under the wind file adds a second wind file: see How does multi-GRIB routing work? With an ensemble GRIB, the dialog offers "Calculate ensemble routings": see How to launch and interpret an ensemble routing?
In a second step, if you follow our recommendations, you will choose a current model and then a wave model.
Start
- Date and time: press the date to open the calendar, then the time to choose hours and minutes. The "Now" button sets the current date and time.
- "Now from my position": start from the boat, now. This row only appears with a GPS position: see How to calculate a routing underway?
- "Best start": looks for the start time that gives the fastest passage. Turn it on, then set the "Window" (1 to 120 hours, 24 hours by default) and the "Step" (15 to 360 minutes, 60 minutes by default). The app calculates the routing for each start time, from the chosen time to the end of the window, then keeps the fastest one as the routing. A "Best start" table then opens: start, passage, arrival and distance for each try. The fastest passage is highlighted in it and recalled at the top of the table. This setting does not apply to a routing from a pivot point or to a routing to a point.
Route
Choose the route you have just created.
The "Other settings" button opens, without leaving the dialog, the settings described below. Then press "Calc Routing".
2. The routing settings
They are in the settings drawer (handle on the right edge of the screen), Routing section, or in the dialog through "Other settings". They are changed less often, but let's look at the main ones.
Adjusting the boat's polar
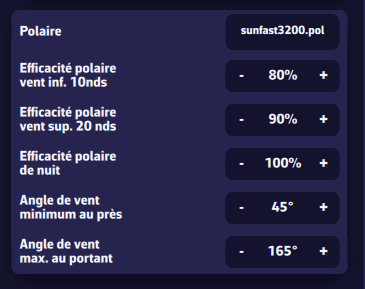
- Polar: the boat's polar, the same as in My Boat. See How do I choose a polar file in the library?
- "Speed scale under 10 knots" (80% by default): most of the time, polars are theoretical and optimistic. If in doubt, set about 80% for a cruising boat.
- "Speed scale over 20 knots" (90% by default): likewise, set about 90% for a cruising boat.
The 10 and 20 knot thresholds are set in My Boat, under the polar ("Light wind threshold" and "Strong wind threshold"); the labels above then show your values. Between the two thresholds, the app moves linearly from one efficiency to the other; below the lower threshold and above the upper one, the efficiency stays constant. - "Speed scale at night" (100% by default): useful if you shorten sail at night, for example by taking a reef or dropping the spinnaker. It applies during nautical night and multiplies with the two other efficiencies. Leave it at 100% to begin with.
- "Minimum upwind angle" (45° by default): here again, polars are often optimistic about pointing. This setting "cuts" the polar at a reasonable angle. We recommend 40° with a full crew, 45° single-handed or cruising.
- "Maximum downwind angle" (165° by default): this is mainly a safety matter. To avoid accidental gybes, you do not sail dead downwind, even if the polar suggests it.
To set these efficiencies from your real speeds, see How do I fine-tune my polar?
Isochrones and duration
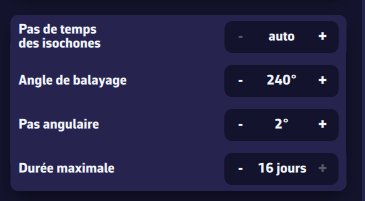
- "Isochrone duration": the time between two isochrones. We strongly recommend leaving it on auto. See What are isochrones?
- "Maximum duration" (1 to 30 days, 30 by default): the routing stops after this duration, or earlier at the end of the GRIB forecast. You can reduce it, for example to 3, 5 or 7 days, to study the stability of the routing.
The "Sweep angle" and "Step angle" settings of earlier versions are gone: the current routing engine no longer needs them.
Manoeuvre penalties
The time lost at each manoeuvre, taken off the sailing time:
- "Tack penalty": 30 seconds by default (0 to 600 seconds);
- "Gybe penalty": 30 seconds by default;
- "Sail change penalty": 120 seconds by default, counted only if the polar has a Sailchart. It adds to the penalty of a tack or gybe made at the same time.
Higher penalties give routes with fewer tacks and gybes.
Engine use
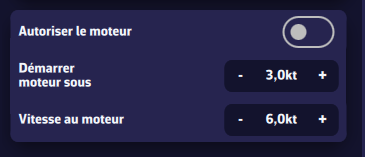
- "Allow engine use": turn on to let the routing use the engine.
- "Start engine under" (3 knots by default): sailing speed below which the engine starts.
- "Motoring speed" (6 knots by default): boat speed under engine.
Legs under engine are drawn dashed on the chart.
Zones
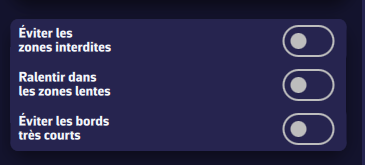
These settings act on your ZOIs (zones of interest). You create them with the + button, "Create ZOI" entry, and manage them in the ZOIs tab of the left drawer (import and export in KML format).
- "Avoid no go zones": the routing goes around ZOIs of the No-Go Zone type (traffic separation schemes, wind farms, shoal areas…).
- "Slow boat in slow zones": in a ZOI of the Slow Zone type, the boat speed is multiplied by the zone's speed factor.
C-MAP charts
These settings only appear in the versions of the app that support C-MAP charts (iPhone, iPad, Android, macOS, Windows and Linux; not the web version).
- "Avoid shallow waters (C-MAP)" (off by default): the routing reads the C-MAP chart (land, depth areas, rocks, wrecks, obstructions) and only goes where the charted depth is at least the draft set in My Boat, plus the under-keel clearance. The following settings are only used when this one is on.
- "Under-keel clearance" (0.5 m by default, up to 5 m): the safety margin under the keel.
- "Use the tide for the depth" (on by default): adds the predicted height of tide to the charted depths, taking the lowest tide of the nearest port during each leg.
- "Min distance to dangers" (30 m by default, up to 500 m): nothing shallower than needed may lie within this distance of the route.
- "Avoid restricted areas (C-MAP)" (on by default): the route avoids, as it avoids land, the chart areas where entry is prohibited, restricted or to be avoided (wind farms, firing ranges…).
- "Pass cardinals on the right side (C-MAP)" (on by default): the route keeps a margin on the danger side of cardinal marks (0.2 NM), around isolated danger marks (0.1 NM) and on the outer side of lateral marks where the chart gives the direction of buoyage (0.1 NM).
If the C-MAP chart could not be read over part of the route, a message tells you at the end of the calculation: on that stretch, the route was not checked against depths and dangers.
Constant wind
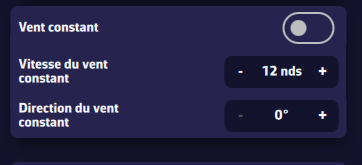
This mode is useful to study the effect of the current, for example in a bay. It freezes the wind (for example the one measured by your wind vane) so you can understand how the current affects the optimal route.
- "Constant wind": turn on to use this mode.
- "Constant wind speed": for example the one measured by your anemometer.
- "Constant wind direction": for example the one measured by your wind vane.
Wind and sea-state limits
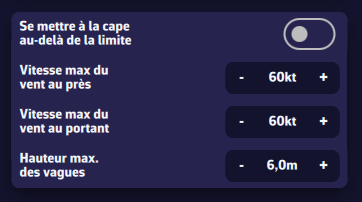
These limits constrain the optimal route: by default, the routing avoids the areas where they are exceeded. Do not overdo them, or the routing may no longer reach the finish. For example, do not set a downwind maximum wind speed of 20 knots for an ocean crossing.
- "Heave to over limit": instead of avoiding the area, the boat stops (speed 0) while the limit is exceeded. If the limit is only exceeded for 3 hours of a long passage, heaving to for 3 hours is probably wiser than adding hundreds of miles to the route.
- "Upwind max wind speed" (60 knots by default): applies when the wind is forward of the beam (angle below 90°).
- "Downwind max wind speed" (60 knots by default): applies when the wind is abaft the beam.
- "Waves max height" (6 m by default): significant height of the total sea above which the constraint applies. A wave file is needed.
Influence of crossed seas
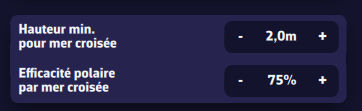
There is a crossed sea when the wind sea and the swell both exceed a minimum height and their directions are 45° to 135° apart. The boat is then strongly slowed down. This needs a wave file that gives the wind sea and the swell separately; with a file that only gives the total sea, no crossed sea is detected.
- "Waves min height for crossed sea" (2 m by default): the height that both the wind sea and the swell must exceed.
- "Polar crossed sea efficiency" (75% by default): a factor that multiplies with the other polar efficiencies.
Reset the settings
It is easy to get a bit lost among all these settings: press "Reset routing parameters to default" to restore the default values. Note that this button also sets the maximum duration to 16 days and the wind percentage to 115%.
Once the routing is computed, the optimal route is shown on the chart together with the isochrone curves. These curves represent the positions that can be reached at successive time intervals from the start point.
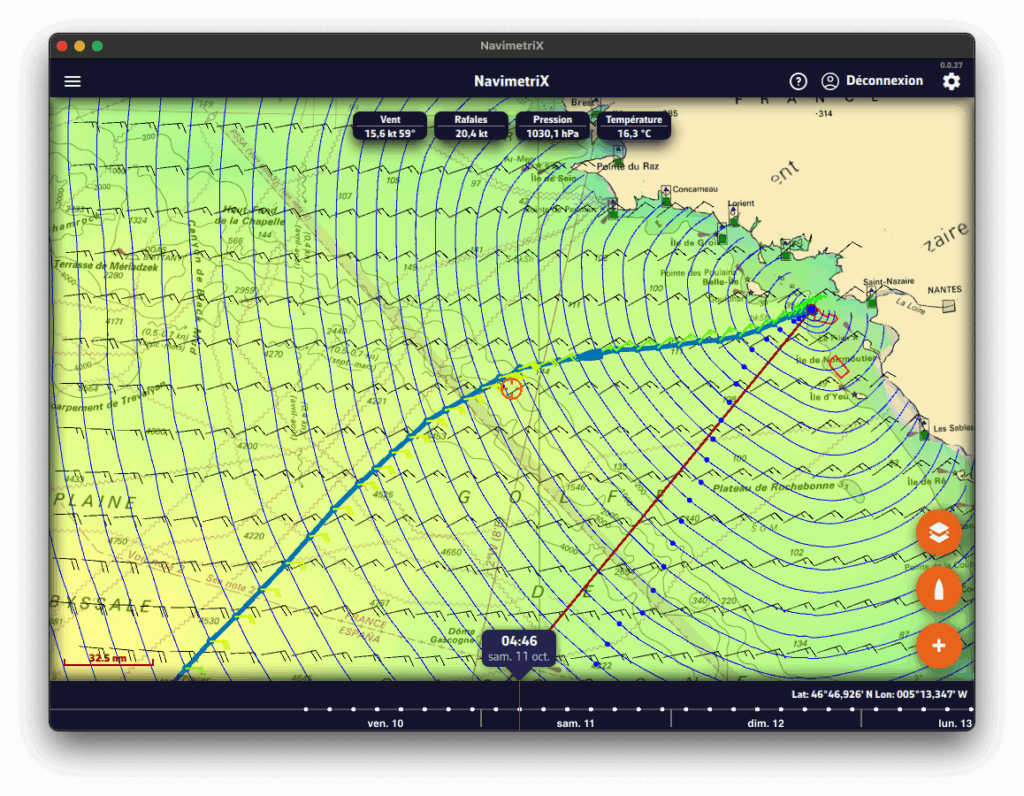
You can move the boat along the route in two ways:
- by dragging the timeline,
- or by tapping directly on the routing at the desired location.
At each intersection between the optimal route and an isochrone, a wind barb is drawn. It indicates the strength and direction of the wind at the moment the boat reaches that position. This is the average wind speed on the isochrone, i.e., the average true wind speed (TWS) used for the routing calculation, which is therefore interpolated geographically and temporally. This is the value found in the routing table. If you are routing with a current, a current arrow is also drawn according to the same principle as the wind. Dots also mark the start, the finish, the waypoints, the tacks and the gybes.
Routing list
Open the left drawer (chevron handle on the left edge of the screen) and select the Routings tab. This tab lists all computed routings.
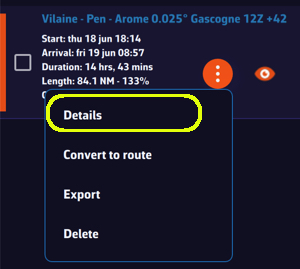
For each routing you’ll see:
- The routing name, shown in a specific color (matching the route color on the chart).
- Departure and arrival times.
- The total duration of the routing.
- The length of the optimal route and its ratio, as a percentage, to the length of the route you drew.
- The calculation timestamp.
- An orange "kebab" button that opens the routing menu: Details, Convert to route, Recalculate, Rename, Export (Share on phones and tablets) and Delete. "Details" opens the routing table.
- An eye icon to show/hide the routing on the map.
The routing table and its tabs
Press the orange button, then "Details", to open the routing table. It contains four tabs, each presenting a different facet of the computation. For an ensemble routing, a fifth tab, Ensemble, presents the results of the members.
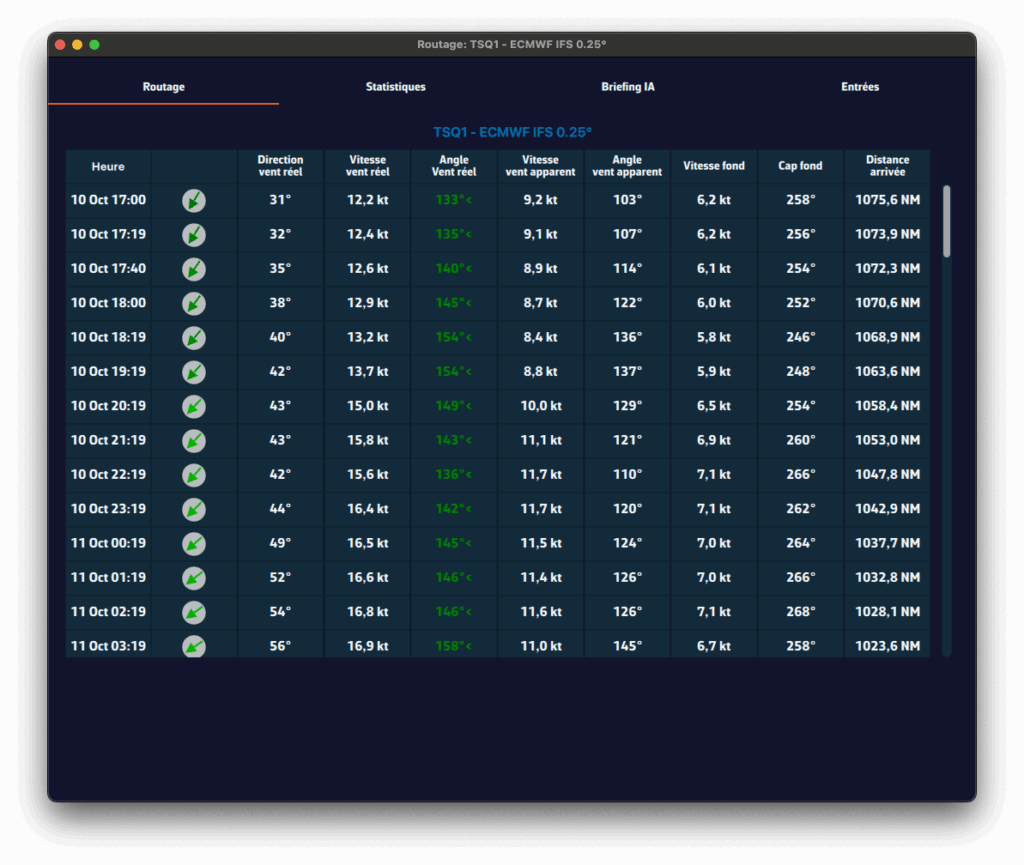
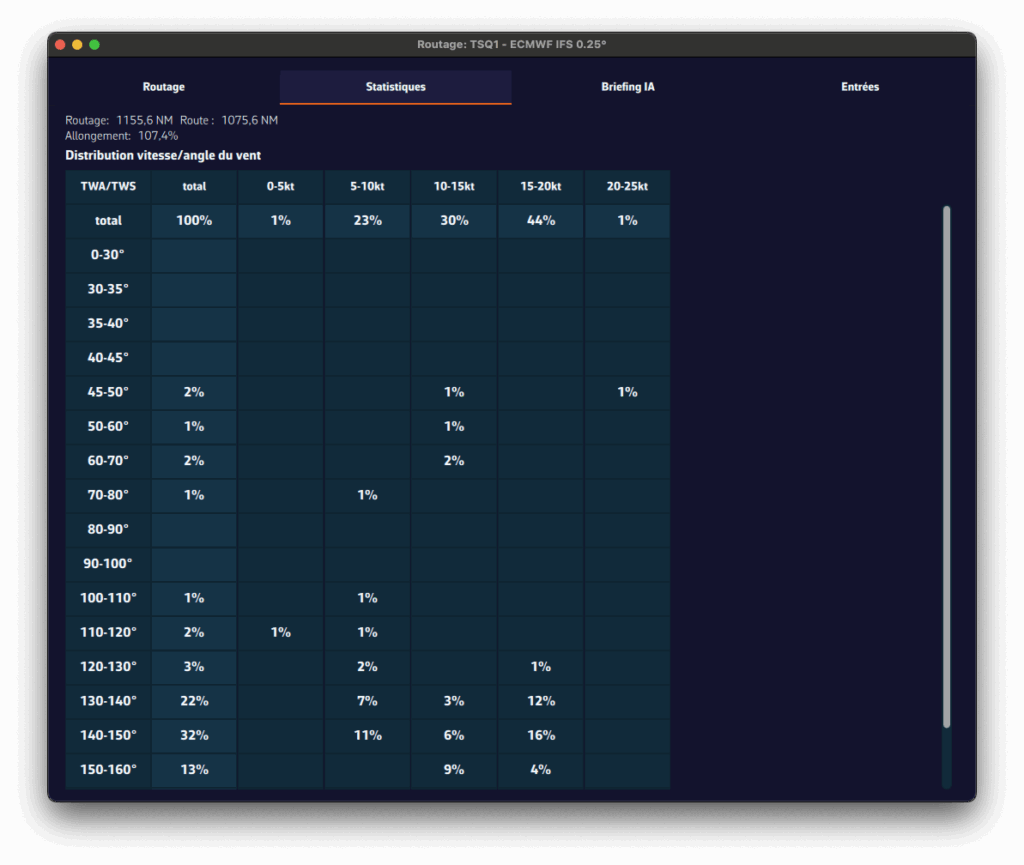
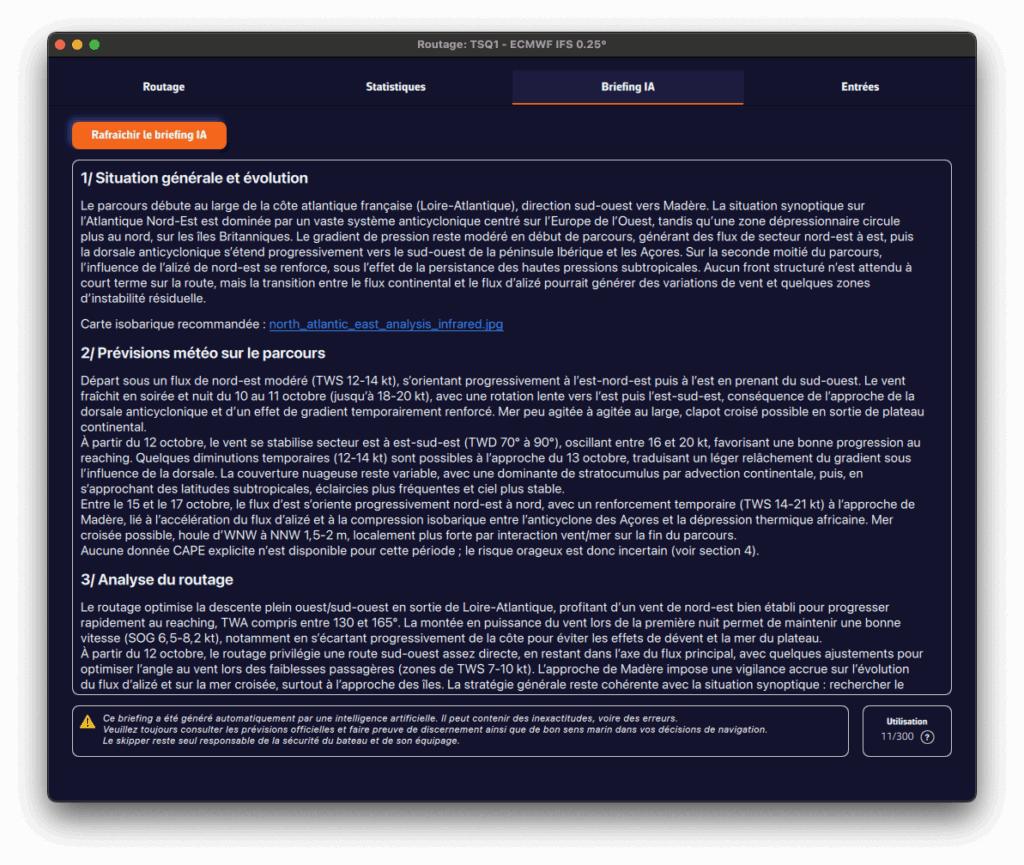
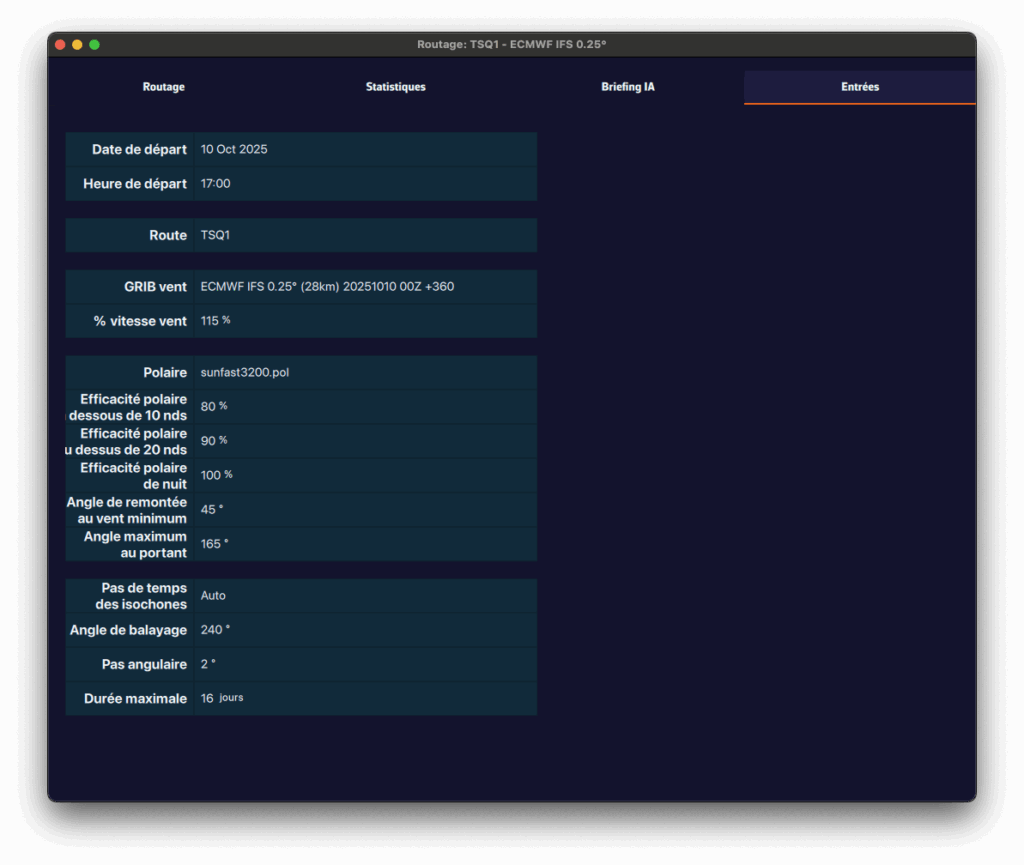
- Routing tab
- Shows, for each isochrone, the boat parameters at that time: speed, wind angle, position, etc.
- Statistics tab
- Displays the distribution of speeds and wind angles encountered during the routing.
- Helps you see whether you’ll sail mostly upwind or downwind, and assess the average wind strength.
- If the polar has a Sailchart, the Sail usage block gives, for each sail, the share of time, the duration and the distance sailed.
- AI briefing tab
- Automatically generates a weather briefing using our AI.
- When you click "Request AI briefing" ("Refresh AI briefing" once a briefing exists), the routing data are sent to our AI server.
- The AI returns a complete briefing with four sections:
- 1. General situation & evolution
- 2. Forecast along the route
- 3. Routing analysis
- 4. Weather risks
- It also includes links to synoptic charts and to the Météo-France bulletin.
- The AI Briefing is a Premium feature. Generation uses AI servers billed per use. Each Premium subscriber has a credit of 300 AI briefings per year, calculated on a rolling 365-day window.
- ⚠️ Warning: this briefing is generated automatically by artificial intelligence. It may contain inaccuracies or errors. Always consult official forecasts and exercise sound judgment and good seamanship in your decisions. The skipper remains solely responsible for the safety of the vessel and crew.
- Inputs tab
- Summarizes all parameters used for the computation: weather models, coefficients, constraints, penalties, sail set and departure settings.
- For a routing run again with "Recalculate", it shows what has changed compared with the original routing.
A pivot point is a location you want the routing to pass through.
It’s a very useful way to quickly compare routing options.
For example, in this case we’ll check whether it’s better to pass inside or outside the Traffic Separation Scheme (TSS) off Cape Finisterre, a very common situation when sailing from the French Atlantic coast toward Madeira or the Canary Islands.
To perform a routing with a pivot point, first make sure the isochrones of the desired routing are displayed on the map.
Show or hide isochrones
- Open the left drawer (chevron handle on the left edge of the screen) and select the "Routings" tab.
- Click on the routing whose isochrones you want to display.
- A small orange bar appears to the left of the selected routing: the isochrones are now visible on the map.
- To hide them, click again on the same routing.
The "Isochrones" box of the layers menu must also be ticked: see How do I enable/disable the display of isochrones?
Create a routing with a pivot point on a phone
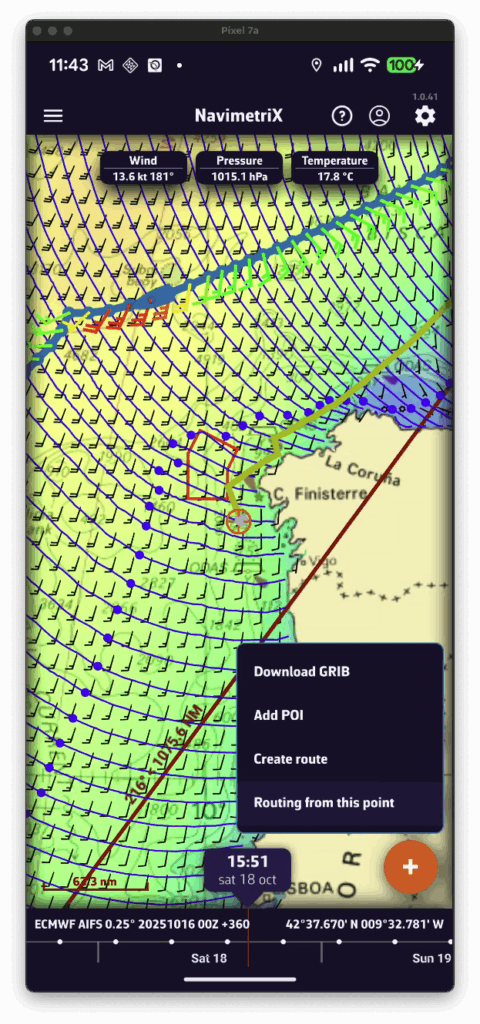
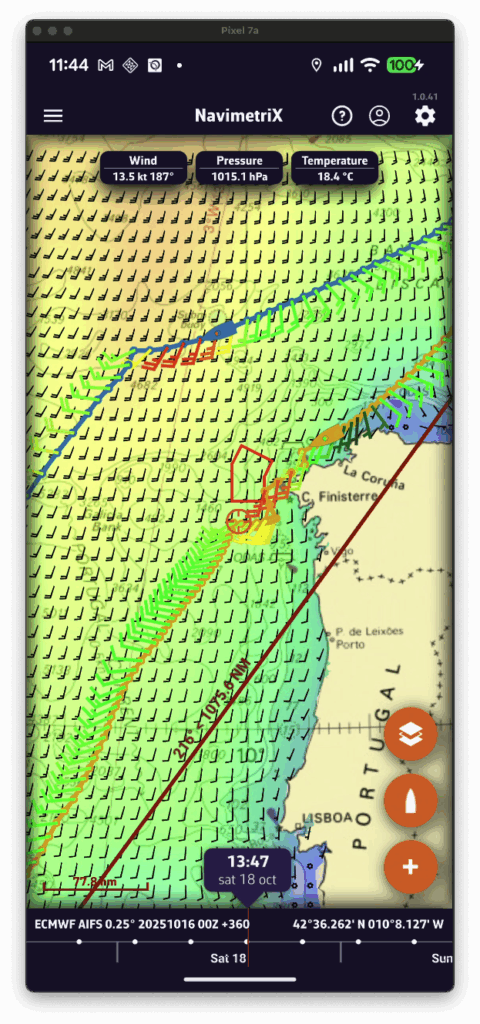
- Display the isochrones of the existing routing.
- Move the map: a yellow route automatically appears toward the centre of the screen. It represents the optimal route to the currently selected point on an isochrone.
- If you want to force the route to pass through that point, press the + button and select "Routing from this point" in the menu.
- A new routing is then computed starting from the selected pivot point.
Create a routing with a pivot point on a computer
- Display the isochrones of the existing routing.
- Move the mouse: a yellow route automatically appears toward the cursor position. It represents the optimal route to the currently selected point on an isochrone.
- If you want to force the route through that point, right-click on it and choose "Routing from this point" from the context menu.
- A new routing is then computed starting from the selected pivot point.
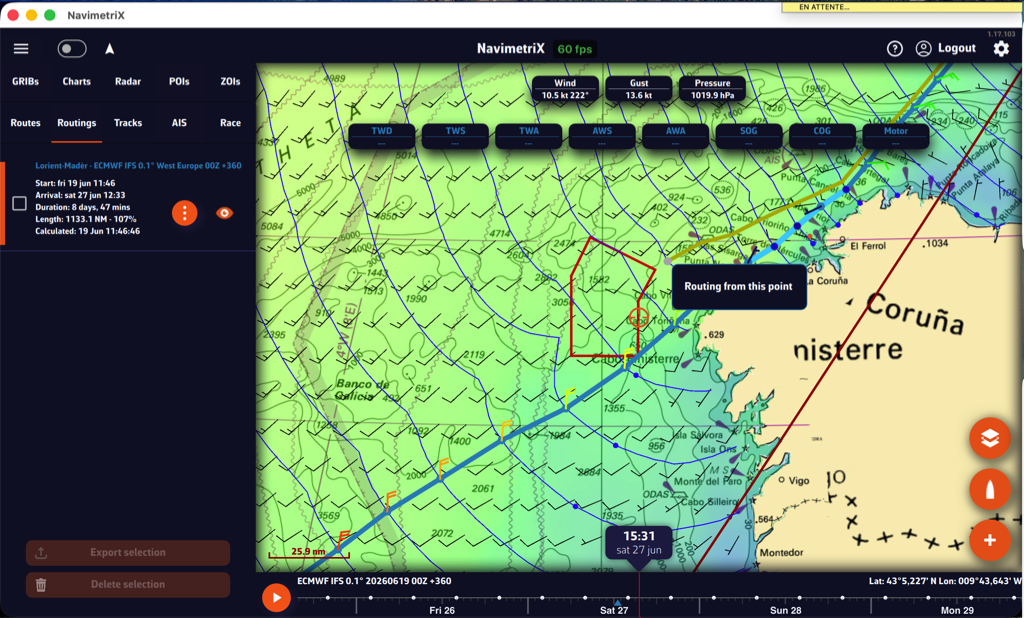
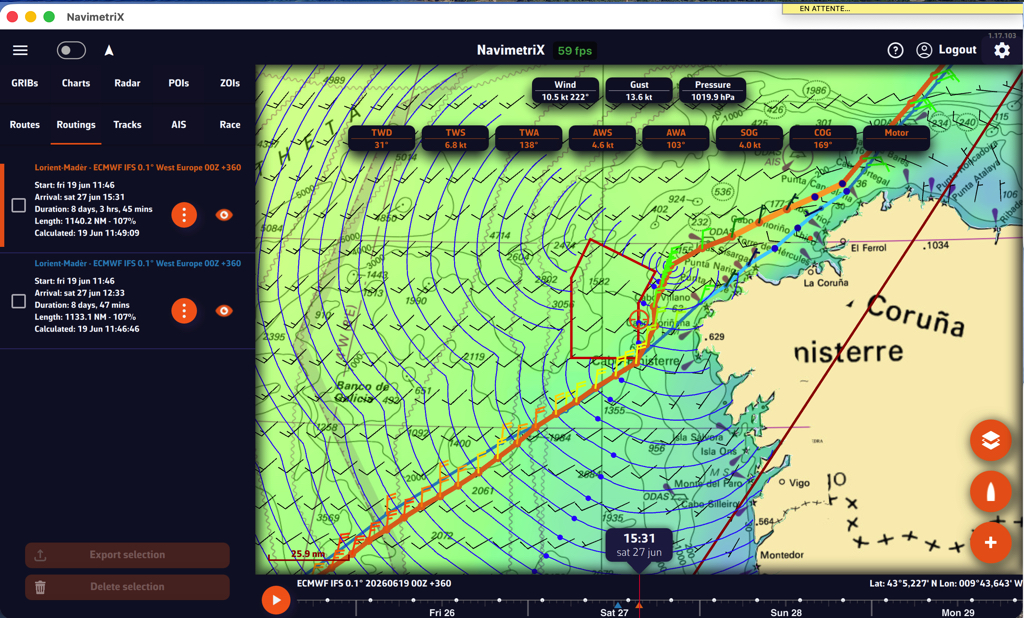
First you have to verify that Isochrones are checked in the Display section of layers menu:
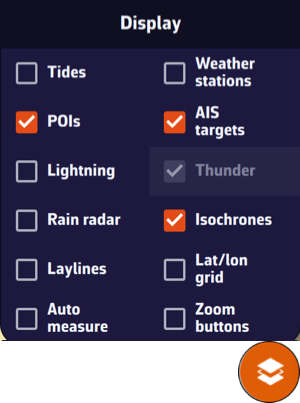
Then simply tap/click on the name of the routing in the sidebar:

When isochrones are displayed, you can use a pivot point.
You can easily convert routing into a route. In the left side panel, from the Routings tab.
Once the routing is complete, open the left side drawer (chevron handle on the left edge of the screen) and select the Routings tab.
Select the “kebab” icon and in the menu that opens select “Convert to route”:

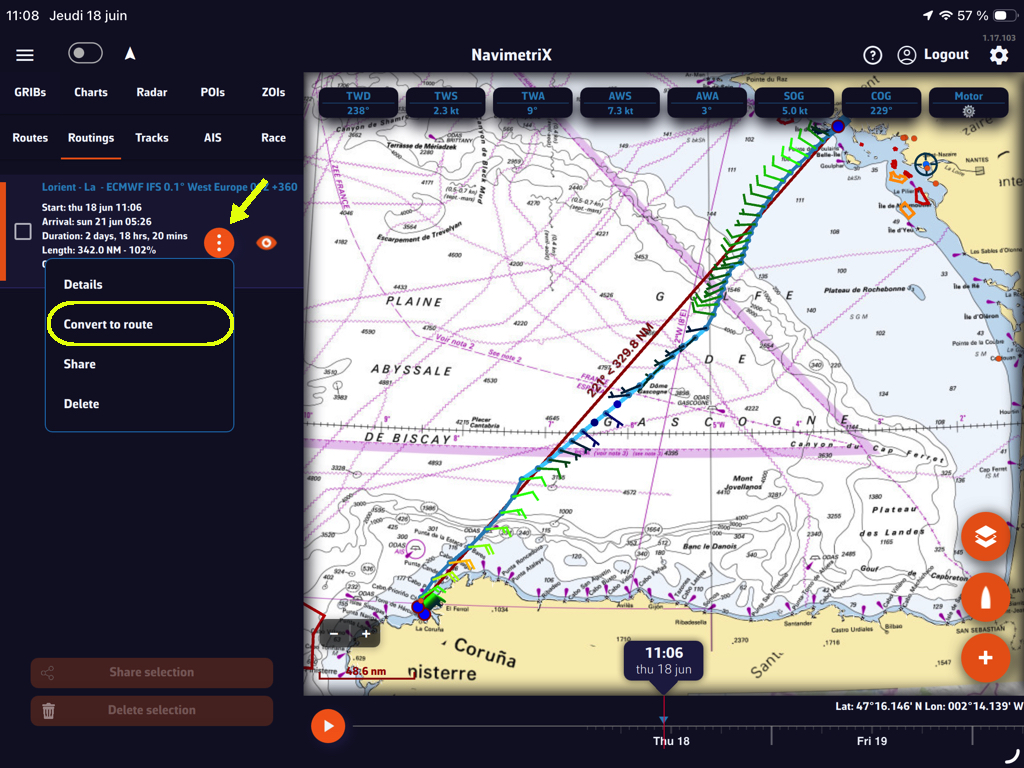
The following window suggests the name of the route derived from the routing, which you can modify, and displays the number of waypoints retained in the routing.
You have two adjustable options: heading tolerance and cross-track error (XTE). Select the “Create route” button and it will be displayed.
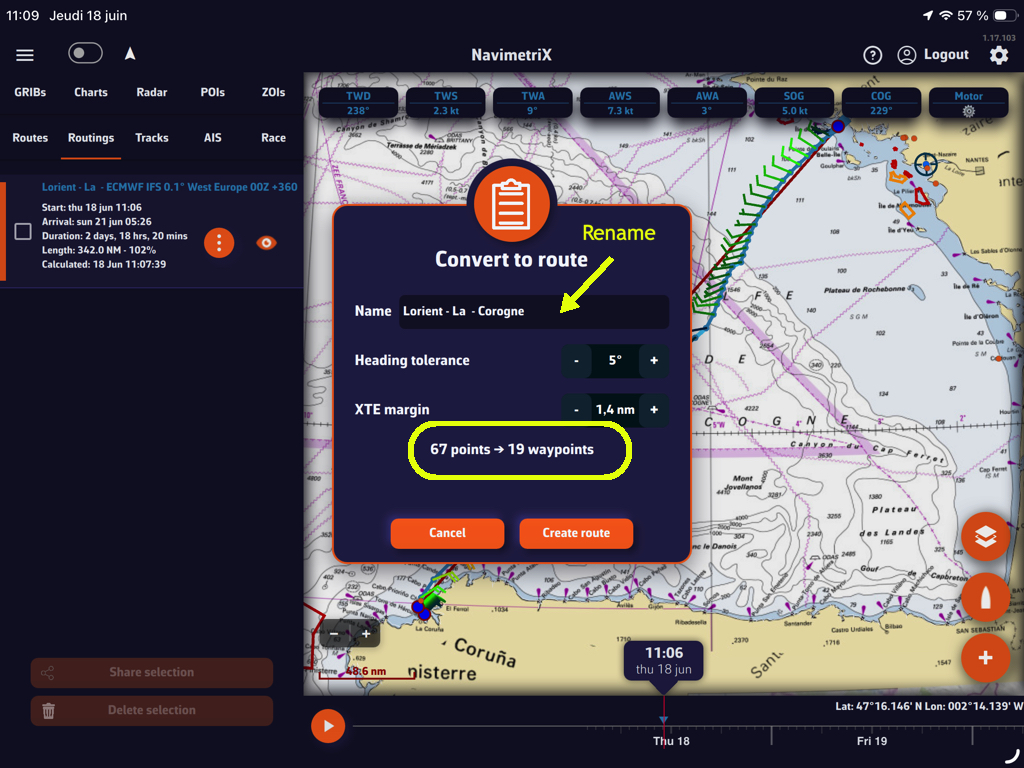
You can hide the display of the routing and the original route.
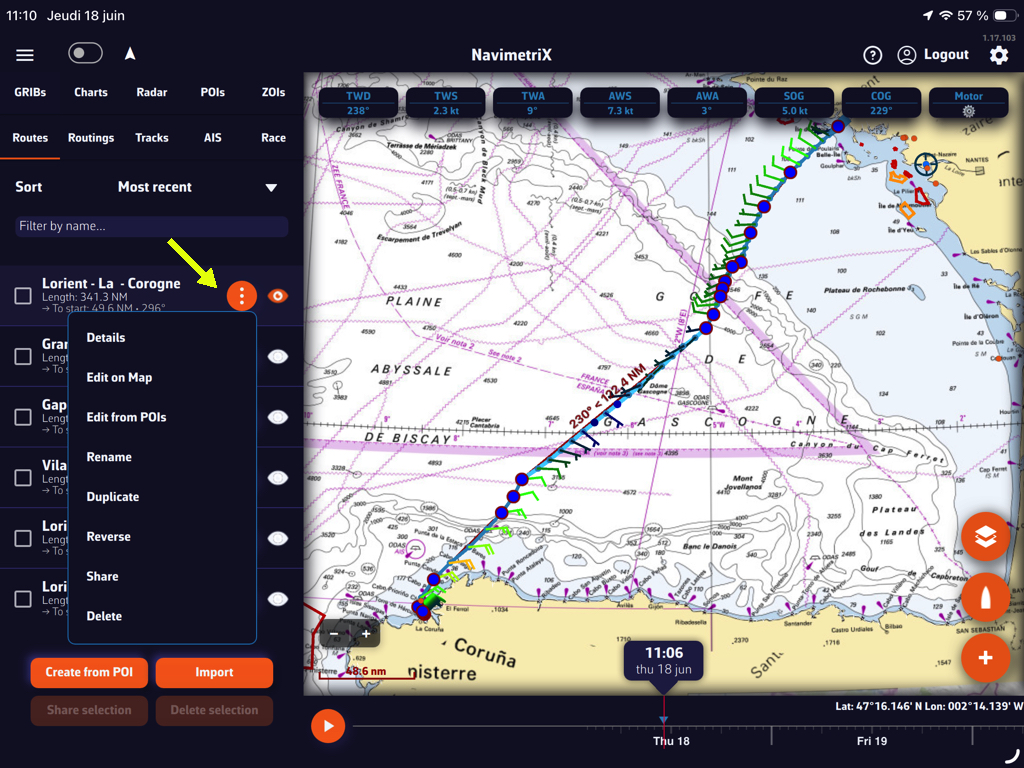
The “kebab” button in front of the created route opens a menu offering several options: route details table, modifications, etc.
You can display simulated navigation data all along the routing.
When isochrones are displayed, data labels in the same colour as the routing boat allow you to track progress along the route. In addition, clicking/tapping on each label displays the data graph from the start to the end of the route.
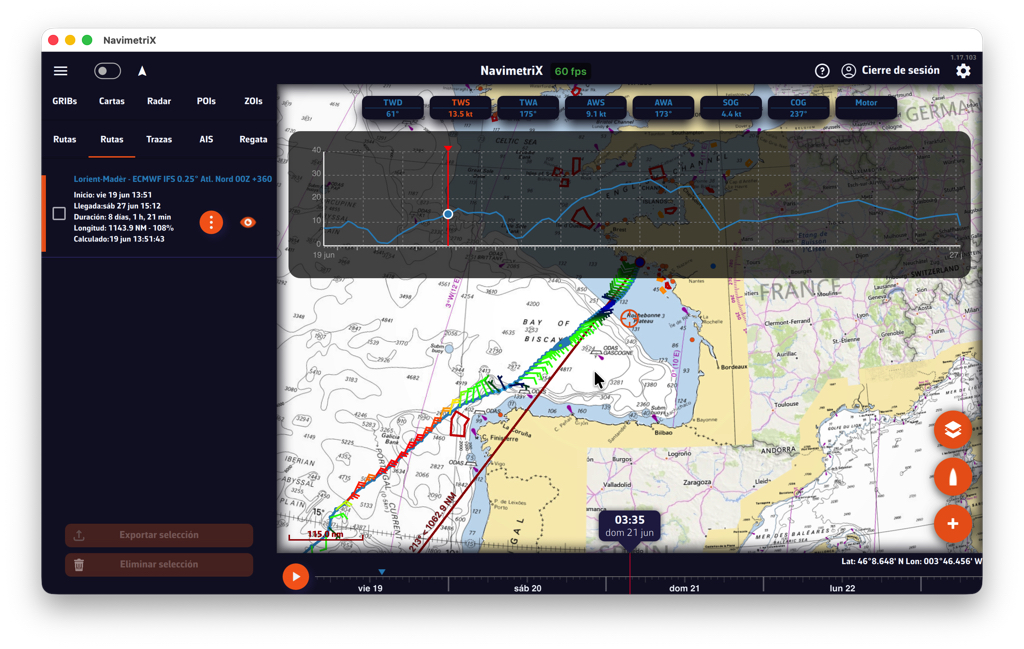
Scroll the boat along the route by dragging the timeline. A "Play" button at the start of the timeline allows automatic timed scrolling.
Tapping the "kebab" button opens an actions menu; the "Details" function opens the automatically generated routing table window.
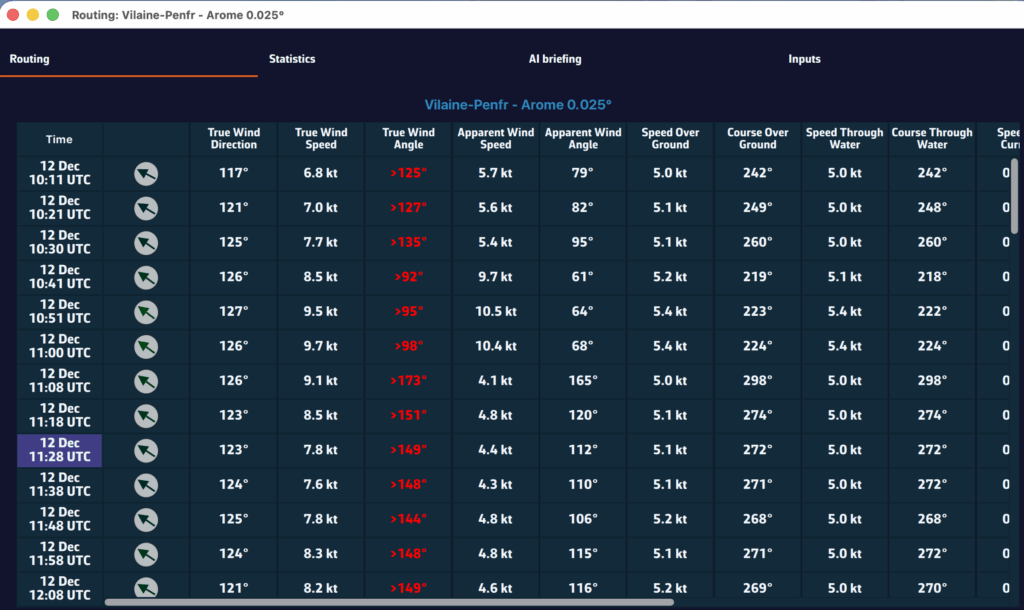
Principle
An isochrone ("same time") is a line joining all the positions the boat can reach in the same amount of time from its starting point.
To get from point A (the start) to point B (the finish), the routing applies the boat's speed polar to the forecast wind (speed and direction) and, if you selected them, to the current and the sea state. It takes into account the constraints you have set: zones to avoid, wind and wave limits, manoeuvre penalties, and so on.
How does it work?
- From the start, the app works out where the boat would be after one time step, for a large number of headings. The line joining these positions is the first isochrone.
- From the points of this isochrone, the calculation starts again for the next step, and so on until a point reaches the finish.
- The app then traces that point's path back to the start: this is the optimal route.
From each point, the headings tried cover the whole horizon every 5°, plus the key angles of the polar (best VMG upwind and downwind) and the heading that leads to the finish around the land. To keep the calculation fast, a point that reaches an area another point has already reached earlier is dropped.
The "Sweep angle" and "Step angle" settings of earlier versions are gone: this method no longer needs them.
The route found is then refined: the app removes needless course changes and moves the others as long as this brings the arrival time forward. This is why a tack on the route does not necessarily fall on an isochrone.
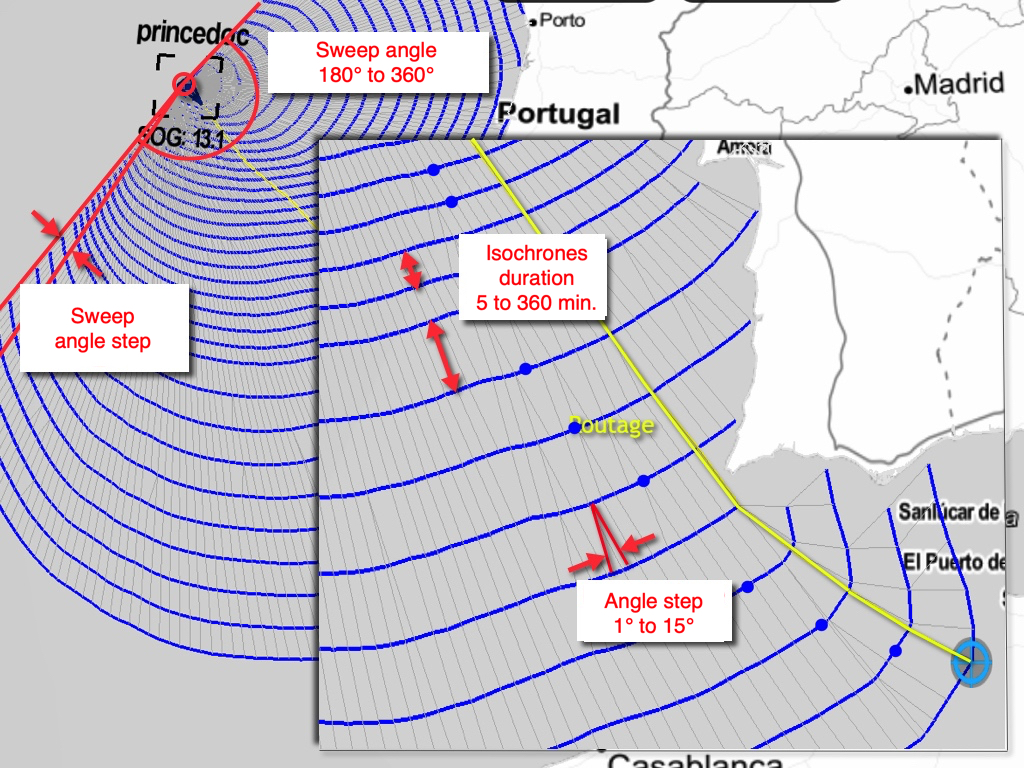
Isochrone time step
This is the time between two isochrones. It is set in the settings drawer, Routing section, "Isochrone duration" row: auto by default, or a fixed value of up to 360 minutes in 5-minute increments.
In auto mode, the app chooses the step itself: short at the start (20 minutes for the first hour), then longer and longer along the passage, up to 6 hours after five days at sea. It is also shortened on short route legs. We recommend keeping auto mode. A short step gives more accuracy but takes more computing.
The blue dot on each isochrone
On each isochrone, a blue dot marks the point the best route passes through. If the route does not pass through it, the dot marks the point closest to the finish, measured as distance over water. These points serve as pivot points to test another route option.
The other routing settings (polar, efficiencies, manoeuvre penalties, engine, zones, wind and wave limits) are described in How do I calculate a routing? What are the different settings?
Ensemble routing may seem impressive: 31 route calculations in a single operation with the GEFS 0.5° 30-day model, 51 calculations with the IFS ENS 0.25° 15-day model! In practice, it is as easy as a conventional routing. Here is how to do it, step by step.
Step 1: Download the GEFS model
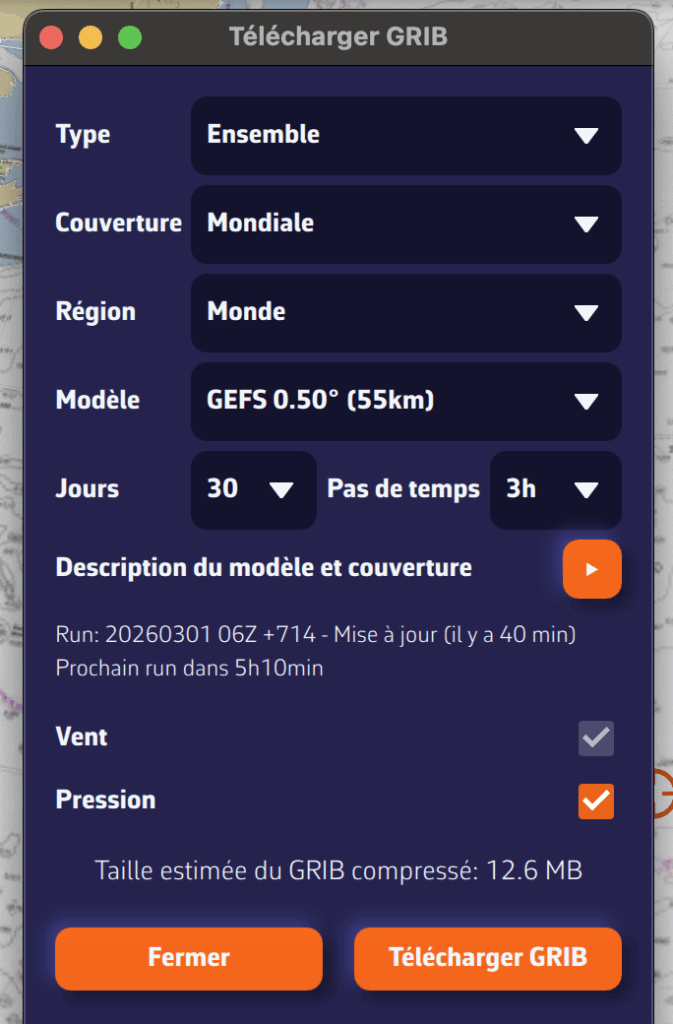
- Open the GRIB file download menu.
- Select:
- Type: Ensemble
- Coverage: Global
- Model GEFS 0.50° (ensemble).
- Choose the desired time period
- Press: Download GRIB
The average GRIB file downloads like any other model; you don't need to do anything special.
The process is the same with ECMWF’s IFS ENS 0.25° model.
Step 2: Configure and launch routing
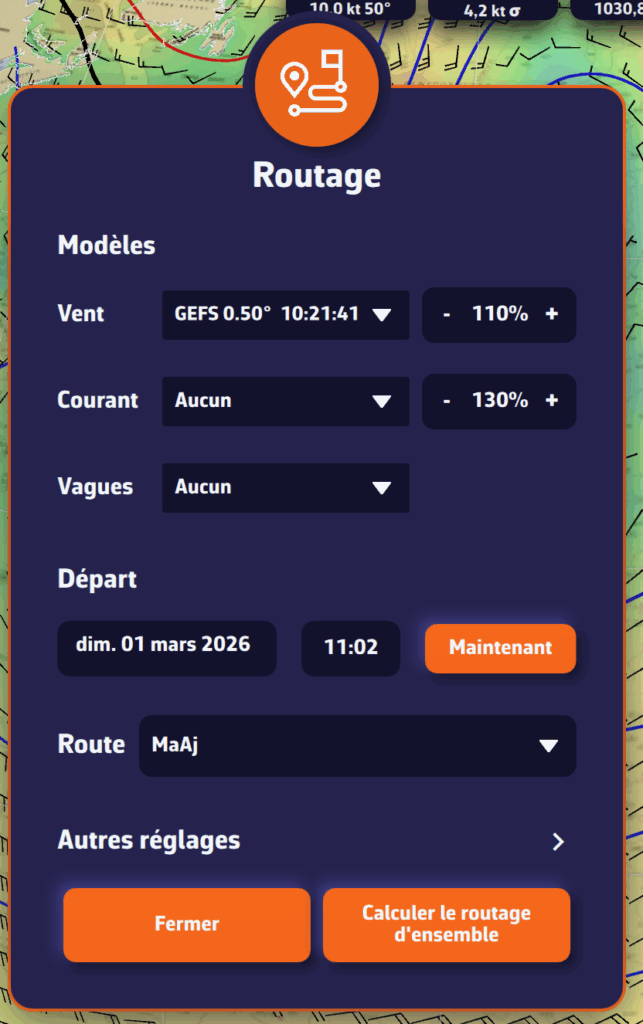
Open the routing window and configure your routing as usual: starting point, destination, ship's polar curve, start date and time...
NavimetriX automatically detects that you are using a GEFS or IFS ENS model based on the model downloaded. The calculation button changes to display "Calculate ensemble routing".
Start routing: NavimetriX handles everything!
- Download the control run (gec00) and calculate its optimal route
- Download and calculate the 30 perturbed members, one by one
- Combine the results and display them on the chart
The whole process is fully automated. Downloading each member takes only a few seconds, and route calculation is very fast. You can follow the progress in real time and see the routes appear one by one on the chart.
Step 3: Track progress
A compact progress panel appears at the bottom right of the screen. It displays in real time:
- The current phase: downloading or calculating
- The current member: "Member 12/30"
- A progress bar for downloads
You can cancel the operation at any time if necessary.
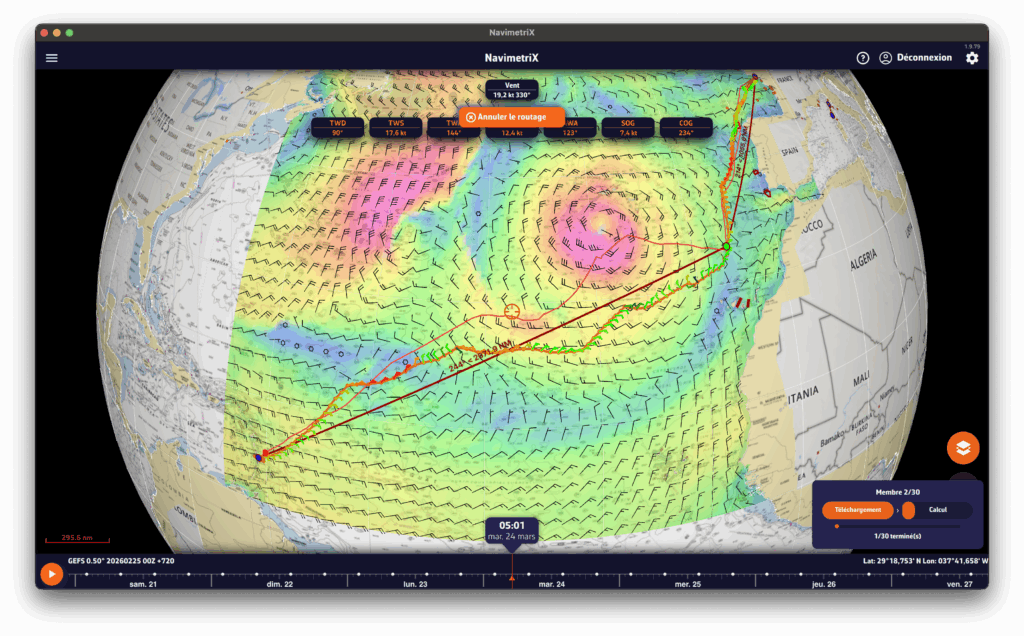
Interpreting the results on the chart
Once the calculation is complete, the chart displays two key elements:
The "spaghetti" routes
Each member is represented by a distinct colored line (the colors are distributed across the entire spectrum to differentiate them clearly). Together, they form a bundle of routes, hence the nickname "spaghetti". At a glance, you can see:
- Closely spaced routes = high confidence. Regardless of the weather scenario, the optimal route passes through the same location.
- Widely spaced routes = high uncertainty. The optimal route depends heavily on actual weather developments.
- Two distinct groups = two possible weather scenarios, with fundamentally different route strategies.
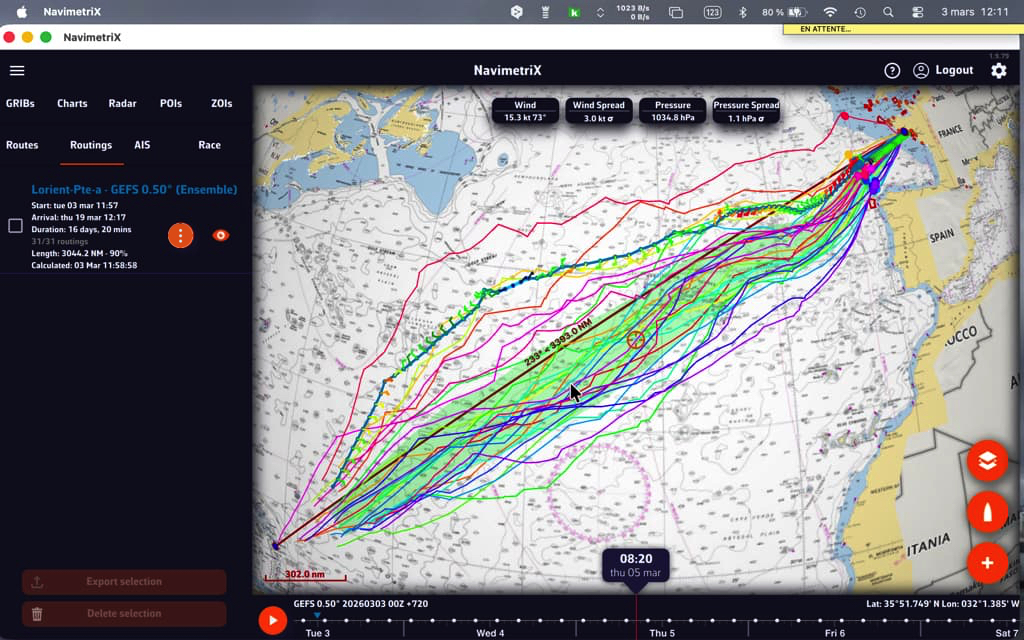
When the "spaghetti" routes converge, outside of waypoints, confidence is high.
The confidence corridor
Overlaid on top, a semi-transparent green corridor represents the range of ±1 standard deviation. Statistically, approximately 68% of routes fall within this corridor. The 20% of members furthest from the mean are automatically excluded from the calculation to prevent extreme scenarios from distorting the visualization.
The corridor gives you an immediate reading:
- Narrow corridor = reliable route, little variability between scenarios
- Wide corridor = high uncertainty, the optimal passage zone is vast
- Corridor gradually widening = confidence decreases over time (typical beyond 4-5 days)
Interpreting statistics
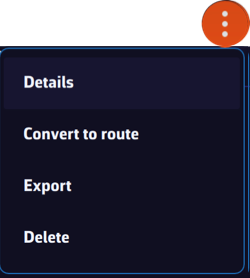
The "Details" function of the "kebab" menu opens the routing table. The Ensemble tab provides a detailed analysis of the 31 scenarios:
- Members who reached the destination: what percentage of the 31 scenarios allowed the destination to be reached? If only 60% reach it, this is a warning sign.
- Distribution of durations: minimum, maximum, average, and median duration. A large min-max spread means that timing is very uncertain.
- Arrival times (ETA): the earliest and latest, to plan your arrival at the port.
- Control run vs. ensemble average: if the control run is significantly faster than the average, the "ideal" forecast is probably optimistic.
- Histogram: visualization of the distribution of durations (or remaining distances if few members reach the finish).
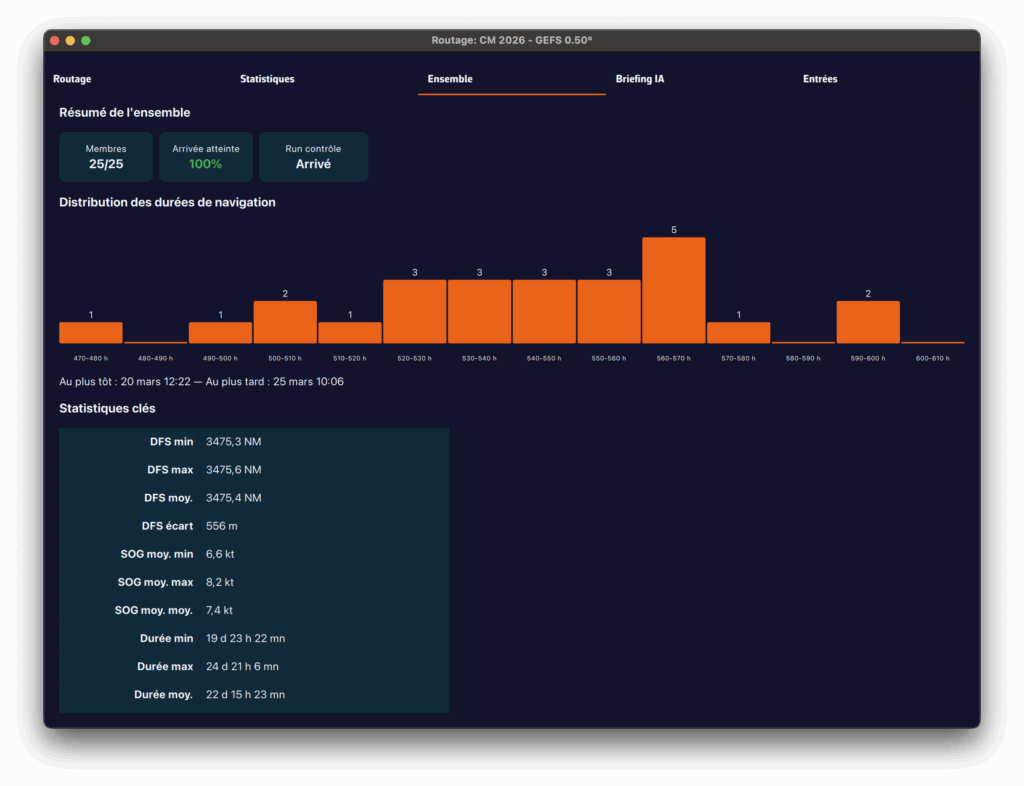
Practical tips
When should you use ensemble routing?
- Crossings lasting more than 72 hours: uncertainty accumulates over time, so ensemble routing makes perfect sense
- Unstable weather conditions: passing fronts, developing low-pressure systems, changing wind patterns
- Go/no-go decision-making: before a departure, ensemble routing helps you objectively assess the level of risk
- Medium- and long-term planning: for a crossing lasting more than 5-7 days, observe the daily evolution of member convergence
Best practices for reading:
- Don't look for "the best route" among the 31: look for the area of consensus
- Use the time slider to see how the routes diverge over time: the first few days are often close, then the gap widens
- Rerun the ensemble routing when new GEFS data becomes available (every 6 hours) to see if confidence increases or decreases
- Combine with the spread of wind and pressure displayed on the chart to identify areas of high uncertainty

Ensemble routing in NavimetriX transforms an analysis that was traditionally reserved for experts into a visual and intuitive tool. With a single click, you switch from a single forecast to a complete view of the range of possibilities, allowing you to navigate with confidence, even when the weather is not.
___
See also: What is an ensemble weather model and why is it useful for navigation?
NavimetriX allows you to select multiple atmospheric models for routing calculations. The principle is to combine multiple resolutions on a given route. This is particularly useful for offshore voyages.
How it works
Multi-GRIB routing works as follows: when several wind GRIB files are added, the application automatically selects the best GRIB for each point and each moment of the calculation, based on three priority criteria:
- The finest resolution first (a GRIB at 0.025° will take priority over a GRIB at 0.25°).
- At equal resolution, the most recent run is preferred.
- At equal resolution and run, the most recently downloaded file is used.
We therefore do not "mix" models, which would not make sense, but "chain" them according to the distance to be covered and the coverage of each model. The multi-GRIB option only works for wind models.
An example:
Let's consider a crossing of the Bay of Biscay, departing from Lorient and arriving in La Coruña. You can use an Arome 0.025° model for the departure, and an ARPEGE Europe 0.1° or ICON Europe 0.0625° model to take over if Arome expires before your arrival. This allows you to calculate a single route instead of two successive routes.
Implementation
After downloading the GRIB files needed to (broadly) cover your sailing area, and activating your route, tap/click on the quick action icon and select "Calculate a route":
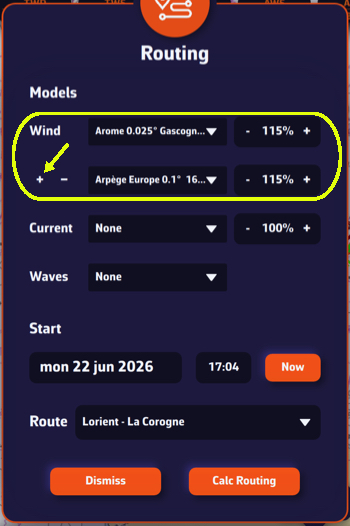
- Select the first "Atmospheric" wind model.
- Tap the small [+] button to select a second wind model with a longer or shorter lifespan than the first choice. The order of the models does not matter, the result will be the same.
- If necessary, select a wave model from "Sea State > Regional".
- If necessary, select a current model.
- Choose your departure date (note: not too far in the future).
- Check that the route is displayed correctly.
- Press the "Calculate Route" button.
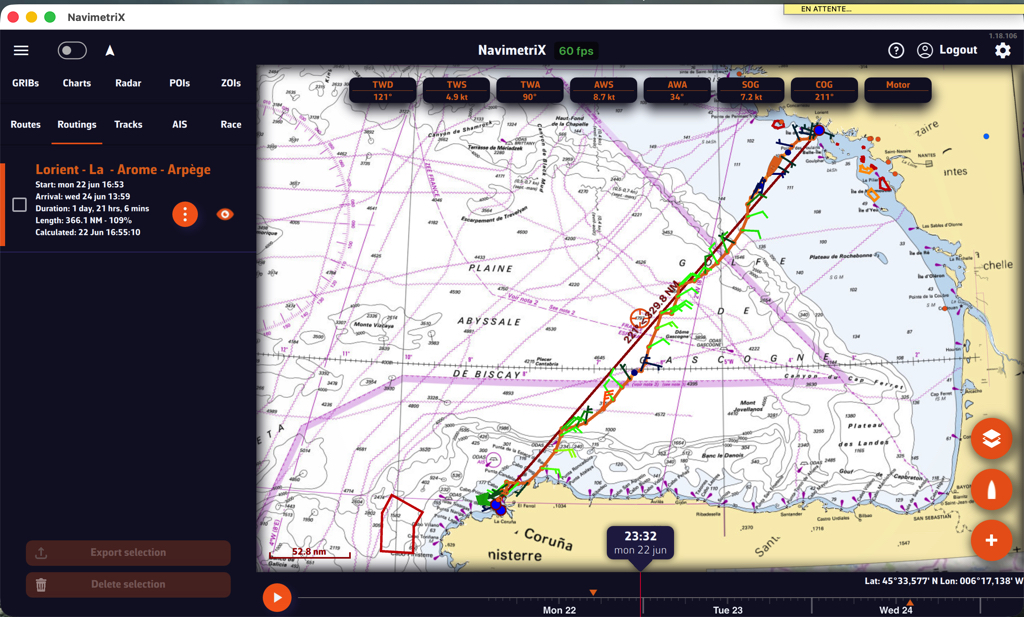
At the end of the Arome model, the routing continues with Arpège.
What is it used for?
The principle is to obtain the best possible resolution at the start of a voyage in order to refine the routing, and only reduce the resolution over the long term.
If we consider a transatlantic crossing, typical use is as follows:
- A high-resolution GRIB (e.g., Arome, Arpège) that covers your departure area with good accuracy but for a limited duration (24-48 hours).
- A low-resolution but long-range GRIB (e.g., GFS, ECMWF IFS) that covers the entire route over several days.
At the start, the routing will use the high-resolution GRIB (because its grid is finer). As soon as the boat leaves the spatial or temporal coverage of this first GRIB, the calculation automatically switches to the second GRIB, which covers the rest of the route.
Notes
1. If only the first GRIB file appears to be used, this may be because both GRIB files cover the same geographical area: in this case, the file with the highest resolution will always take priority across the entire common area.
Make sure the two GRIB files complement each other in terms of geographical and/or temporal coverage. For example, an Arpège Europe for the departure (high resolution, short duration) and a global GFS for the crossing (lower resolution, long range). Routing will then switch automatically from the first to the second once the boat leaves the area covered by Arpège.
2. If two models with the same resolution are used, for example ECMWF IFS 0.25° and GFS 0.25°, the most recent run will take priority when the calculation is launched (for example, GFS 06Z over ECMWF IFS 00Z).
Multi-GRIB is particularly useful when resolutions differ, for example Arpège Europe 0.1° for the coastal area combined with GFS 0.25° for the open sea.
For long distances, you can also use ensemble routing.
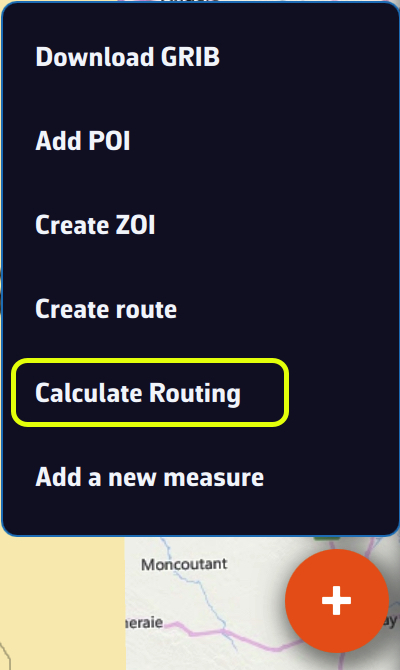
If you have deviated from your initial route, or if you have updated your GRIB files with a new run, you can calculate or recalculate a routing underway at any time.
From the boat's position, with the routing dialog
Press the + button and choose "Calculate Routing".
With a route already displayed:
- Select the desired GRIB file models,
- Under Start, turn on "Now from my position". This row only appears when the app receives a GPS position (the device's GPS or NMEA instruments). If you are following a route, it is selected automatically,
- In the "Next Waypoint" list, choose the next waypoint according to your progress along the route.
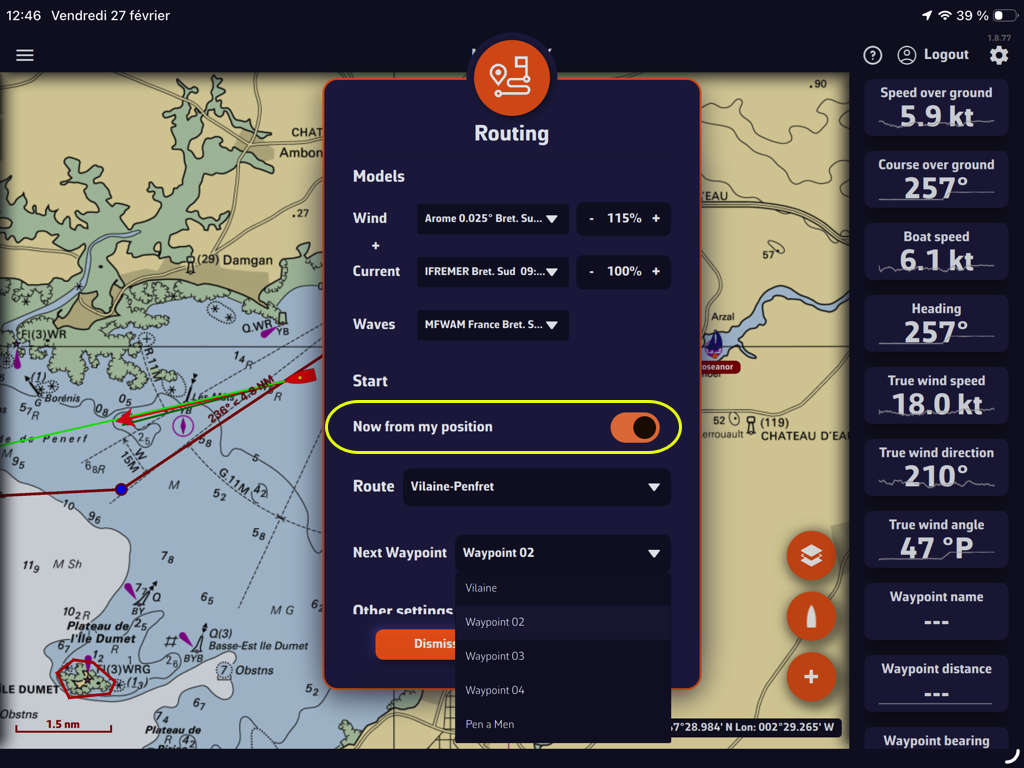
Then simply start the calculation as you would for any other routing.
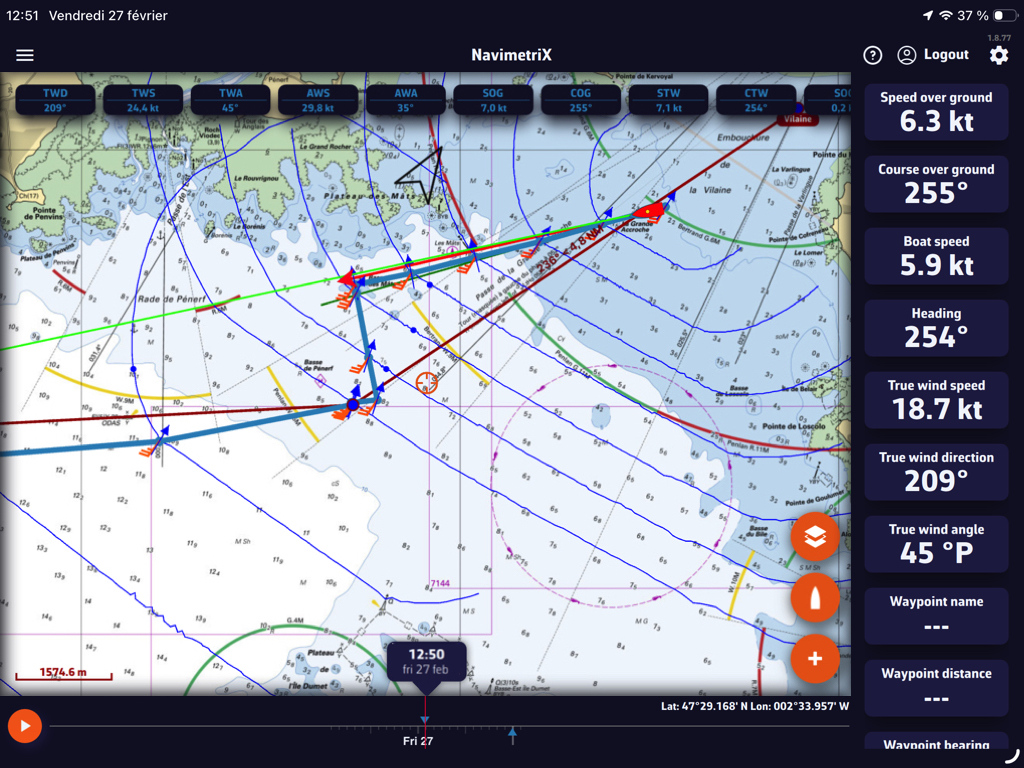
Running an existing routing again after a new run: "Recalculate"
In the Routings tab of the left drawer, the kebab menu (orange three-dot button) of a routing offers "Recalculate". The app takes the route, the weather files and the start time of that routing, downloads again the GRIBs that have a newer run, then runs the calculation again with your current settings. A routing that started from the boat starts again from the boat's current position, now.
The Inputs tab of the new routing then shows what has changed compared with the original routing.
When "Recalculate" is not possible, the entry is greyed out and the reason is shown below it: for example an ensemble routing, a routing calculated with several wind files, a deleted route or no boat position.
Routing to a point on the chart
In Navigation mode (Premium), you can start a routing from the boat to a point, now, without creating a route:
- bring the point you want to reach to the centre of the screen, under the crosshair, then press + and "Route to the target";
- on a computer, you can also right-click on the chart and choose "Route to this point". The point becomes a POI.
The calculation uses the wind file displayed on the chart, otherwise the one of the last routing, and your current routing settings. If something is missing (Navigation mode, boat position, wind file), a message tells you.
The menu of a POI also offers "Route to this POI": the routing dialog opens on a route from the boat to that POI.
A Sailchart answers one question, for every pair of true wind angle (TWA) and true wind speed (TWS): which sail are we carrying? It is the digital form of the table a sailmaker hands over with a set of sails, and which racing software also calls a crossover.
What it changes, and what it does not
The key point: a Sailchart never changes your boat's speed. That speed comes from your polar, and from nothing else. The Sailchart adds identity: it names the sail carried on each leg.
Once a Sailchart is in place:
- your routing legs can be coloured by sail;
- the routing table names the sail for each step;
- the statistics tell you how long and how far you sail under each one;
- the router can charge a sail-change penalty, just as it charges a tack or a gybe;
- under way, an instrument tells you which sail to carry now.
Without a Sailchart everything keeps working exactly as before: your routing is identical, simply without sail names.
How it is built
The Sailchart is a grid: rows are wind angles, columns are wind speeds, and each cell holds a sail name.
A cell stands for a band, not a point: the cell placed at 12 knots holds from 12 knots up to the next cell. You therefore do not need one cell per knot: a few well-placed bands are enough, exactly as on a sailmaker's paper table.
Overlaps
In real life two sails are often equally good across a transition band. A cell can therefore carry a primary sail and one or more alternates, written J2|C0.
This matters for routing: if the boat already carries one of the sails the cell allows, it keeps it and pays no change penalty. That is what stops a routing sending you up the mast to cross a two-knot band.
A Sailchart belongs to one polar and follows it everywhere, including when syncing between your devices.
To create one: How do I create my boat's Sailchart?
A Sailchart belongs to a polar, so you open it from the polar:
- My boat tab, then tap the selected polar.
- On the polar's row, open the menu (three dots).
- Choose Sailchart…
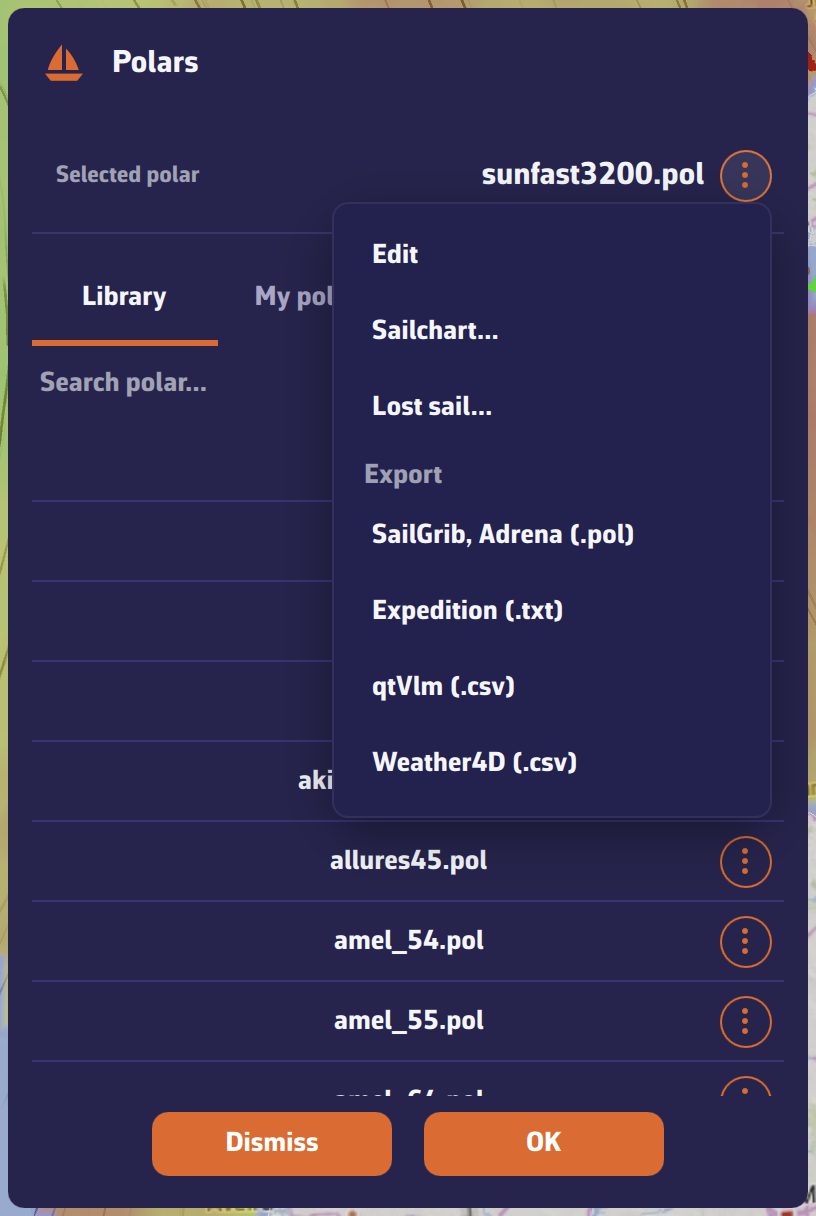
Starting from something
If the polar has no Sailchart yet, the app offers two starting points:
- A usual sail set: Main + furling genoa (cruising), White sails (main + genoa), Main + genoa + asymmetric spinnaker, Main + genoa + symmetric spinnaker, or Racing (Sun Fast 3200 style). These are complete, plausible Sailcharts that you then correct.
- Another polar's Sailchart, if you have already painted one: handy when you keep several configurations of the same boat.
You can also import the Sailchart your sailmaker gave you.
Painting
The editor has two layer tabs: “Headsails” (the layer the routing reads) and “Mainsail” (the mainsail and its reefs). It works like a paint bucket:
- pick a sail in the palette at the top: it becomes the brush;
- tap a cell to paint it (on a computer you can also drag the mouse);
- tap a row or column header to fill the whole band at once;
- “Edit” changes or deletes the selected sail, “Add” creates a new one (a code already taken is refused);
- “Erase” is a brush: while it is active, tapping a cell empties it;
- “Alternate” adds a second sail to the cell instead of replacing the first: this is how you declare a transition band;
- “Undo” reverts the last gesture.
A long press on a sail chip also opens its editing: code, full name and color.
Adjusting the grid
The “Bands…” button opens the “Angle and wind bands” window: + row / − row and + column / − column add or remove angle and strength bands. You can place a band at any value: if your genoa gives way to the solent at 17.5 knots, place the band at 17.5.
The two views
The Grid tab shows the table. The Polar tab shows the same Sailchart in polar coordinates, both tacks mirrored: the way sailmakers draw it, where the shape of each region reads at once. Single sail fills only the chosen sail and leaves the others as outlines, which makes overlaps legible.
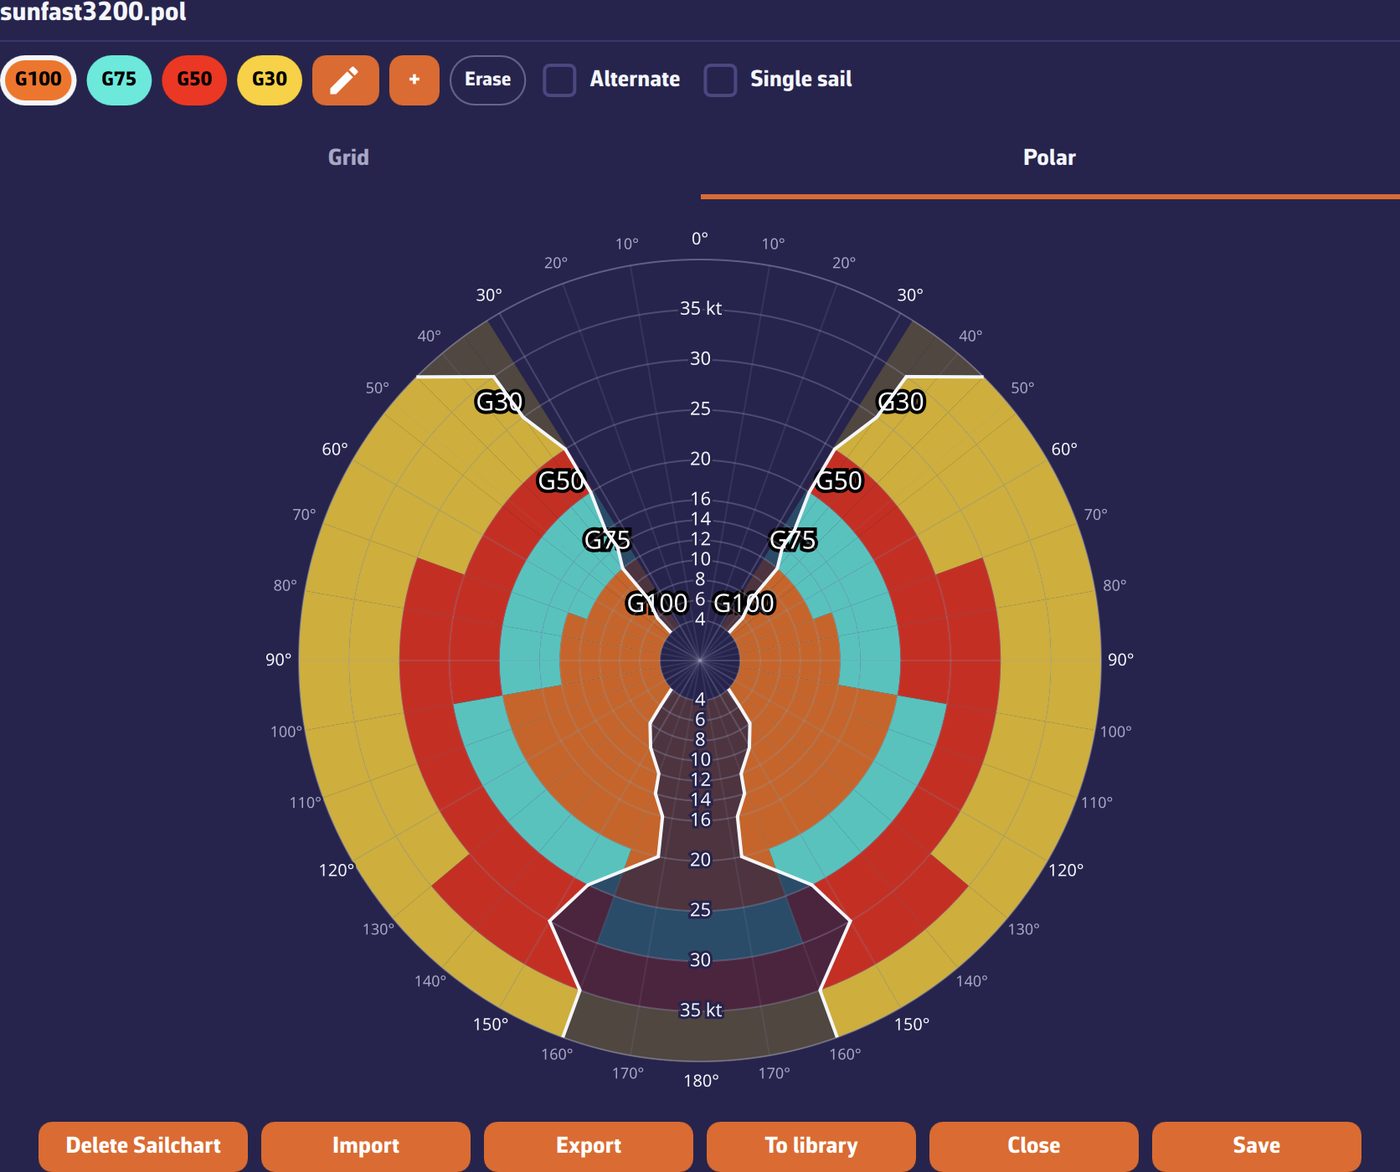
Nothing reaches the disk before Save. Delete returns the polar to having no Sailchart at all, that is, to the previous behaviour.
If your sailmaker gave you a crossover, you do not have to redraw it. Open My boat → the polar → menu → Sailchart…, then the Import button.
Accepted formats
- .sail: the NavimetriX and SailGrib format, an angle × speed grid with one sail name per cell;
- .txt: Expedition's crossover table, same structure;
- .se: an Adrena Sailect crossover.
The Adrena case: select every file
A Sailect crossover is not one file but a set of files: one per sail, each carrying its own region. In the file picker, select them all at once: a single file would give you a single sail.
The app then rebuilds one Sailchart: it reads the outlines your sailmaker drew, places the bands on their real boundaries, and takes over each sail's code, type and colour. Where two regions overlap, the cell gets a primary sail and its alternate.
Giving your Sailchart away
The Export button (Share on a phone) offers two formats:
- NavimetriX format: keeps the alternates of transition bands;
- Compatible format: writes only the primary sail of each cell, for software that reads a single name per cell.
On a computer the file lands in your Downloads folder; on a phone the share sheet opens.
Note: NavimetriX reads Adrena crossovers but does not produce them. The aim is to let you arrive with the data you already have, not to make the round trip.
A sail torn at sea changes your polar: where you used to carry it, you will now be slower. NavimetriX lets you say so in seconds.
- My boat tab, tap the selected polar.
- Polar menu, entry Lost sail…
- Choose the sail you have just lost.
The app then shows you the affected regions (those where that sail was prescribed) and offers a slider: what percentage of your speed do you keep there, with what is left on board. The default is 90 %.
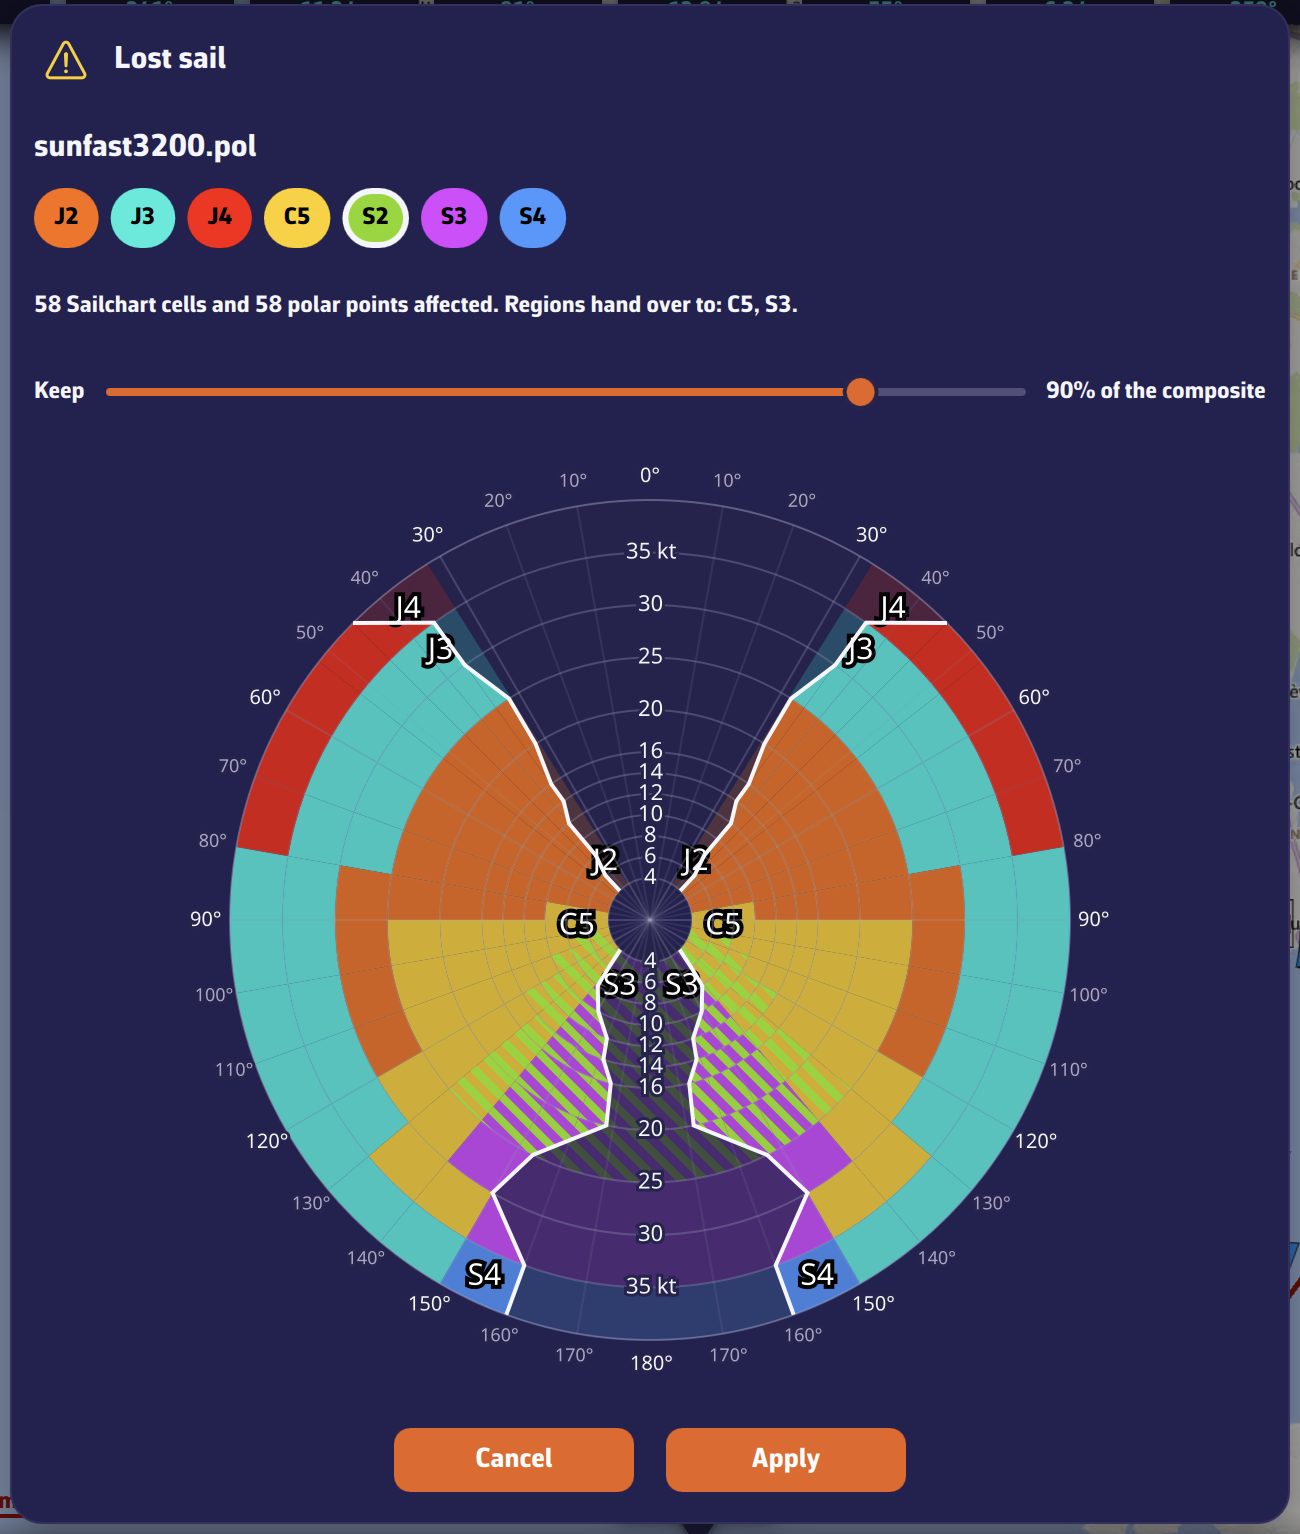
What happens next
NavimetriX creates a new polar, named for instance my-boat (without S2).pol, and selects it. Its Sailchart is adjusted at the same time: the lost sail's cells fall back to the cell's alternate if it had one, otherwise to the neighbouring region's sail.
Your original polar is untouched. Once the sail is repaired, simply select it again.
This needs a Sailchart: without one, the app does not know where you carried which sail.
Until now, correcting a polar meant a spreadsheet and a round trip through files. NavimetriX now ships a full editor: My boat → the selected polar → Edit.
The principle is simple: you do not type speeds. You drag points on a curve, look at the result, and go again. Typing raw numbers into a table is the surest way to build a polar full of bumps.
The five views
- Curves: the polar for one wind speed. Grab a point and pull it; the neighbouring wind speeds stay on screen as ghosts to keep you honest. Best-VMG angles upwind and downwind are marked live.
- Slice: speed against wind strength, at one angle. This is the view that reveals a curve edited out of family: a bump jumps straight out.
- Targets: best-VMG angles and speeds against wind strength. Smooth these first: they are the numbers you will read at the helm.
- Table: the grid, for inspection and bulk work (scale a column to 95%, add or remove a row or a column).
- Report: the automatic analysis, described in this question.
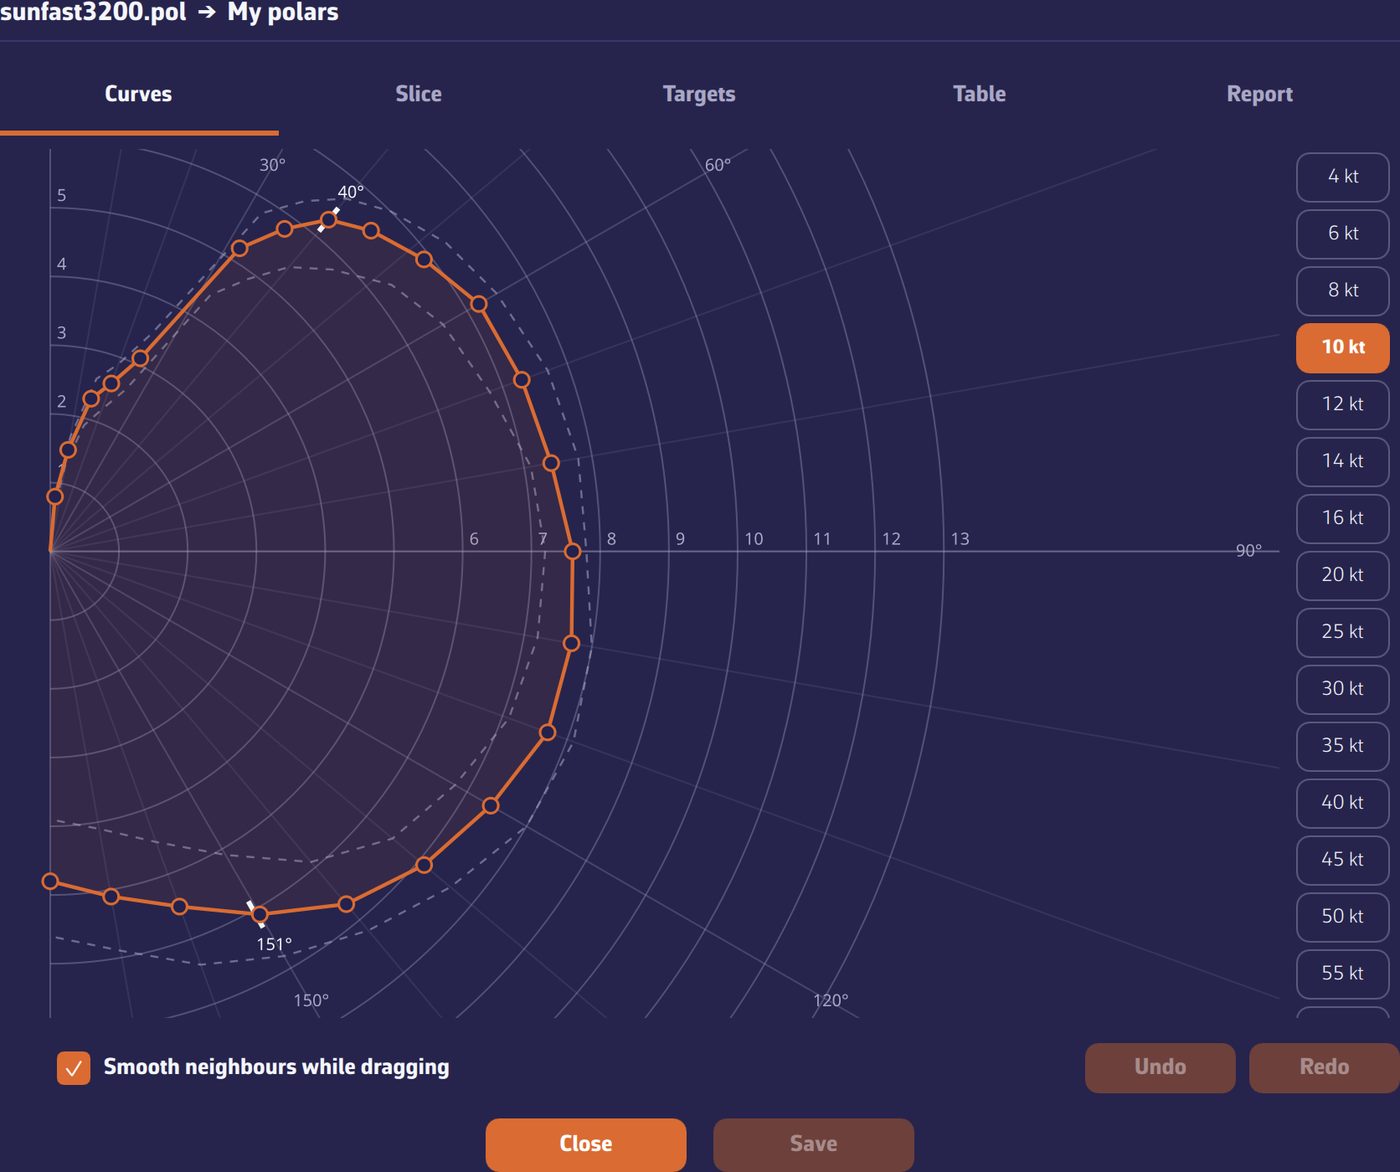
Smoothing
The Smooth neighbours while dragging box changes the nature of the gesture: instead of moving one point, you gently deform its neighbourhood (nearby angles and, at half strength, the neighbouring wind speeds). This is almost always what you want, because a real polar has no teeth. The −0.1 / +0.1 buttons follow the same setting.
Saving
A library polar is never overwritten: Save as makes a copy in My polars under the name you choose. If you are signed in, it syncs to your other devices.
On a phone the editor opens full screen and the wind-speed strip turns horizontal. You can grab a point from outside the curve, along the same radius, so your finger does not hide it.
The Report tab of the polar editor analyses the polar by itself as soon as you open it, with no button to press, and returns a score out of 100 with a list of observations. If you then change the polar, the analysis runs again the next time you open the tab. Each observation is clickable and takes you to the view concerned.
It works on three levels.
1. Internal consistency
What the polar says about itself: isolated spikes, curves crossing where they should not, targets progressing irregularly, a smoothness index that is too low. These are the defects a spreadsheet lets through and a routing amplifies.
2. Comparison against the fleet
Your polar is compared with the five nearest boats in the library, matched on raw speeds. Cells more than 30% away from those neighbours' median are highlighted in red in the Table.
Read this carefully: a gap is not an error. If your boat really is faster than its neighbours, that is normal. The report flags; it does not judge.
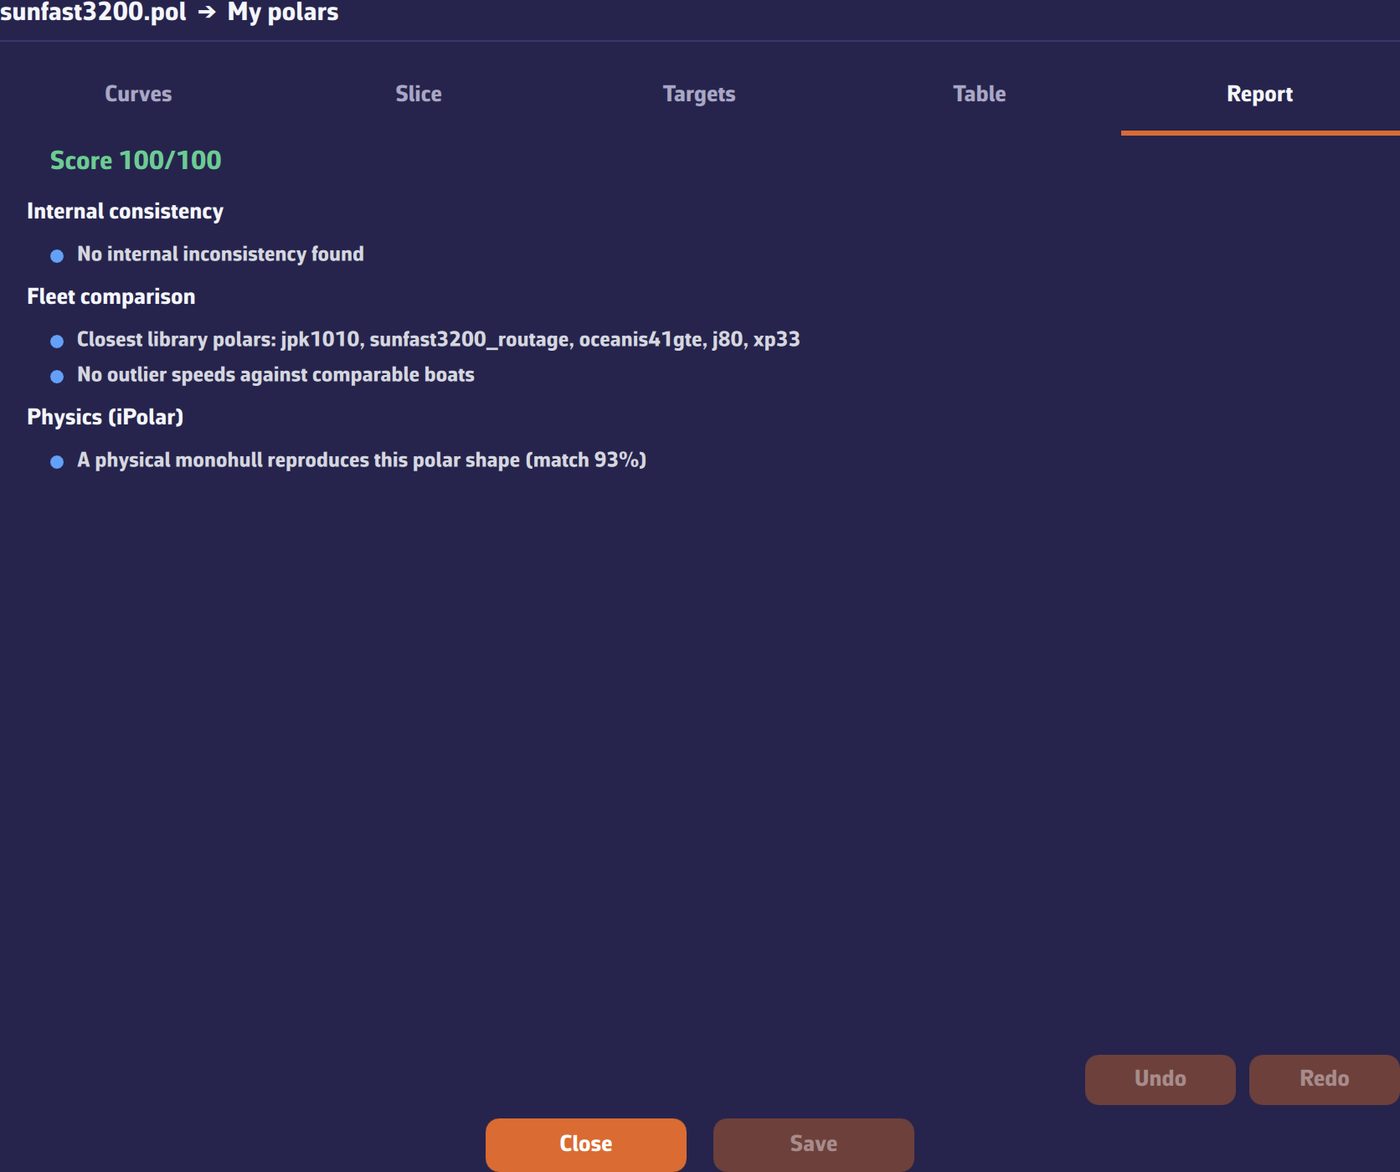
3. Physical plausibility
The last level compares the shape of your polar with what a monohull can physically produce, using the model that already drives our iPolar generator.
It answers one question and one only: can a real monohull produce this shape? It gives a percentage of agreement: below 85% it warns, below 75% it raises an alert.
What this level does not do: identify your boat or guess its dimensions. The inverse problem is mathematically unstable (length and speed scale cannot be told apart), and we preferred to show nothing rather than a wrong number.
This physical level only concerns monohulls. If your boat is declared as a Catamaran or Trimaran in My Boat (Type row), it is not applied and the Report says so: "Physics check not applicable to multihulls".
If your boat is ORC rated, its polar already exists: it is in the certificate. NavimetriX fetches it for you.
- My boat tab, tap the selected polar.
- Open the ORC tab.
- Type whatever you know: a sail number, a boat name, or a class name: "Sun Fast 3200" returns every rated Sun Fast 3200.
- Pick the certificate from the list and import.
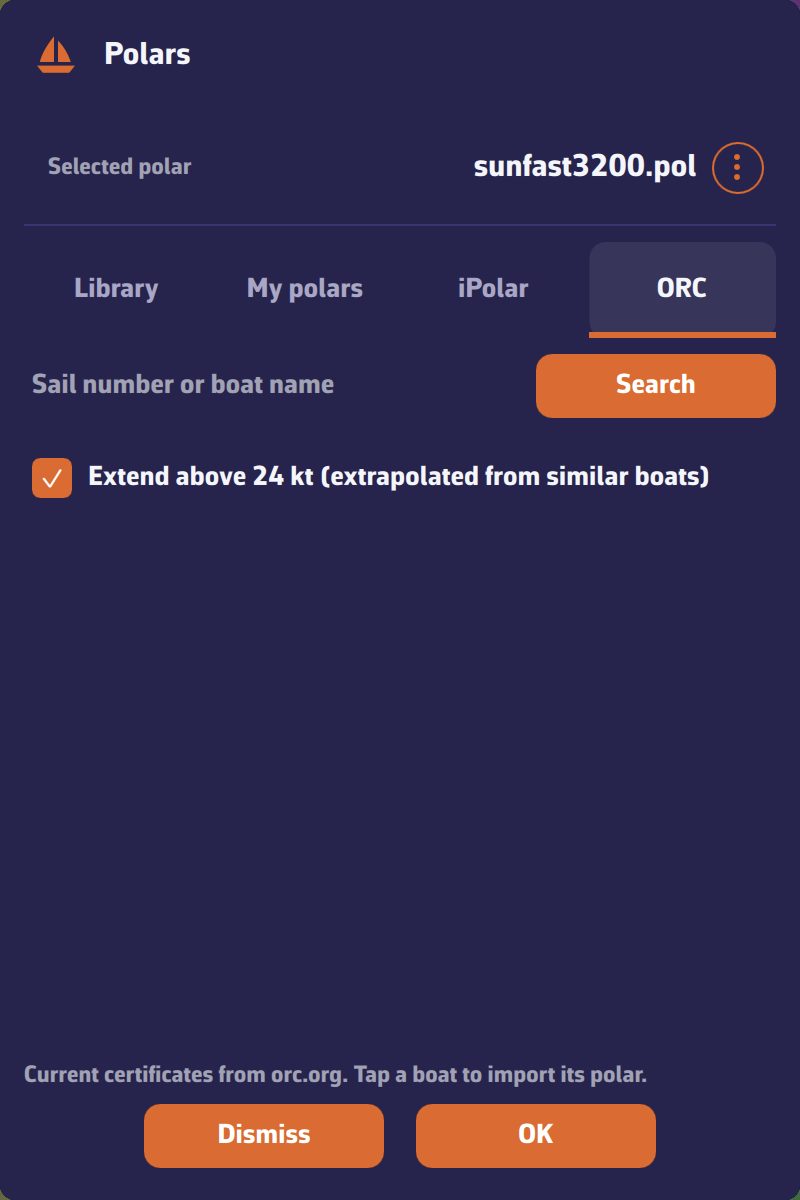
What you will see in the list
One boat can hold several certificates, and they are not equivalent: full crew, double-handed, non-spinnaker. The family is spelled out so you take the right one.
Beyond 24 knots
An ORC certificate stops at 24 knots of wind and starts at 4. A checkbox, on by default, extends the polar to 60 knots.
This is not blind extrapolation: the app looks in its library for the boats whose speeds most resemble yours over the shared range, then applies their heavy-weather behaviour. The generated columns are marked as extrapolated and stay editable.
The certificate's provenance (sail number, family, issue date, crew weight) is kept and shown with the polar.
On import
The polar picker's import button accepts .pol, .csv and .txt, and is deliberately tolerant about the content:
- angle × speed tables, whatever the separator (tab, semicolon, comma or runs of spaces), that is, the format used by Adrena, MaxSea/TimeZero, SailGrib, qtVlm, OpenCPN, Weather4D, LuckGrib or Squid;
- decimal commas as well as points;
- Expedition's pair format, one row per wind speed, ragged rows included;
- CSV files exported by ORC tooling, with their beat and gybe angle rows.
The file is converted to the app's canonical format; your original is kept alongside.
If anything deserves your attention (blank cells filled by interpolation, angles beyond 180° mirrored), a warning says so without blocking the import.
On export
A polar's export menu offers:
- SailGrib, Adrena (.pol): the tab-separated table, read by most software;
- Expedition (.txt): pair format, with targets inserted at their exact angles;
- qtVlm (.csv): semicolon table;
- Weather4D (.csv): comma table.
On a computer the file lands in your Downloads folder. On a phone the share sheet opens: send it by mail, by messaging, or to a storage service.
Sailcharts are imported and exported from the Sailchart editor instead: see How do I import the Sailchart from my sailmaker?
By default each routing is drawn in its own colour, the one that identifies it in the list. Two other readings are available.
At the head of the Routings tab, the Colour selector offers three choices:
- Routing: the routing's colour, as before;
- Sail: the colour of the sail carried on each leg;
- Speed: a gradient by boat speed, from blue (slow) to yellow (fast), on each routing's own scale.
A legend appears under the selector to recall what the colours mean. The choice is global and persistent.
Legs under engine are drawn dashed, whatever the choice. In Sail mode they are grey, like the gear swatch in the legend.
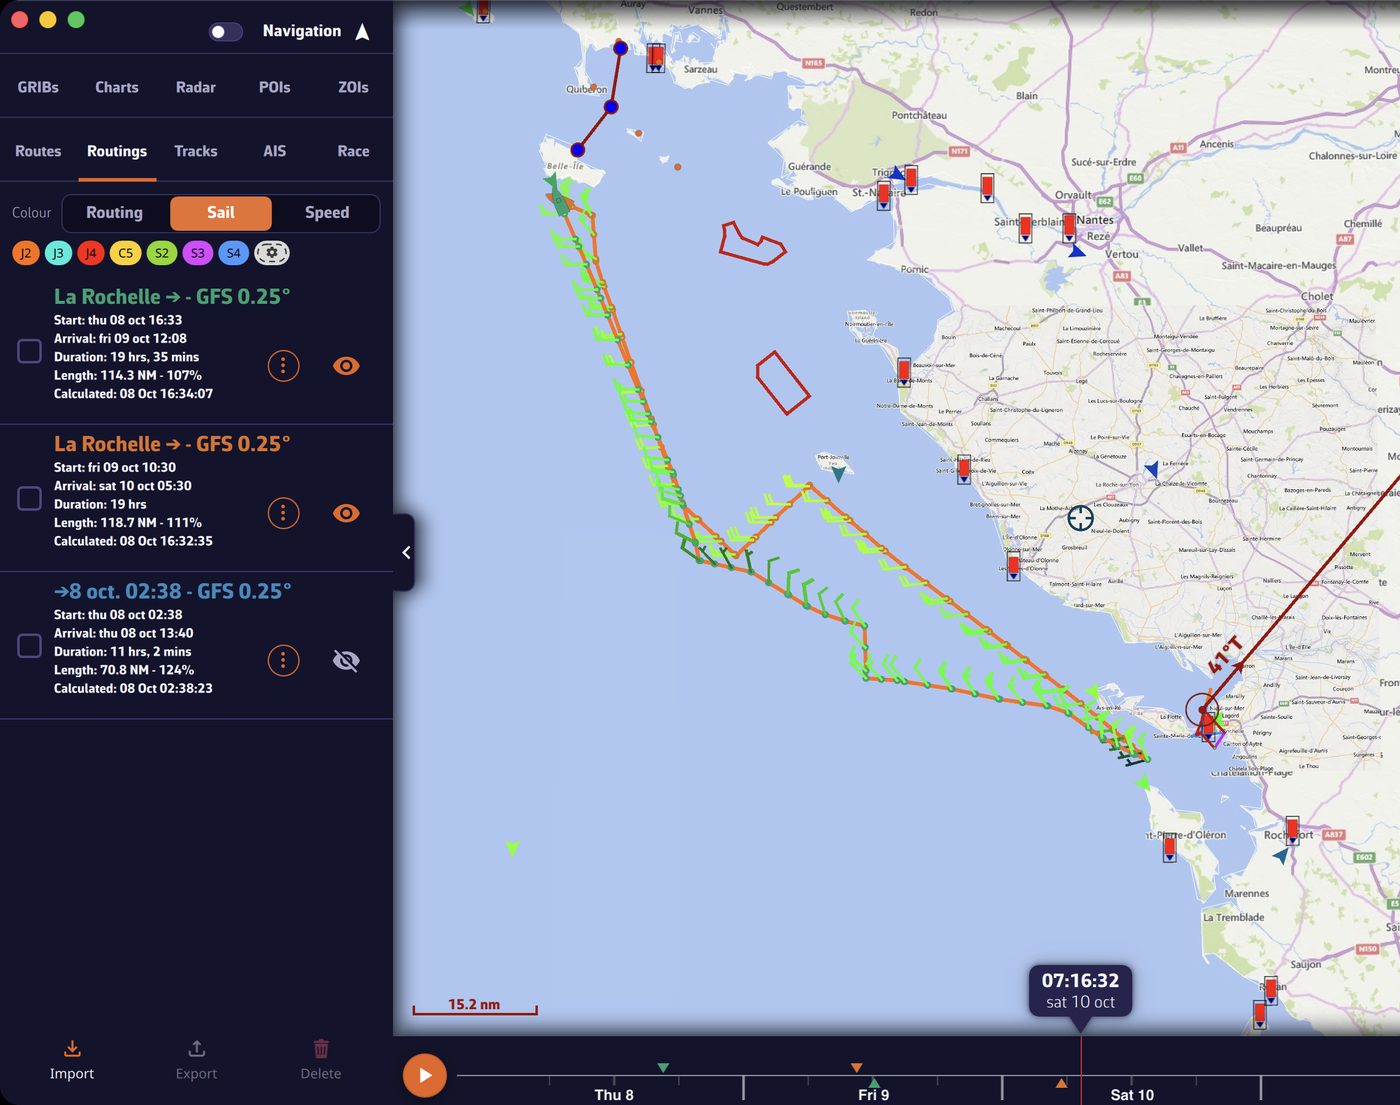
Colouring by sail assumes the routing's polar carried a Sailchart. Without one, legs keep the routing's colour, and the legend says "No Sailchart on the selected polar".
The inventory is frozen with the routing
The sail set used is stored with each routing. If you later change polar or Sailchart, an old routing keeps the colours and names it had when it was computed. That sail set is visible in the routing's Inputs, alongside the other parameters.
How long under each sail?
A routing's Statistics tab includes a Sail usage block: for each sail, the share of time, the duration and the distance covered. That is where you see a passage is 70% under spinnaker, or that a sail was only up for half an hour.
NavimetriX displays nautical charts from two providers:
- Geogarage: the official charts of about thirty hydrographic offices, by subscription to one or more publishers depending on your sailing areas. You must create an account and subscribe on the Geogarage website, then sign in from NavimetriX. That is what this page covers.
- C-MAP (beta): C-MAP DISCOVER X and REVEAL X charts with a Digital License, bought on the C-MAP website. They display on iPhone and iPad, Android, macOS, Windows and Linux, but not in the browser version. See C-MAP charts in NavimetriX.
Description
The charts offered by Geogarage come from the digital data of numerous international hydrographic offices, such as SHOM, UKHO, NOAA, etc...
About thirty publishers are currently available, offering near-global coverage. These are raster, tiled charts that allow smooth display at different scales depending on the zoom level.
When you subscribe to a hydrographic service through Geogarage, you get access to all the charts published by that hydrographic office.
For example, if you subscribe to SHOM charts (Service Hydrographique et Océanographique de la Marine), you will have access to all SHOM charts.
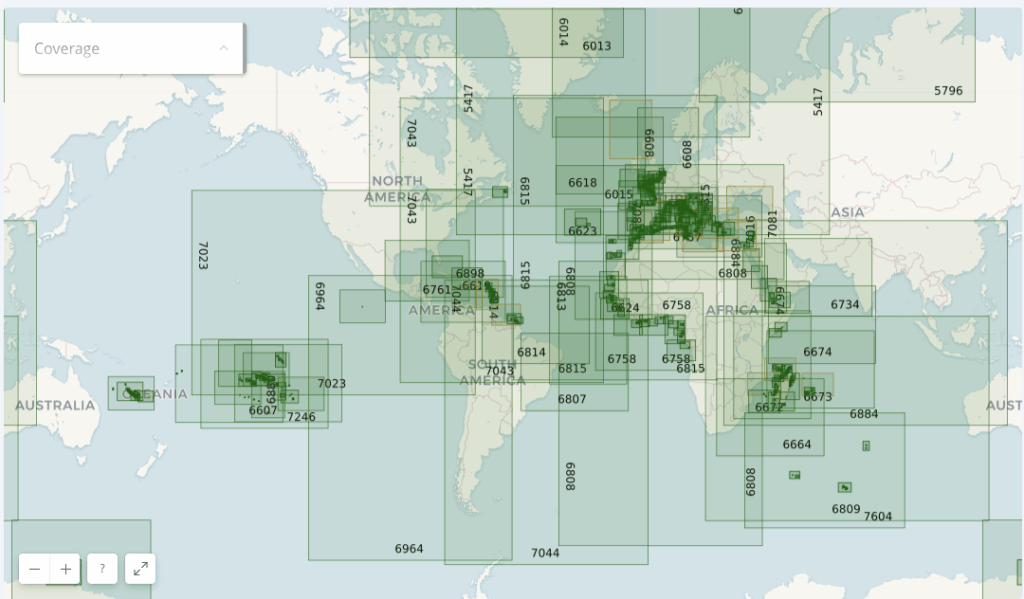
Thus, if you're sailing across the Atlantic from La Rochelle to Fort-de-France, a single SHOM chart subscription is probably enough to cover your entire passage.
Here is an illustration showing the diversity of hydrographic services available in Geogarage:
- the harbour of Toulon by the SHOM (France);
- the Solent by the UKHO (United Kingdom);
- the Kiel region by the BSH (Germany);
- and finally San Francisco Bay by the NOAA (United States).
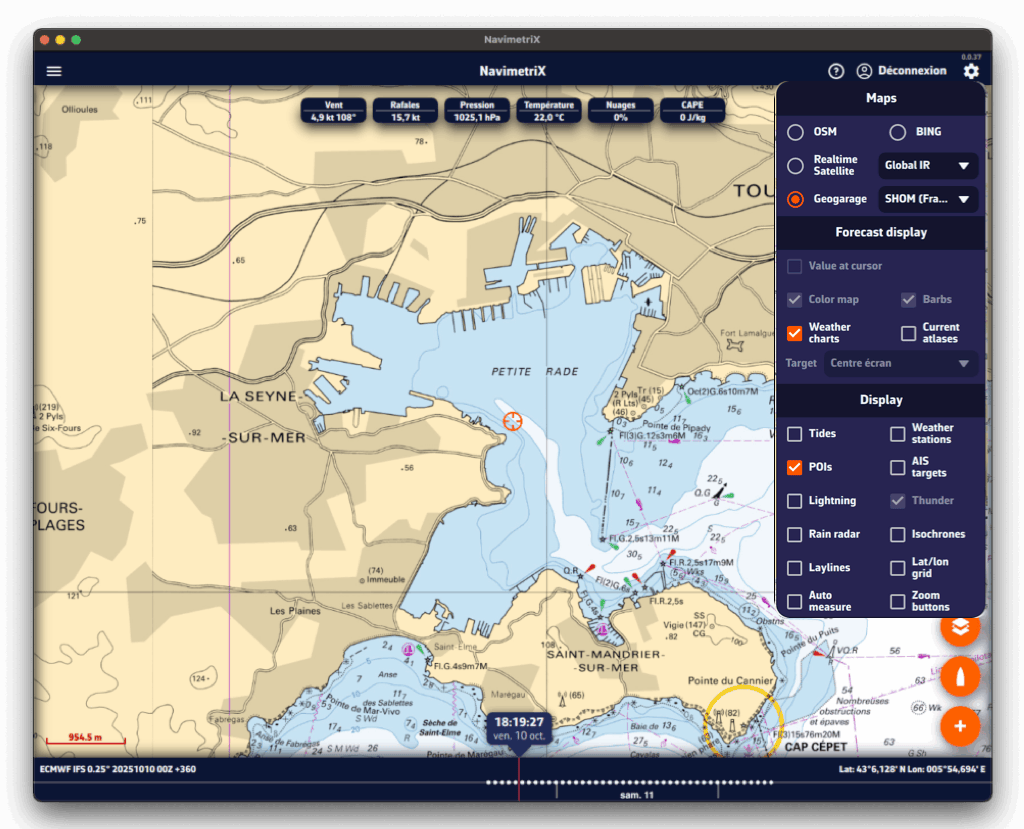
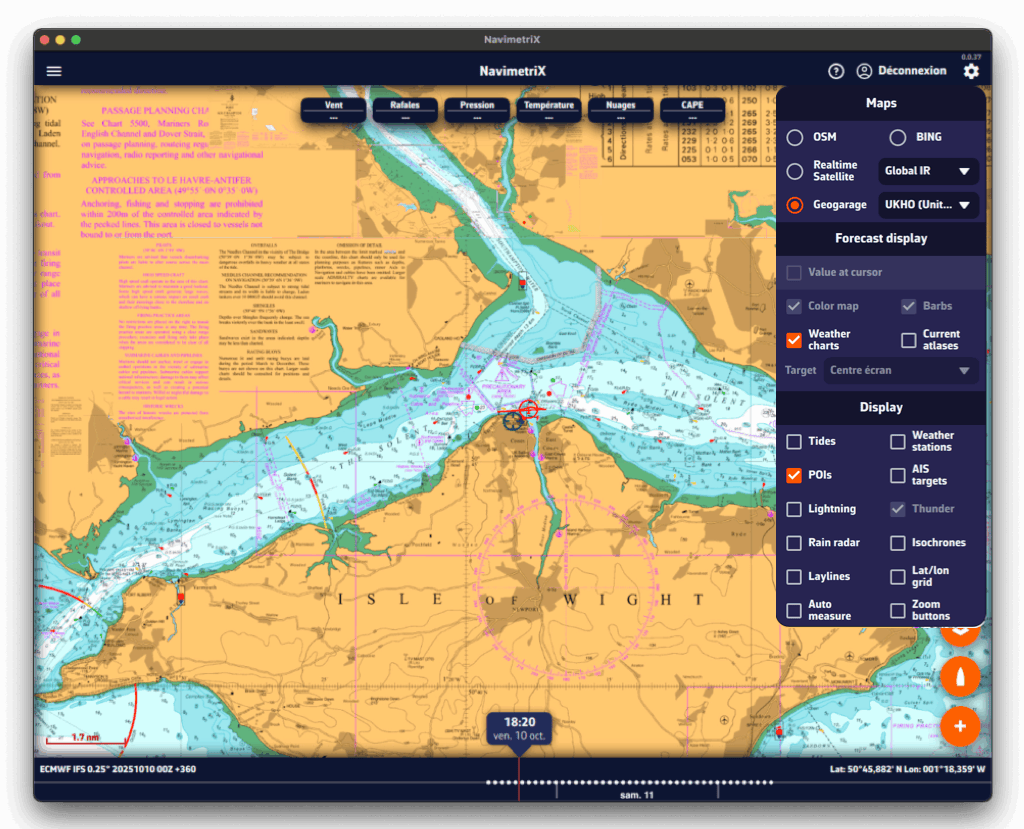
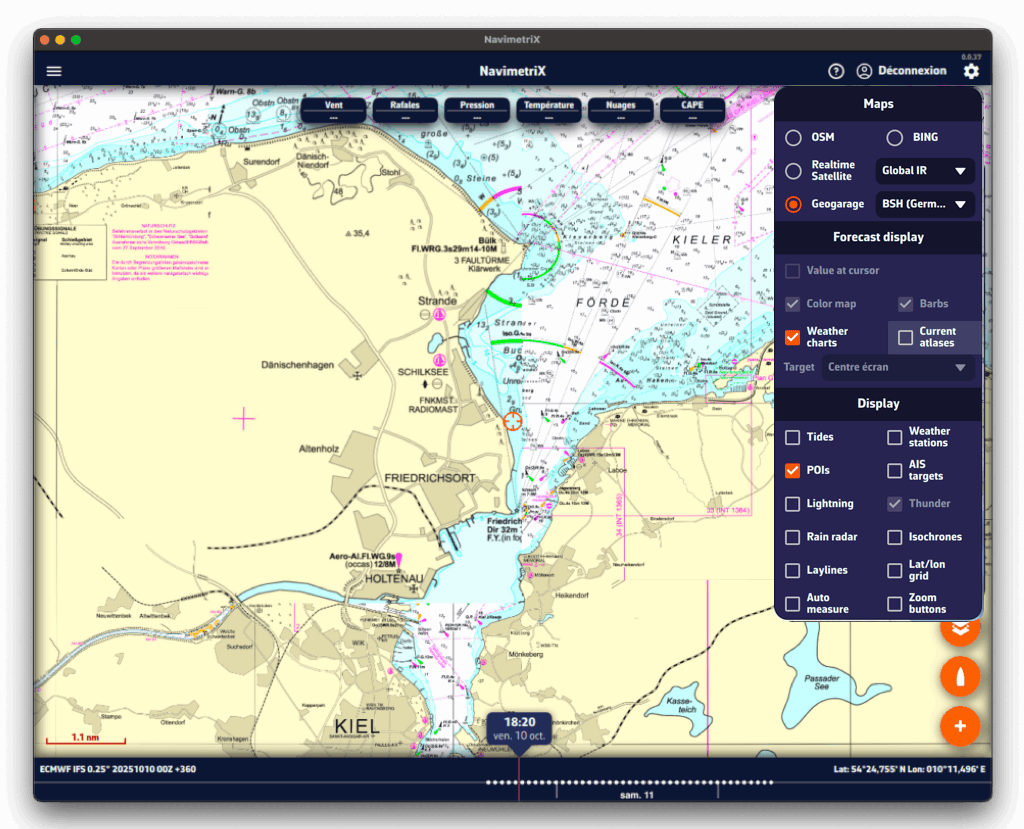
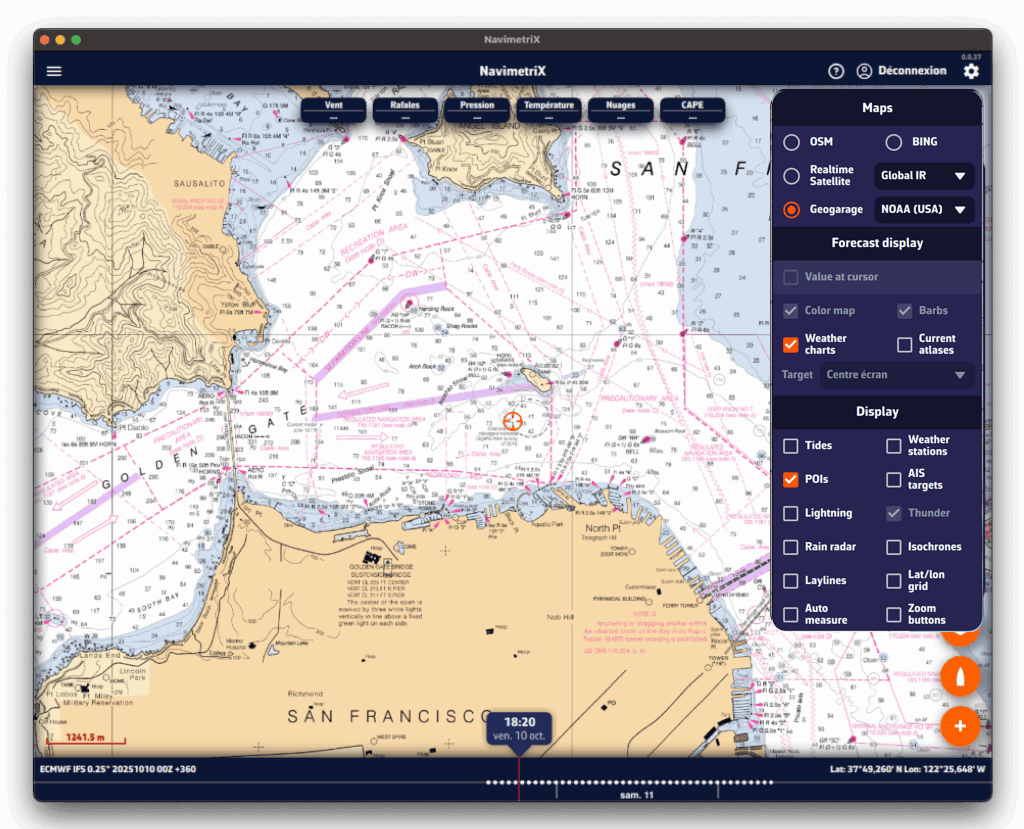
Accessing the subscription page
You must first create an account to access the catalog. Note: the credentials of this account (email address or username, and password) will need to be entered in NavimetriX: keep a careful note of them.
In NavimetriX, the Geogarage charts page in Settings offers two links to the Geogarage website below the Login button: “Sign up to Geogarage” and “Access my account”. On iPhone, iPad and Mac, there is only a “Need help” link, which opens this page. In every case, the subscription is taken out on the Geogarage website, not in the app.
Forgot your Geogarage password? Reset it on the dedicated page of the Geogarage website.
At this stage, a link already lets you access the areas covered by the catalog directly (red box).
Subscribing to a chart service
Once your account has been created and validated, the offers page is displayed:
Publishers are presented as thumbnails, grouped by major region: Europe, the Americas, Oceania and the Pacific. You can also check each one's coverage to confirm it includes the level of detail you need.
The "Subscribe" button guides you through the purchase process for your subscription.
Subscriptions are renewed annually, from one date to the same date the following year, with the sole exception of SHOM, for which Geogarage now offers a 3-month subscription aimed mainly at summer sailors.
Precautions regarding subscriptions
Subscriptions are automatically renewed by Geogarage, by tacit renewal, if:
- You have not indicated that you do not wish to renew,
- Your payment method is still valid.
Geogarage explains the process on their side:
If the subscription is not renewed by its expiry date, the charts, including those saved in the mobile device’s memory, are no longer available for viewing.
A few weeks before the subscription’s expiry date (day J), we send the subscriber a message informing them of the automatic tacit renewal (with a link to opt out if desired), as well as of the expiry of their payment method, if it is no longer valid.
However, the subscription is not cut off on day J itself: several follow-up reminders spaced a few days apart allow a user at sea who cannot check their messages to access this information, or to resolve payment issues with their bank.
However, if no action is taken on the subscriber’s account on our e-commerce site https://accounts.geogarage.com, the subscription is then cut off around day J+15.
Geogarage is an aggregator of official marine charts that brings together the charts of over 30 national hydrographic offices. NavimetriX displays the entire Geogarage catalog as raster charts (images cut into tiles). You take out the subscriptions of your choice on the Geogarage website, then sign in to your Geogarage account in NavimetriX to use the official charts on all your devices.
Important: one subscription = a full service, not a region
Unlike charts sold by geographic region, such as C-MAP charts (which NavimetriX also supports, in beta: see C-MAP charts in NavimetriX), a Geogarage subscription gives you access to every chart published by a hydrographic office, wherever in the world that office publishes. You pick your subscriptions based on which offices cover your sailing areas, not the other way around.
A few examples:
- SHOM (France): all French charts, mainland and overseas territories (French Antilles, French Polynesia, Réunion, Mayotte, French Guiana, New Caledonia, Saint-Pierre-et-Miquelon, French Southern Territories…). With a single SHOM subscription you get detailed coverage wherever France has dependencies, and global ocean passage charts too.
- NOAA (United States): every chart of US waters: East Coast, West Coast, Gulf of Mexico, Alaska, Hawaii, Puerto Rico, Pacific territories.
- BSH (Germany): all German charts of the North Sea and Baltic.
- UKHO (United Kingdom): all British Admiralty charts covering the United Kingdom and its dependencies (former Commonwealth territories, South Africa, Malta, NGA), and global ocean passage charts too.
For instance: if you sail along the French Atlantic coast and in the French Antilles, a single SHOM subscription covers both areas, with no separate coverage to buy for each archipelago. For a long voyage crossing multiple jurisdictions, you combine the subscriptions you need (e.g. SHOM + NOAA to reach the Caribbean from France via the US East Coast).
Hydrographic offices included in the catalog
The Geogarage catalog covers the world's main sailing areas with official charts from:
- Europe: SHOM (France), UKHO (United Kingdom), BSH (Germany), Kystverket (Norway), Sjöfartsverket (Sweden), Geomatikk (Finland), Belgian Hydrographic Service, Danish Geodata Agency, Rijkswaterstaat (Netherlands), Instituto Hidrográfico (Portugal), Instituto Hidrográfico de la Marina (Spain), Croatian Hydrographic Institute, Maltese Maritime Authority…
- Americas: NOAA (United States), Canadian Hydrographic Service, DHN (Brazil), SHN (Argentina), SHOA (Chile), Instituto de Hidrografía (Cuba)…
- Asia and Pacific: JHD (Japan), KHOA (Korea), Maritime New Zealand, Australian Hydrographic Office, Philippine NAMRIA, Taiwan Hydrographic Bureau…
- Africa and Middle East: South African Navy Hydrographic Office, Mozambique, Israel, Oman, regional Persian Gulf services…
Browse the interactive catalog
Select a hydrographic service below to view the exact chart coverage included in its annual subscription:
Annual subscription pricing
Prices vary depending on the hydrographic service and the geographic area covered. You can subscribe to one or several services on the Geogarage website: NavimetriX does not sell these subscriptions. Subscriptions are tied to your Geogarage account and usable in NavimetriX on your Android, iOS, macOS, Windows and Linux devices.
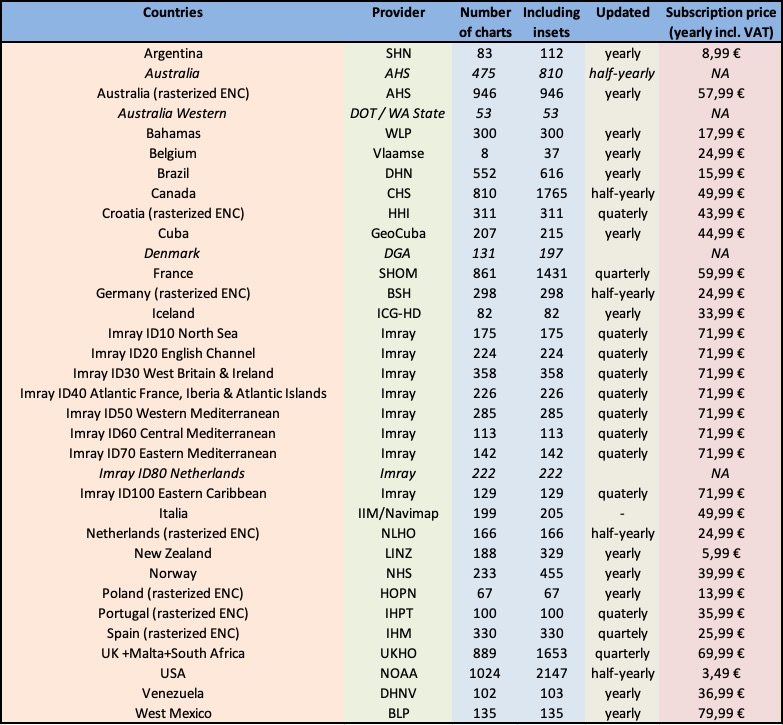
For up-to-date pricing and details, see the Geogarage website.
Read also
In NavimetriX Settings (chevron handle (‹) on the right edge of the screen), Geogarage charts page, sign in by tapping the “Login” button and entering your Geogarage account credentials: email address or username, and password.
If you forget your password, the “Forgot password” link in the login window opens the Geogarage website. On iPhone, iPad and Mac, this link is called “Need help” and opens the page How can I obtain nautical charts?
Once you are signed in, the button changes to “Logout”. Without an Internet connection, it shows “Offline”.
Then tap the orange round layers button. In the “Maps” section, select Geogarage, then choose your subscribed chart (or one of them) from the list next to it, for example UKHO. This row only appears once you are signed in, if your account has at least one subscription. The chart displays instantly while connected to the Internet; to sail without a network, download offline zones (see How do I download charts for offline use?).
You can also choose the chart in Settings > Geogarage charts, “Layer” list.
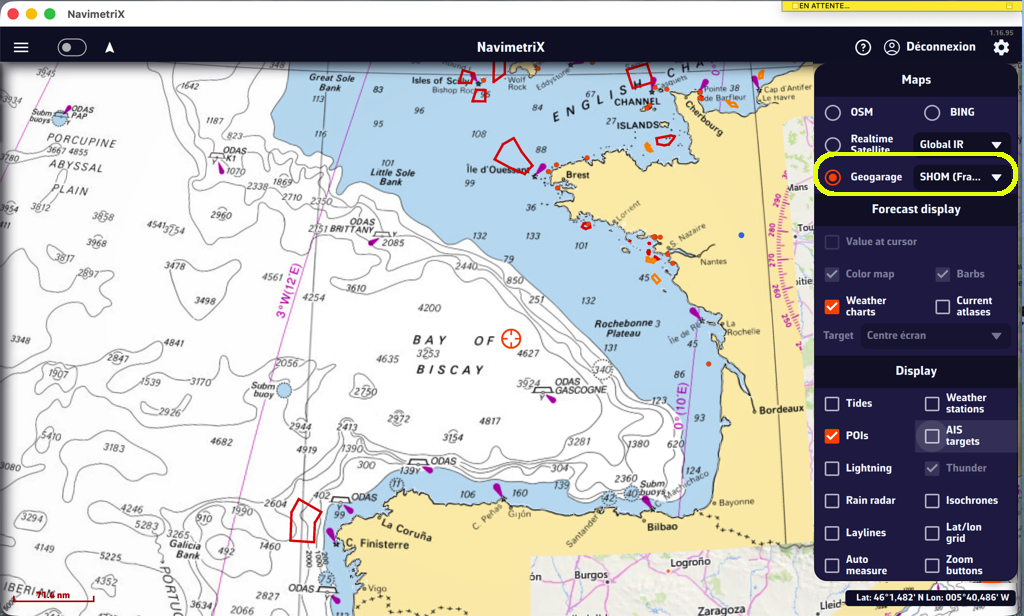
Download
In the Settings of NavimetriX, under the Geogarage Charts section, tap “Add New Zone”, then define the geographical area to download by dragging the green corners of the grey rectangle.
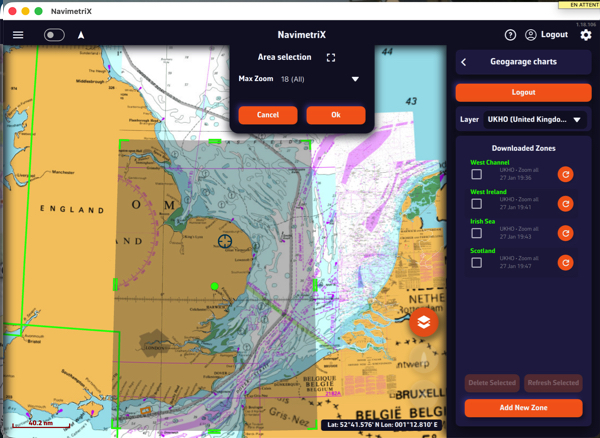
The Area selection dropdown menu offers two zoom-level options for the maximum chart scale:
- 11 (Offshore) — covers a large area containing only small-scale charts (ocean routes, offshore charts).
- 18 (All) — includes all scales up to detailed large-scale charts (ports and anchorages). If the selected area is too large, a warning will appear.
Once confirmed, a countdown shows the preparation and download progress.
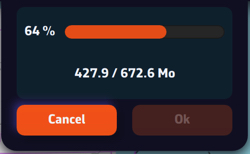
A green frame remains visible so you can add new adjacent download zones without overlap using the “Add a new area” button. Only downloaded charts are available for offline use.
Updating downloaded charts
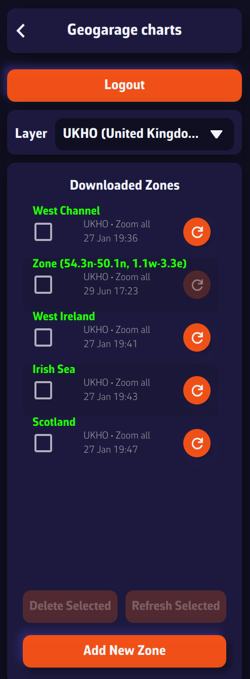
The downloaded chart zones are listed by publisher in the Geogarage Charts drawer. A checkbox allows you to select them for the Delete or Refresh functions.
Whenever a chart update is published by the provider, the dimmed refresh icon becomes active so you can update your zones individually, or collectively by checking the boxes and using the “Refresh Selected” button.
In order to rename a chart area, you have to do a long click/tap on its name. This will bring up the keyboard, allowing you to change the name:
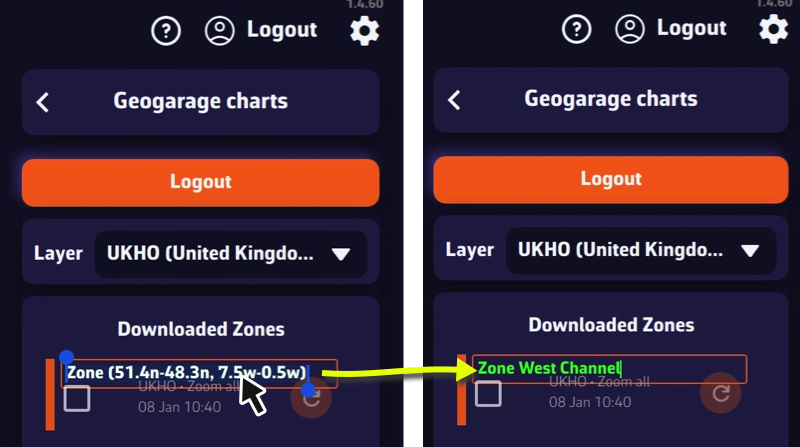
Please note that unlike GRIBs, downloaded charts are not synchronized, and therefore neither is the name.
Only X-Charts, the latest generation of C-MAP charts: DISCOVER X and REVEAL X, bought as a Digital License. C-MAP presents this generation on its page The X generation of charts.
Charts of earlier generations do not work in NavimetriX: DISCOVER and REVEAL without the X, 4D, MAX, etc. Check for the X in the product name before you buy.
REVEAL X contains everything in DISCOVER X, plus extra layers:
| DISCOVER X | REVEAL X | |
|---|---|---|
| Vector navigation charts, harbour and approach details, marinas | ✔ | ✔ |
| High-resolution bathymetry, custom depth shading | ✔ | ✔ |
| Tides and currents | ✔ | ✔ |
| Day and night modes | ✔ | ✔ |
| Satellite imagery | ✔ | |
| Shaded relief of the coast and the seabed | ✔ | |
| Vegetation and seabed hardness layers | ✔ | |
| Example price, Central and West Europe (22 September 2026), first year | €159 | €249 |
Which one should I choose? DISCOVER X has everything you need to navigate. Choose REVEAL X if you want the satellite view, the relief and the seabed layers. Prices depend on the region and the country of the store. From the second year on, the subscription is half price (see What happens after 12 months with a C-MAP chart?).
To check the coverage before you buy, open the C-MAP chart viewer and search for your harbour. It gives a preview: the chart downloaded in NavimetriX may differ slightly.
See also: How do I create my C-MAP account? and Where and how do I buy my C-MAP charts?
You need a free C-MAP account to buy your X-Charts and use them in NavimetriX. It is the same account for both.
- Open the store: xstore.c-map.com.
- Click "Sign in" (or let C-MAP ask you when you pay). The sign-in page opens: xstore.c-map.com/auth/login.
- Enter your email address. The same page is used to sign in or create an account: if the address is new, follow the steps to create the account.
Remember this email and password: you will enter them in NavimetriX (see How do I download a C-MAP zone in NavimetriX?).
For your charts, remember that only X-Charts work.
The compatible C-MAP charts, the X-Charts (DISCOVER X and REVEAL X), are sold on the store: xstore.c-map.com/charts. C-MAP has several websites; this is the one that sells the X charts as a Digital License. You need a C-MAP account (free).
Step 1: filter. On the left, filter by Product (DISCOVER X or REVEAL X) and by Area. The flag at the top right changes the country, the language and the currency.
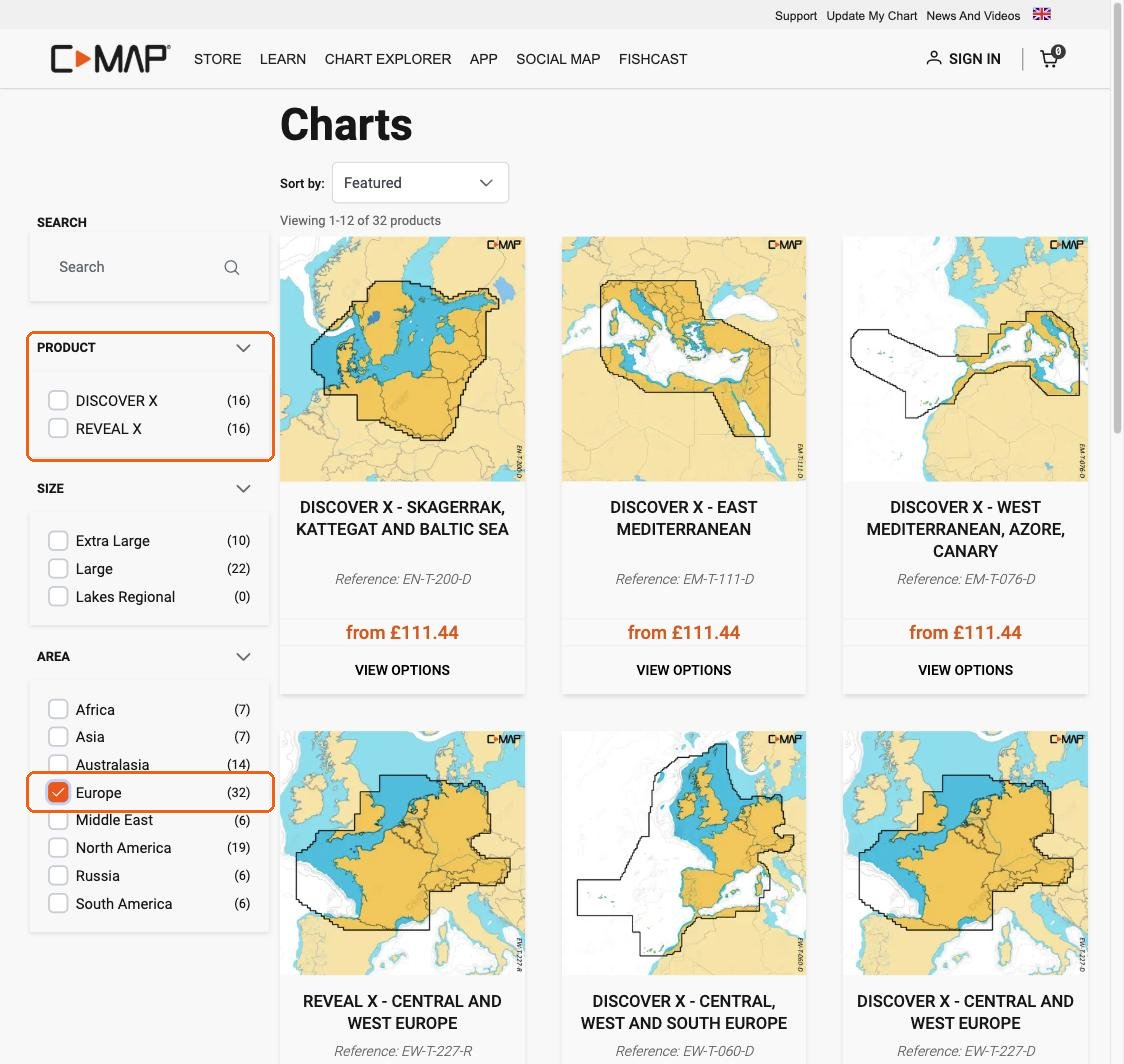
Step 2: skip the "Product Compatibility" window. The first time, C-MAP shows a window that only lists B&G and Simrad chart plotters. NavimetriX is not in this list, but it is compatible. Click "Yes, continue to purchase".
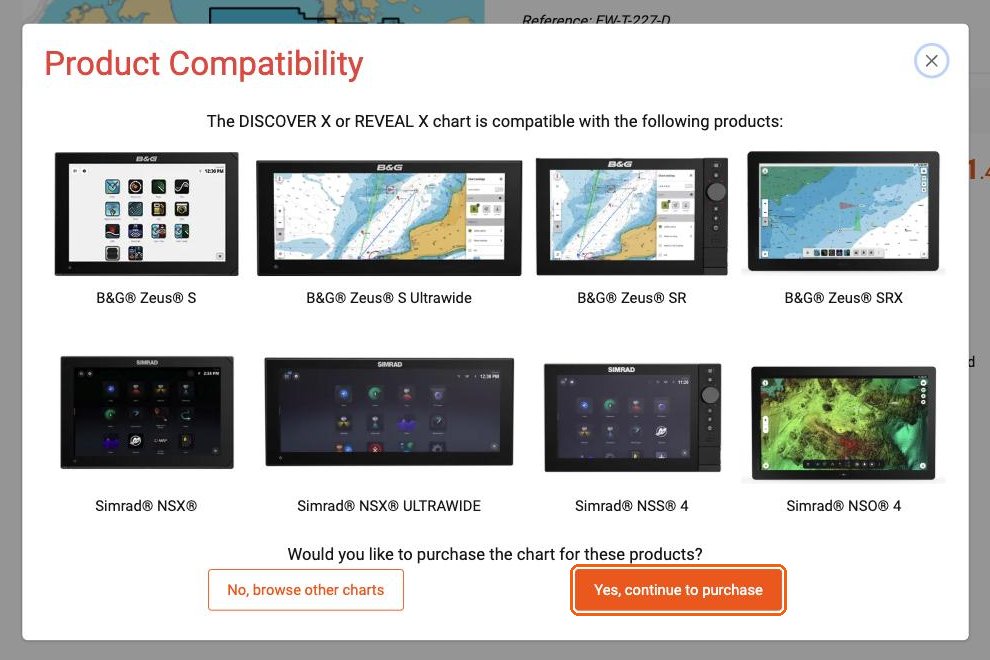
Step 3: choose "Digital License". On the product page, next to "Media Type", select Digital License, not Micro SD. The line "System requirement: a compatible chart plotter is required" does not apply to NavimetriX. Click "Add to cart" and pay.
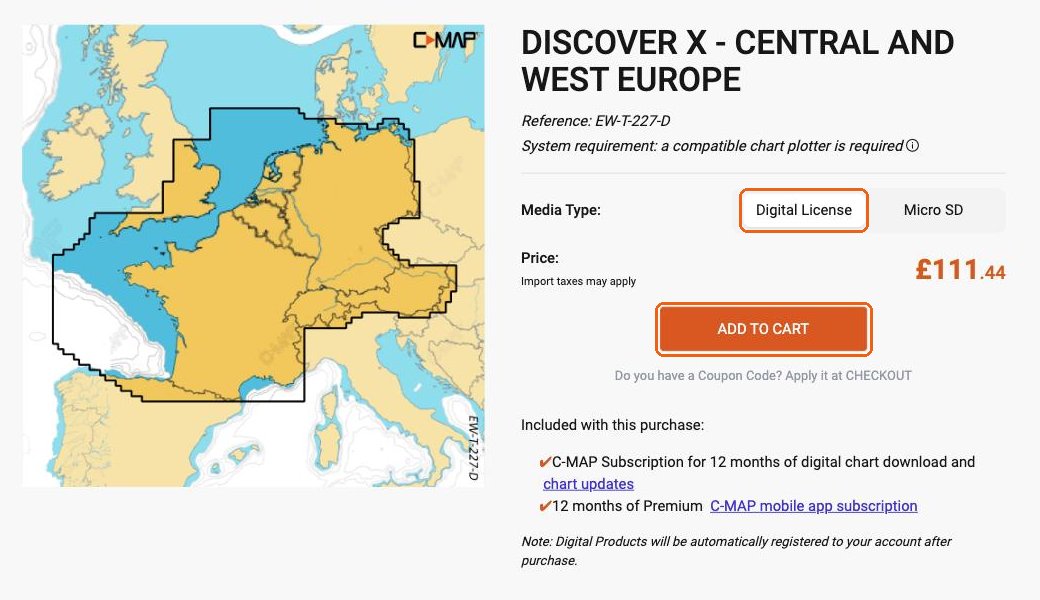
After the purchase, the chart is added to your C-MAP account automatically. The purchase also includes a subscription to C-MAP's Premium mobile app: you do not need it to use your chart in NavimetriX.
The price includes 12 months of downloads and updates. The second year and the following ones are half price.
To check the coverage before you buy, see Which C-MAP charts work in NavimetriX?
A C-MAP chart is not downloaded whole: you choose the zones you need. First you must have bought an X-Chart with your C-MAP account.
1. Sign in. Open the settings, then "C-MAP charts". Tap "Account", then "Sign in to C-MAP". A C-MAP page opens in your browser: enter the email address and password of your C-MAP account. The browser shows "C-MAP sign-in successful": close the tab and come back to NavimetriX.
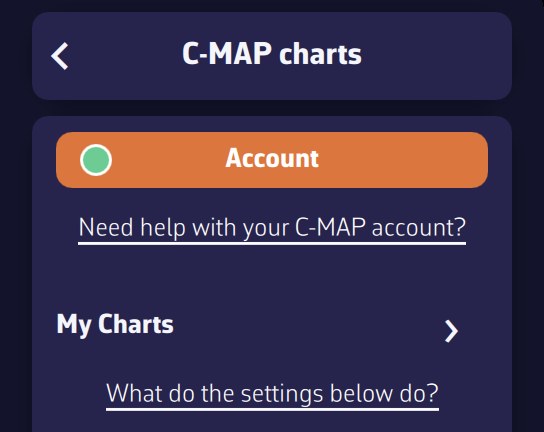
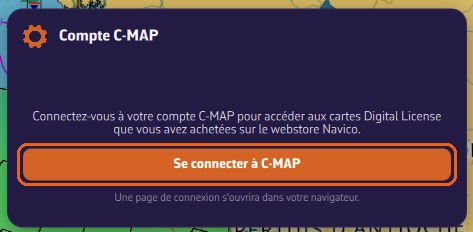
The account window shows your email address and "✓ Device registered to this account". If it says "Device not registered", tap "Register this device".
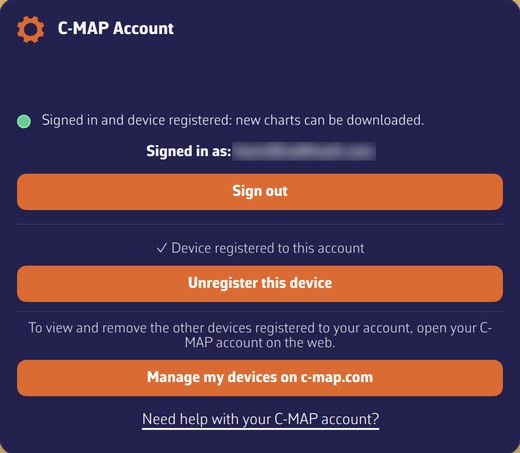
The dot on the "Account" button shows the status at a glance: green = signed in and device registered (you can download new zones); orange = signed in, but the registration of the device is not confirmed (for example if C-MAP does not respond); red = not signed in. Zones you have already downloaded are displayed in all cases: only downloading new zones depends on it.
2. Choose the zone. Open "My Charts", which lists your charts (type, code, end-of-subscription date), then tap "Add a zone". A rectangle appears on the map: move it and resize it with the green handles so it covers your sailing area, then tap OK.
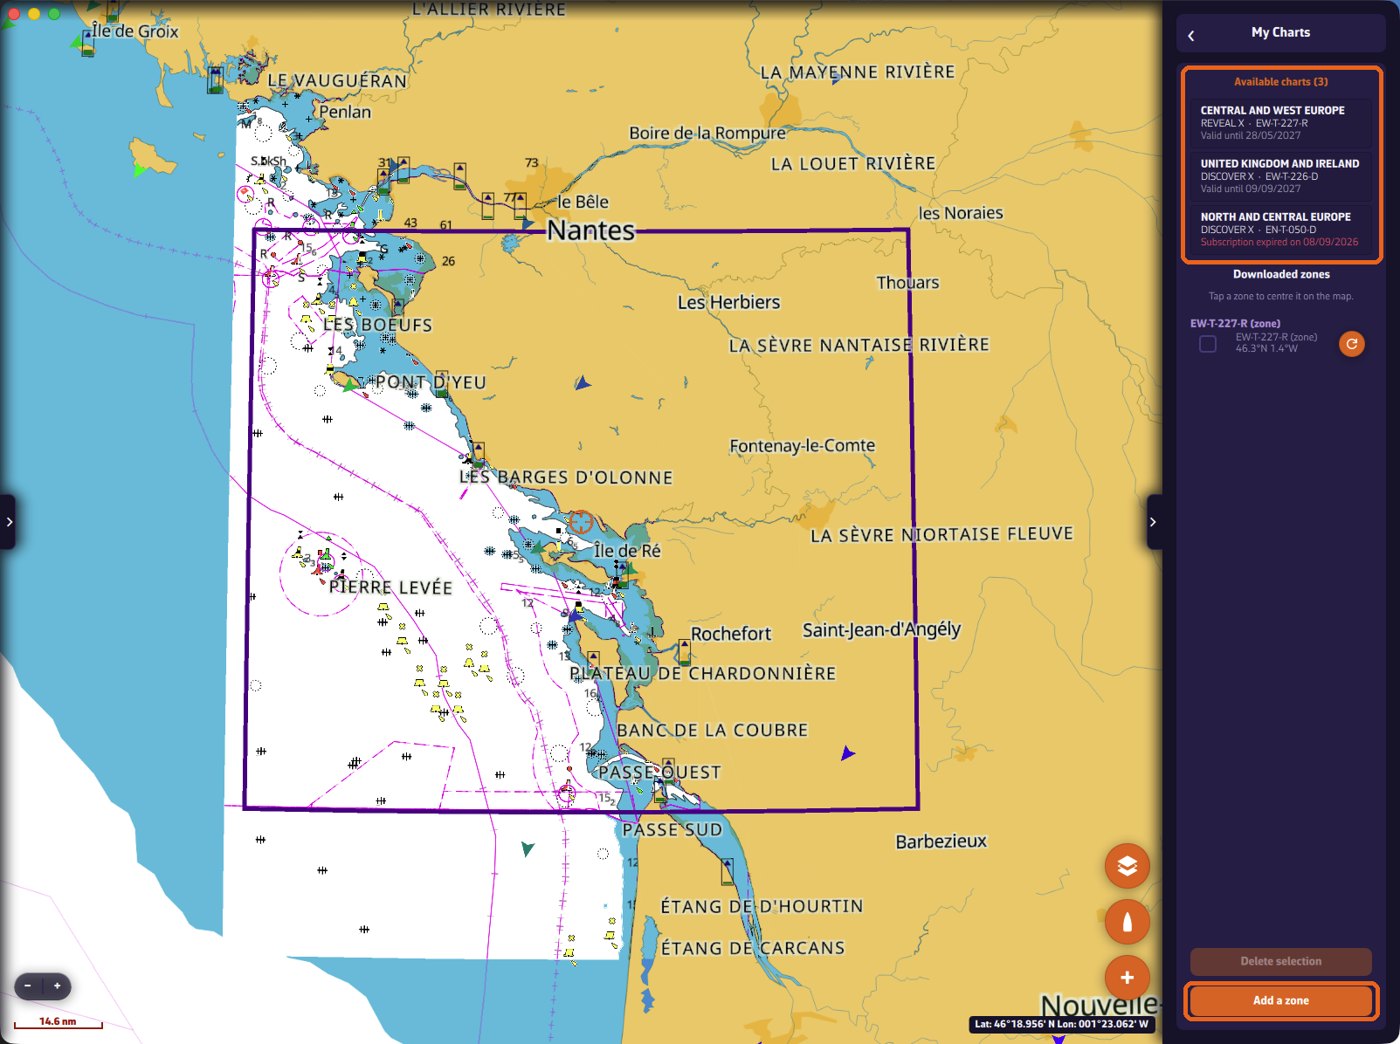
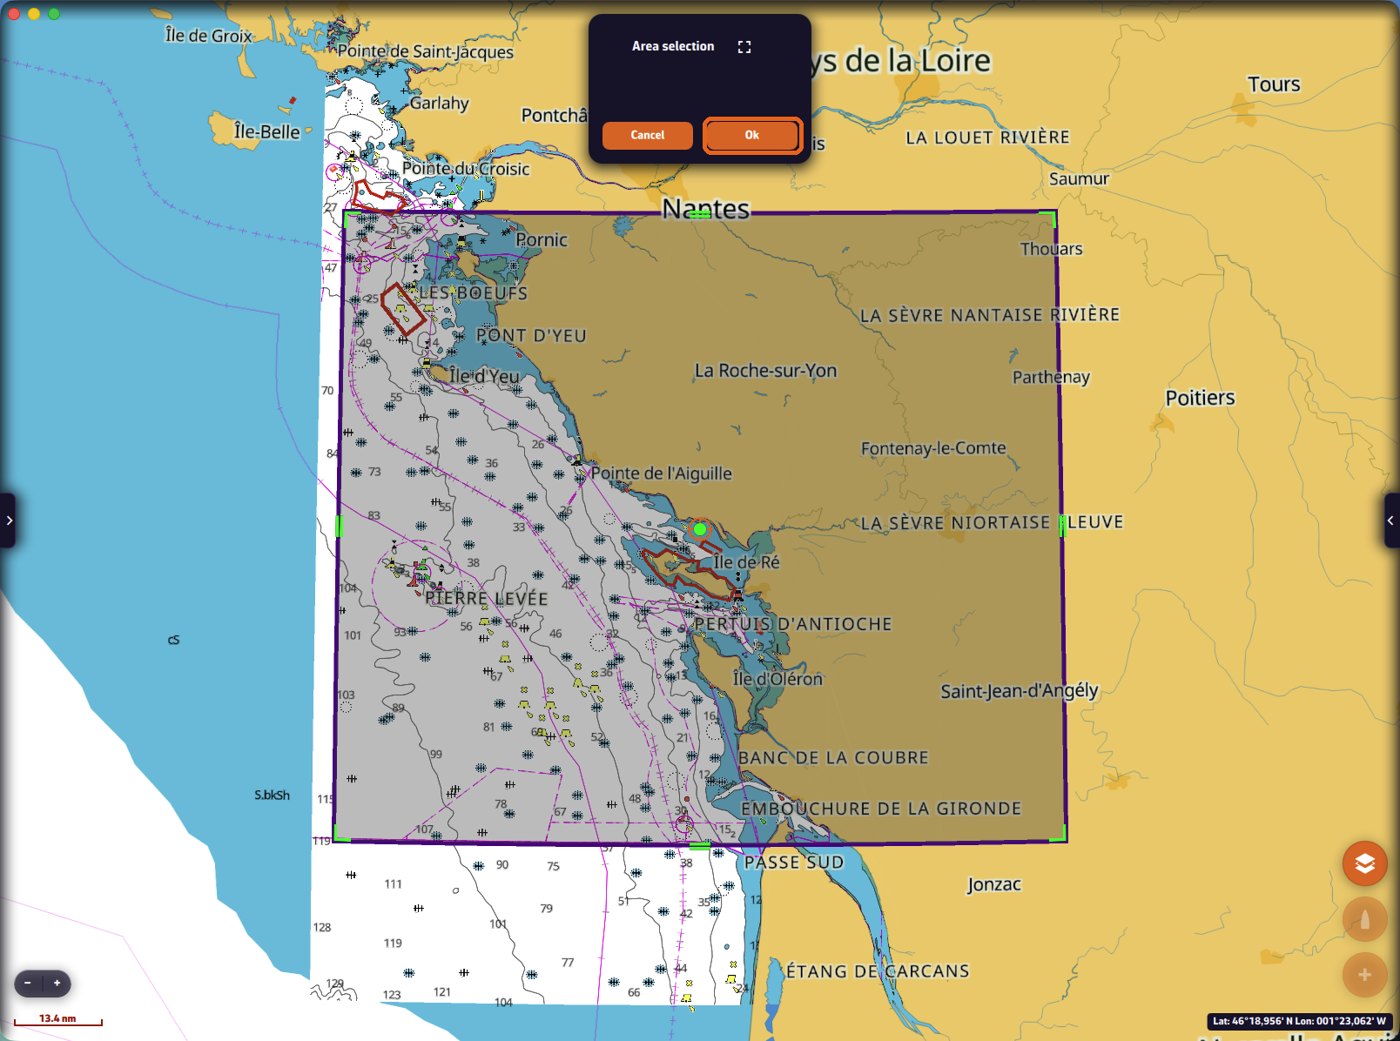
3. Download. If several of your charts cover the zone, NavimetriX asks which one to use. Choose the layers and tap "Download". "Navigation charts" is the essential layer; satellite images and shaded relief (REVEAL X only) are larger: on a phone, keep them for the areas where you really want them. A banner shows the progress and you can keep using the app.
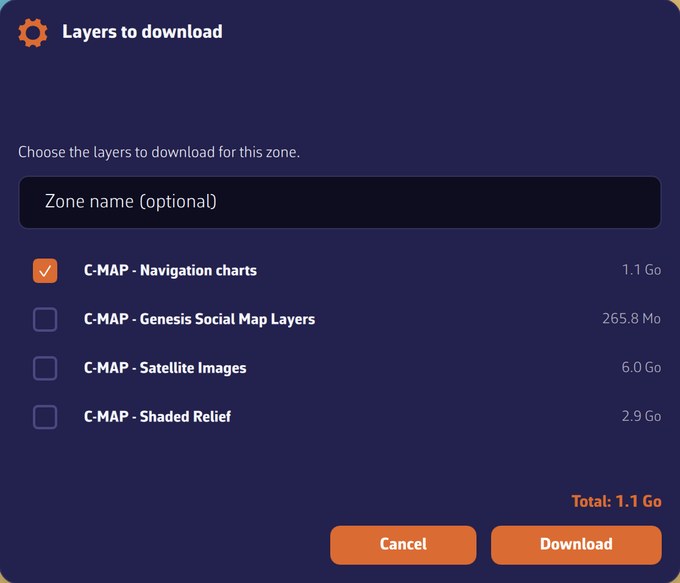
Once the download is finished, the detailed chart is displayed inside the zone, even with no Internet connection.
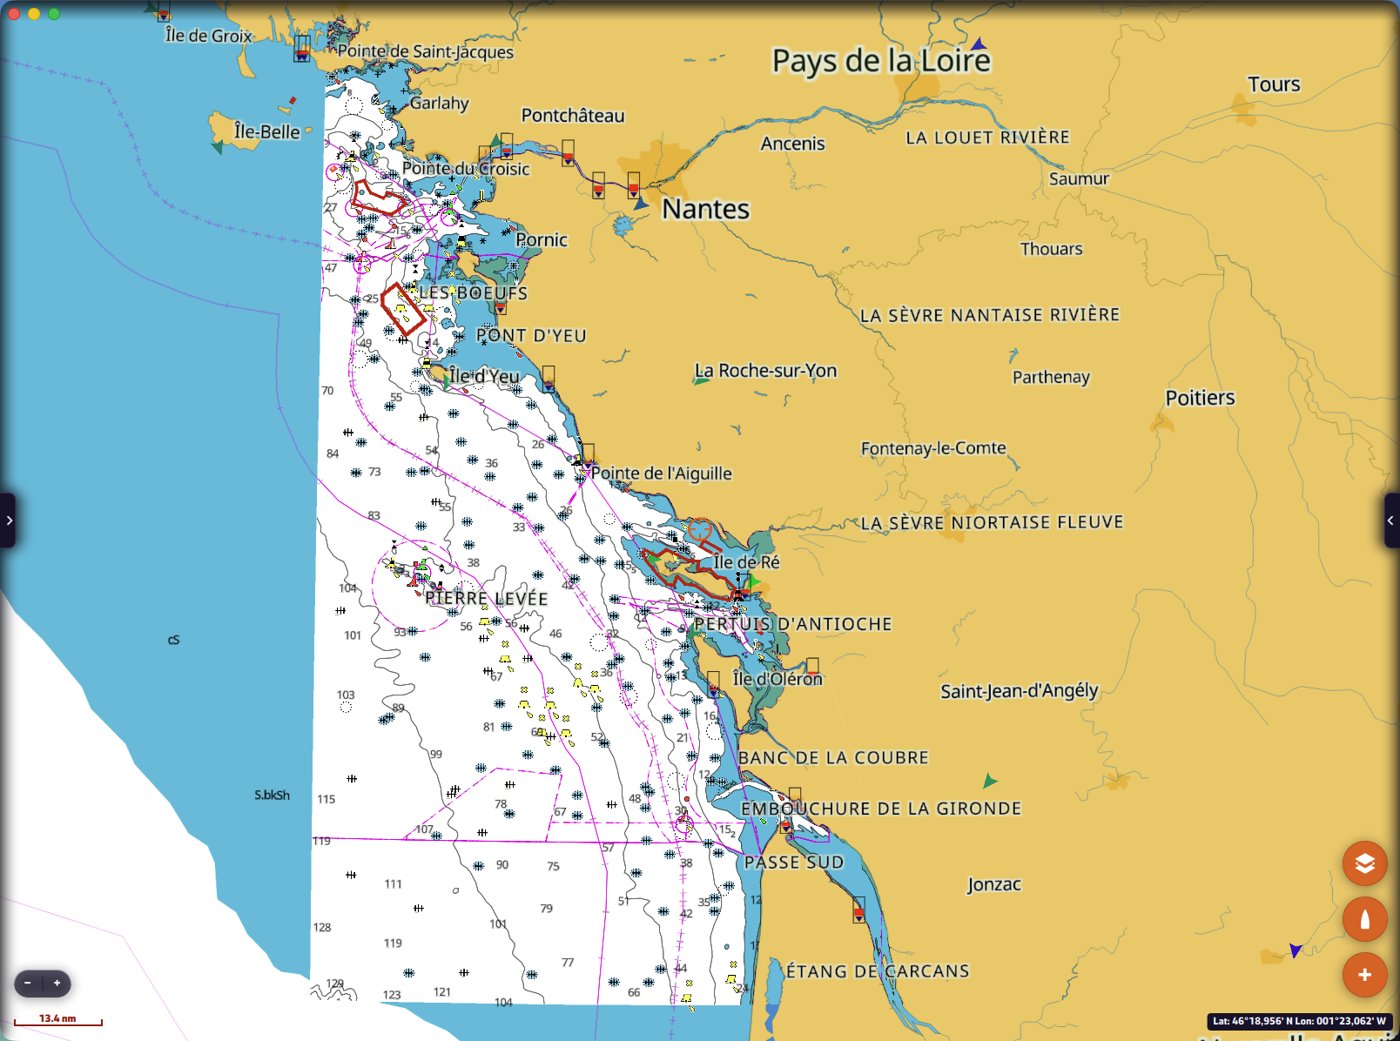
Adding layers later, or updating a zone. In "My Charts", tap the round refresh button to the right of the zone, tick the layers to add or update, then tap "Download". Do not use "Add a zone" for this.
- 2 computers or chart plotters: Windows PC, Mac, Linux, and B&G or Simrad chart plotters share these 2 places.
- Phones and tablets (iPhone, iPad, Android): as many as you like.
To free a place, tap "Unregister this device" in the C-MAP Account window of that device (settings, "C-MAP charts", "Account"). The charts and zones on that device are then removed. The button "Manage my devices on c-map.com" opens your C-MAP account, where you can see and remove your other devices.
This applies to X-Charts bought as a Digital License.
In the second year, and every following year, the subscription is half price (50%). Examples from 22 September 2026: REVEAL X extended for €124.50 instead of €249; chart renewed for €121.50 instead of €243.
The price of a chart includes 12 months of downloads and updates (confirmed by C-MAP on 22 September 2026).
- The zones you have already downloaded keep working, with no time limit, with all their functions: chart display, object information, search, tides and currents. Your charts do not stop at sea.
- Without an active subscription, you cannot download new zones and you do not receive updates any more.
- To download and update again, you extend or renew the subscription, at half price.
"My Charts" shows the end date of each chart; it is shown in red once the subscription has ended.
Our advice: before the end of the 12 months, download every zone you may need, on every device you use.
Extending or renewing. This is done on the C-MAP store, not in NavimetriX: sign in at xstore.c-map.com, click your name at the top right, then "My Account" and "My Charts". Each chart shows the end date of its subscription and a button "EXTEND SUBSCRIPTION" (subscription still running: the 12 months are added to the current end date) or "RENEW SUBSCRIPTION" (subscription ended: the 12 months start on the day you renew). The full price is struck through and you pay half.
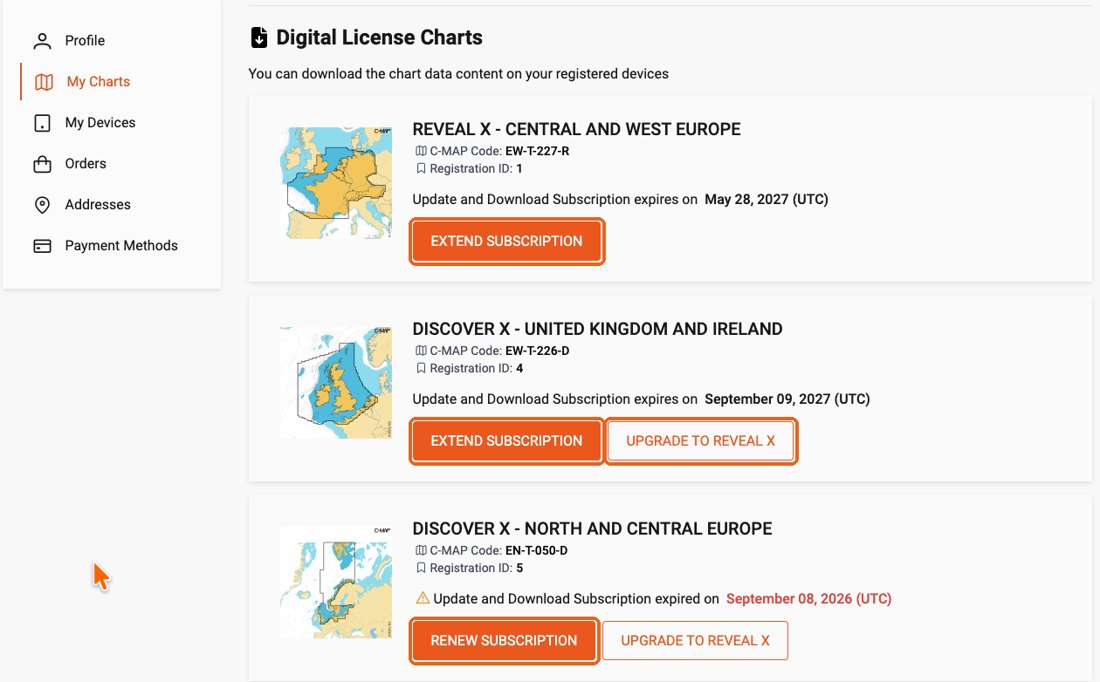
I change my phone or tablet. The zones cannot be moved, and the new device cannot download them without an active subscription: C-MAP customer care handles these cases one by one. While the subscription is active, you can download your zones again at any time on any registered device.
In "C-MAP charts" → "My Charts", the "Add a zone" button is only active if you are signed in to your C-MAP account, this device is registered and the account has at least one chart. When it is greyed out, a line under the button gives the reason:
- "Sign in to your C-MAP account to download zones." Tap "Account", then "Sign in to C-MAP" and enter the email address and password of your C-MAP account. The dot on the "Account" button is red.
- "The registration of this device is not confirmed: zones cannot be downloaded yet." The dot is orange. In "Account", tap "Register this device"; if your 2 places for computers or chart plotters are taken, see On how many devices can I use my C-MAP chart?
- "No C-MAP chart licence found on your account." The account holds no chart: buy an X-Chart with this same account. A chart of an earlier generation does not work.
The dot on the "Account" button shows the status at a glance: green = signed in and device registered (you can download new zones); orange = signed in, but the registration of the device is not confirmed (for example if C-MAP does not respond); red = not signed in. Reminder: zones you have already downloaded are displayed in all cases: only downloading new zones depends on it.
It explains every setting of the C-MAP charts: what it changes on the chart, and when it is useful at sea. The screenshots were taken off La Rochelle and the Île de Ré.
- The settings are in Settings → "C-MAP charts", under the "Account" button and "My Charts".
- They only change the C-MAP charts. The other layers of NavimetriX (weather, AIS, routes…) are not affected.
- When you are signed in to NavimetriX, your C-MAP settings follow you on your other devices.
- Each filter or alert shows its unit in its title, for example "(m)" or "(ft)": enter the values in that unit, the one chosen under "Units".
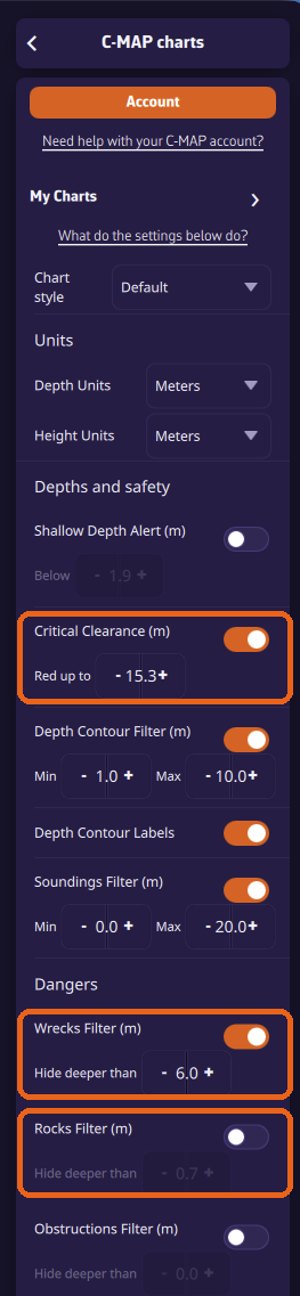
Chart style
At the top of the page, "Chart style" changes the whole look of the chart:
- Default: the C-MAP day presentation.
- Night: dark colours, to keep your night vision in the cockpit.
- NOAA: the presentation of US charts (NOAA), familiar to sailors used to American charts.
- NOAA Night: the NOAA presentation in night colours.
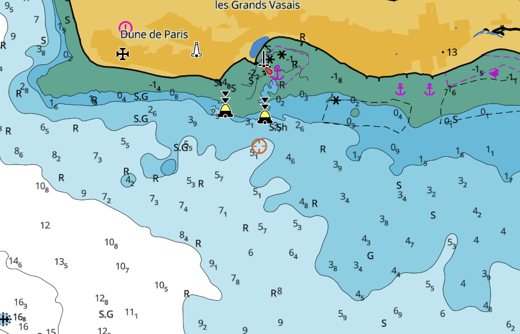
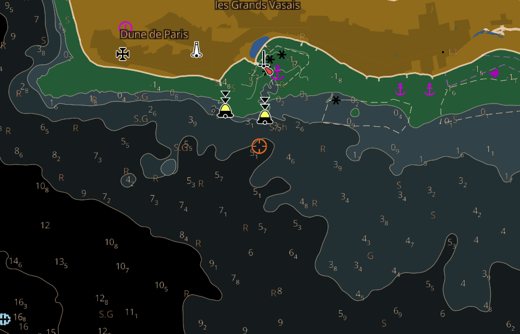
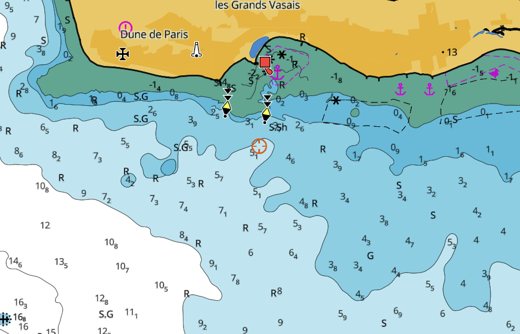
Cartography type
At the bottom of the page, "Cartography type" chooses between:
- C-MAP cartography (default): the complete C-MAP charts, with all their content.
- ENC charts only: only the official electronic navigational charts (ENC) of the hydrographic offices, in their official colours, without the content added by C-MAP such as the high-resolution bathymetry and the shaded relief.
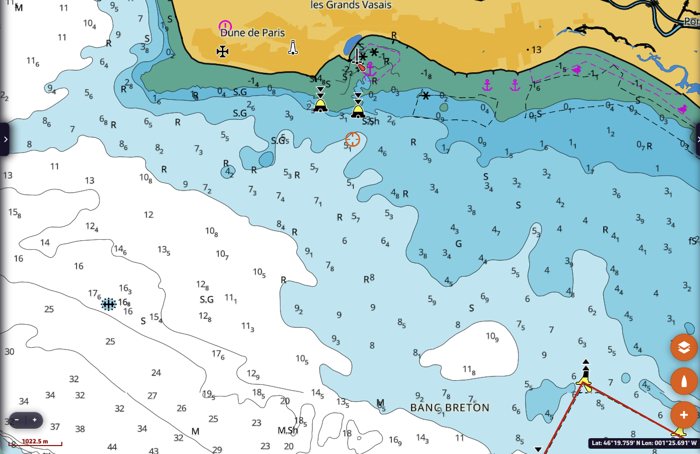
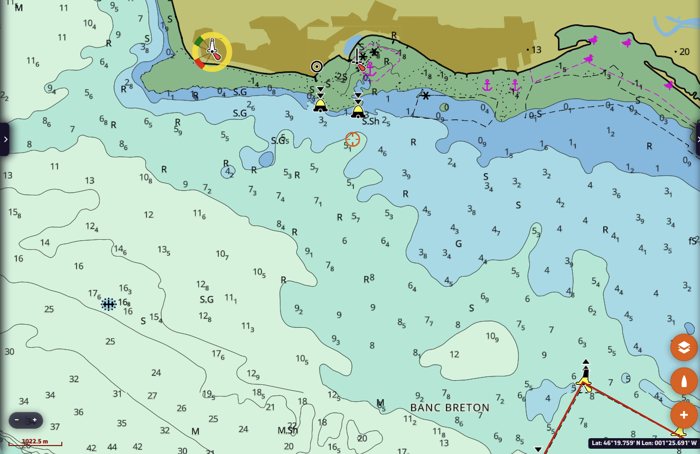
Quick settings in the Layers menu
The three buttons to the right of "C-MAP", in the Maps section of the layers menu (the orange button at the bottom right of the map), switch the most used layers on and off without opening the settings. An orange button means the layer is on.
- Satellite (picture icon, REVEAL X): satellite imagery on land only; at sea, the nautical chart stays visible. To cover the sea as well, set "Satellite Imagery" to "Enabled" (see below).
- Relief (mountain icon, REVEAL X): the shaded relief of the land and the seabed.
- High Resolution Bathymetry (grid icon): C-MAP's detailed depth contours.
Satellite and relief both shade the land, so switching one on switches the other off. High Resolution Bathymetry is independent. These buttons change the same settings as the C-MAP settings page, which shows their state.
With DISCOVER X charts only, the satellite and relief buttons are greyed out, and so are the REVEAL X rows of the C-MAP settings (seabed area, bottom hardness, vegetation, shaded relief, satellite). With both types of chart, everything stays active, but these layers only show over your REVEAL X charts: a note under "C-MAP" reminds you. An expired REVEAL X chart counts as no REVEAL X.
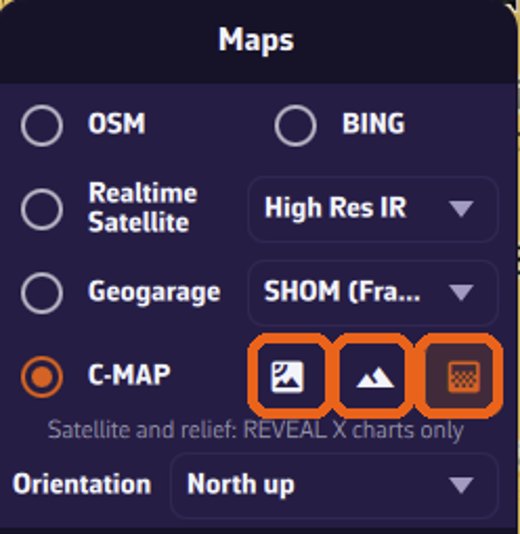
Units
- Depth units: metres, feet or fathoms. Used for the soundings and the depth contours on the chart, and for the depth values of the filters below.
- Height units: metres or feet. Used for the heights on the chart, such as the vertical clearance of bridges, and for the critical clearance.
Depths and safety
Shallow depth alert. Covers with red hatching the areas shallower than the value set in "Below". Switch it on and set "Below" to your draft plus a safety margin. In the example, the alert is set to 2.4 m.
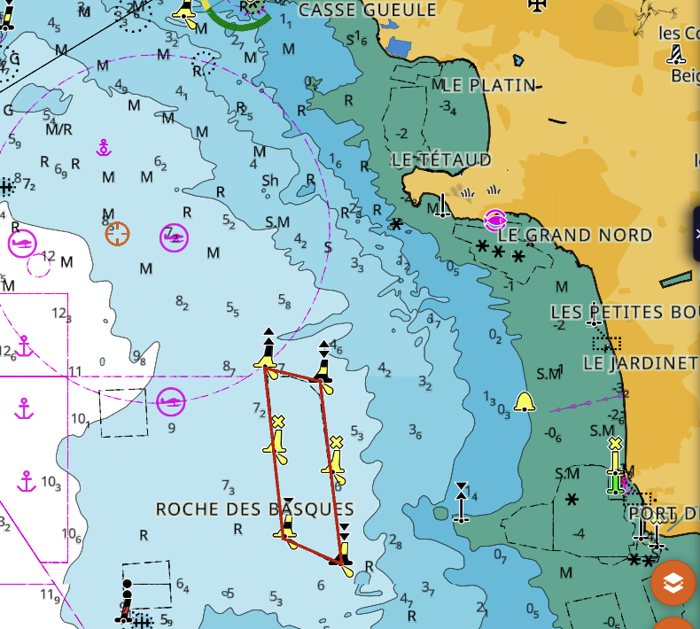
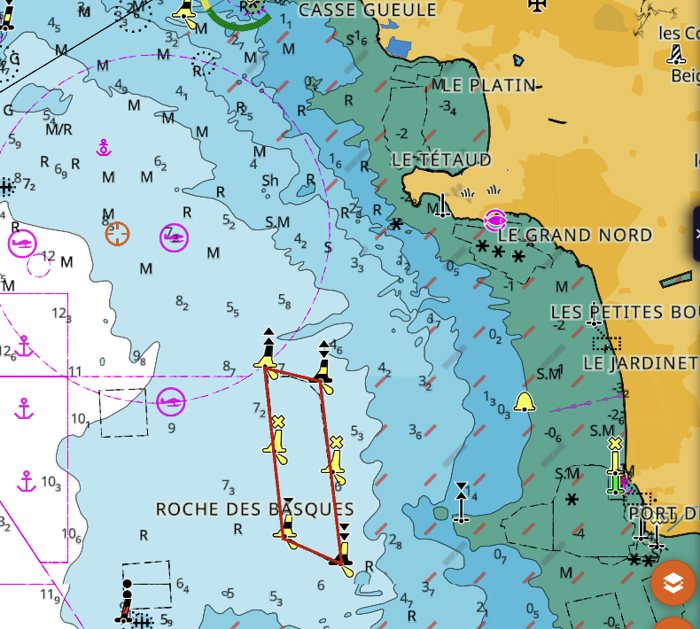
Critical clearance. Shows in red the vertical clearance of the bridges that are lower than or equal to the value set in "Red up to". Switch it on and set "Red up to" to your air draught (height of the masthead above the water, plus a margin). Only bridges whose clearance is known in the chart are concerned. The clearance is written next to the bridge, for example 30 m for the Île de Ré bridge, and only appears when you zoom in close. In the example, "Red up to" is set to 33.6 m: the clearance of the Île de Ré bridge, 30 m, turns red.
Depth contour filter. Shows only the depth contours between the "Min" and "Max" depths. Useful to keep only the contours that matter for your boat. In the example, from 2 m to 10 m: the deeper contours out at sea disappear.
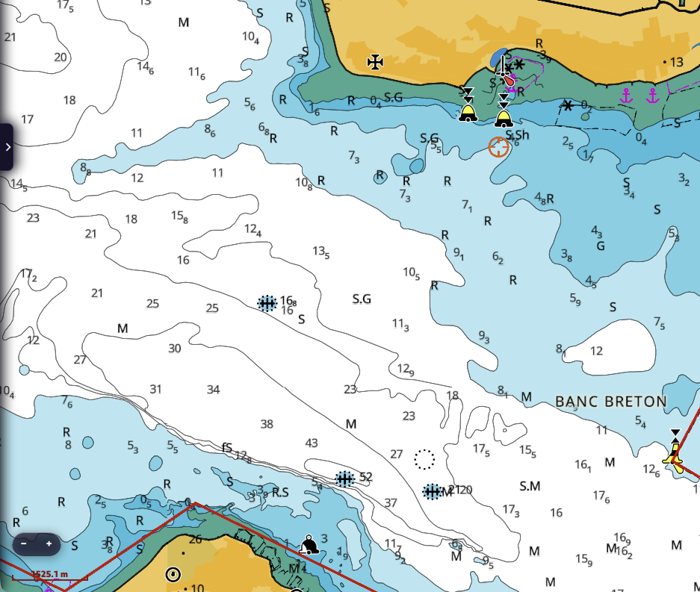
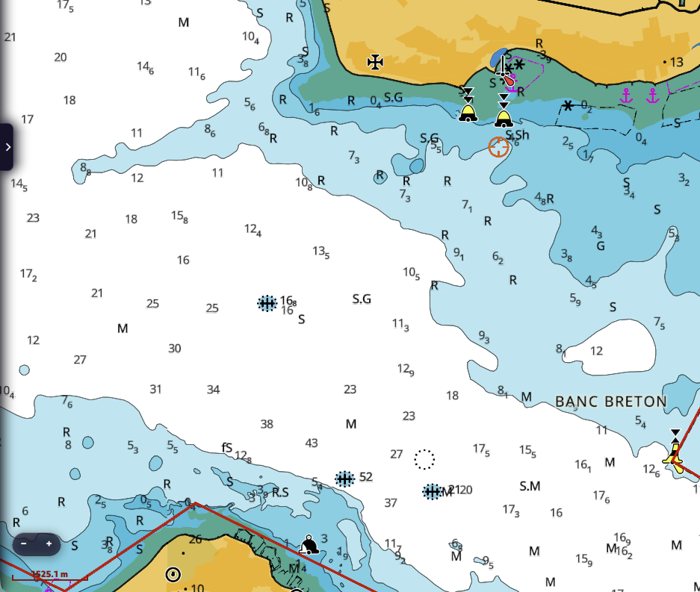
Depth contour labels. Writes the depth on the contour lines, so you can read the depth of a line without looking for the nearest sounding. The values appear when you zoom in close (scale bar of about 300 m or less).
Soundings filter. Shows only the soundings between the "Min" and "Max" depths. Useful to lighten a busy chart. In the example, from 0 to 4.9 m: only the soundings near the coast remain.
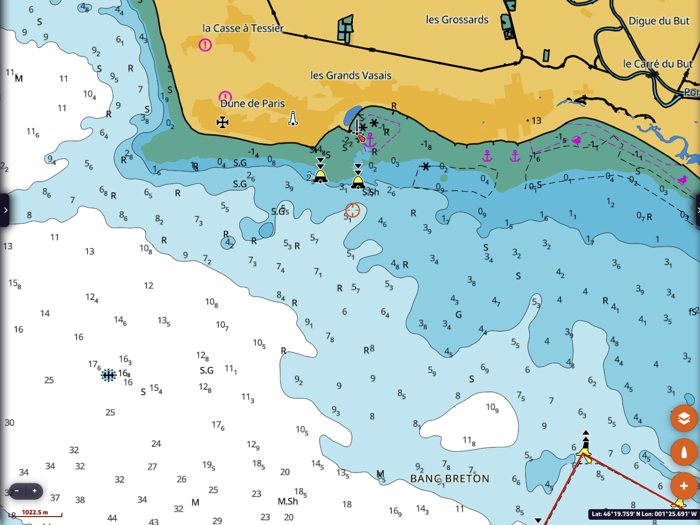
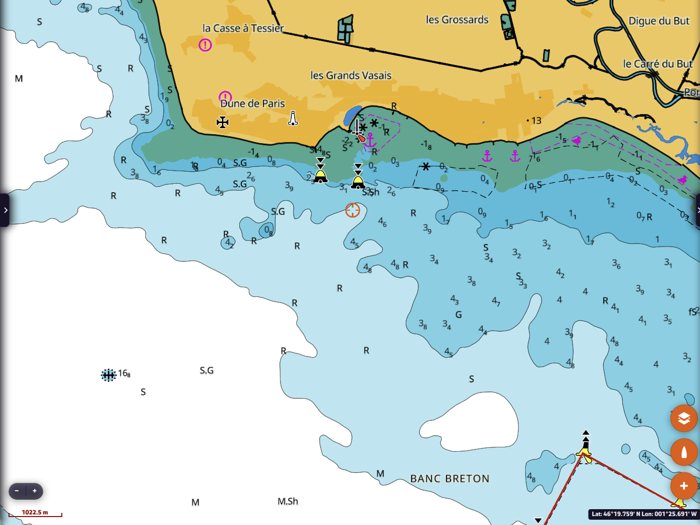
Dangers
Wrecks filter, Rocks filter, Obstructions filter. Each filter hides the wrecks, rocks or obstructions deeper than the value set in "Hide deeper than". Dangers that uncover at low tide (negative sounding, for example a rock at -0.5 m, drying 0.5 m) are always shown. In the example, the wrecks filter hides wrecks deeper than 9.9 m: the wreck at 16.8 m, no danger to a sailing boat, disappears. The value cannot be negative. On most European charts, submerged rocks with a known depth are shown as soundings: the rocks filter then hides little, the wrecks filter declutters more.
Important: a wreck, rock or obstruction without a known depth is never hidden by these filters. These filters make the chart easier to read, they do not make a danger disappear: always keep a margin.
Seabed
Seabed Area (REVEAL X). Colours the seabed according to its nature. The legend under the switch gives the colours: fine sediment, sand, coarse sediment, rocks and boulders, coral, shells, seagrass, mixed sediment. "Nature of seabed" shows either all the types or only the vegetation (seagrass). Useful to choose an anchorage: sand and mud hold well, seagrass and rocks much less.
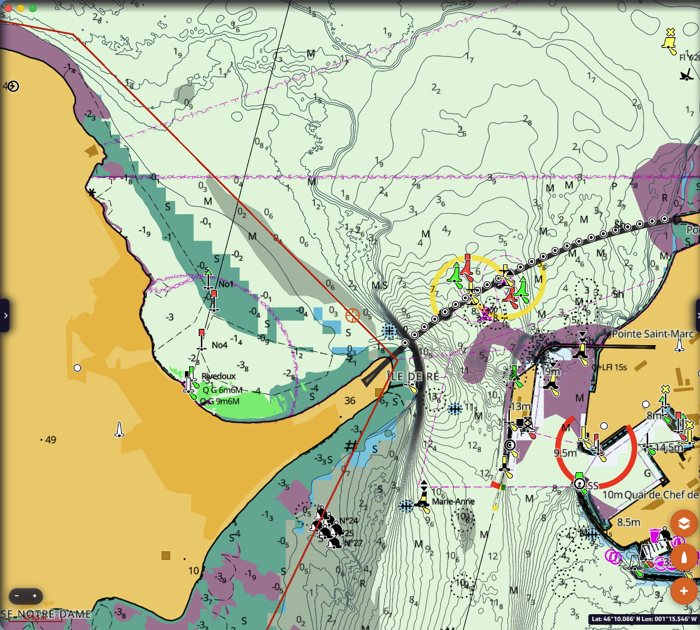
Social Bottom Hardness (REVEAL X). Colours the seabed according to its hardness, from C-MAP's Social Map data. "Smooth" and "High contrast" give two presentations of the same data.
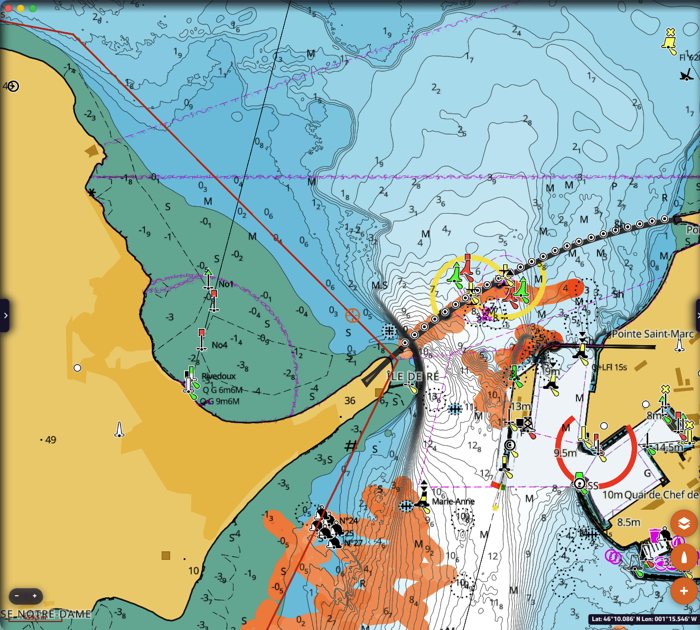
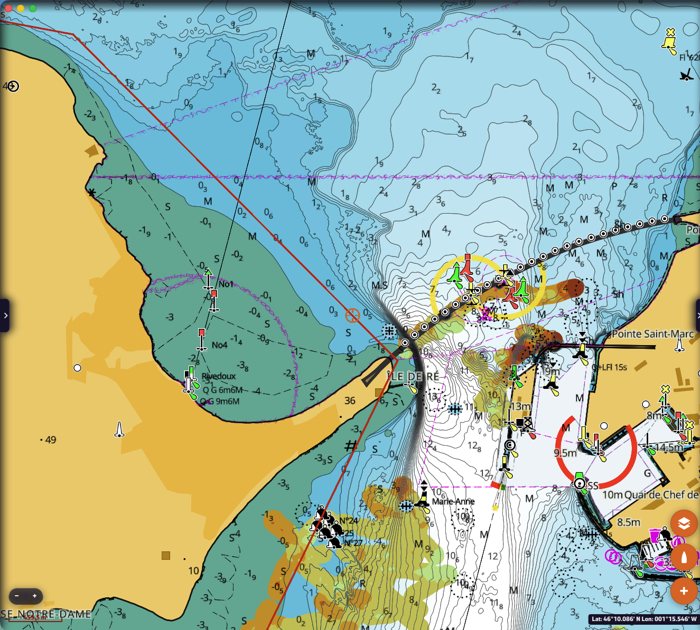
Additional layers
High Resolution Bathymetry. Adds C-MAP's detailed depth contours, much closer together than on the official charts. Also available as a quick button in the layers menu (see above).
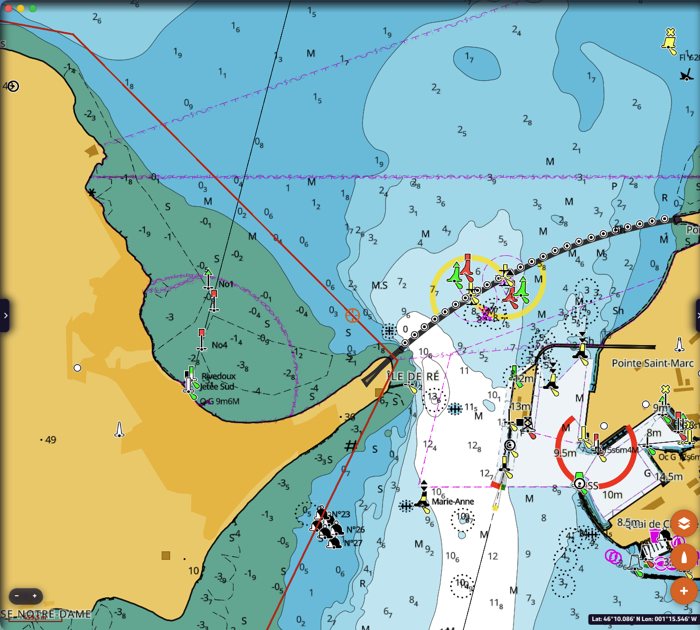
Social Map Bathymetry. Adds the depth data of C-MAP's Social Map, gathered from boats. It can only be switched on when High Resolution Bathymetry is on: otherwise the line is greyed out.
Social Vegetation (REVEAL X). Shows the underwater vegetation from C-MAP's Social Map data, in green.
Shaded Relief (REVEAL X). Colours and shades the relief of the land and of the seabed. "Shaded Relief Opacity" sets its transparency, from 0 % (invisible) to 100 % (opaque).
Satellite Imagery (REVEAL X). Shows satellite imagery: "Land only" on land only, "Enabled" on land and sea. "Satellite Opacity" sets its transparency, from 0 % to 100 %. In the layers menu, switching the satellite on switches the relief off, and the other way round.
Raster Charts appears greyed out: it is not available in NavimetriX today.
Display
Marine Protected Areas. Shows the marine protected areas. "MPA Display Selection" chooses which ones: only the no-access areas, the no-access and most restrictive areas, or all of them. This layer shows the marine protected areas of the United States, Canada, Australia and South Africa. In Europe, protected areas such as national parks (Port-Cros, for example) are shown as restricted areas, always visible on the chart, whatever this setting.
National Text. Shows the names and texts in the language of the country when the chart provides them, instead of the international (English) text.
Text Magnification and Symbol Magnification. Enlarge the texts and the symbols of the chart, for example on a small phone screen. They only affect the C-MAP chart.
Going back to the default presentation
Every setting can be changed back at any time from the same page. To go back to the default C-MAP presentation, switch the filters and alerts off, choose the "Default" chart style and "C-MAP cartography".
See also: C-MAP charts in NavimetriX, to buy, install and download your charts.
In short
- NavimetriX displays the C-MAP DISCOVER X and REVEAL X charts, bought as a Digital License.
- You buy them from C-MAP, on xstore.c-map.com/charts, with a free C-MAP account.
- One chart works on 2 computers or chart plotters and on as many phones and tablets as you need.
- The price includes 12 months of downloads and updates. After that, the charts you have downloaded keep working, with no time limit.
Which C-MAP charts are compatible?
Only the X generation of C-MAP charts: DISCOVER X and REVEAL X. C-MAP explains this generation on its page The X generation of charts.
The older C-MAP charts (DISCOVER and REVEAL without the X, 4D, MAX…) do not work in NavimetriX. Look for the X in the product name.
REVEAL X contains everything in DISCOVER X, plus extra layers:
| DISCOVER X | REVEAL X | |
|---|---|---|
| Vector navigation charts, harbour and approach details, marinas | ✔ | ✔ |
| High-resolution bathymetry, custom depth shading | ✔ | ✔ |
| Tides and currents | ✔ | ✔ |
| Day and night modes | ✔ | ✔ |
| Satellite imagery (shown in NavimetriX) | ✔ | |
| Shaded relief of the coast and the seabed (shown in NavimetriX) | ✔ | |
| Vegetation and seabed hardness layers (shown in NavimetriX) | ✔ | |
| Example price, Central and West Europe (22 September 2026) | €159 / £111.44 | €249 / £174.52 |
Which one should I choose? DISCOVER X has everything you need to navigate. Choose REVEAL X if you want the satellite view, the relief and the seabed layers. Prices depend on the region and the country of the store.
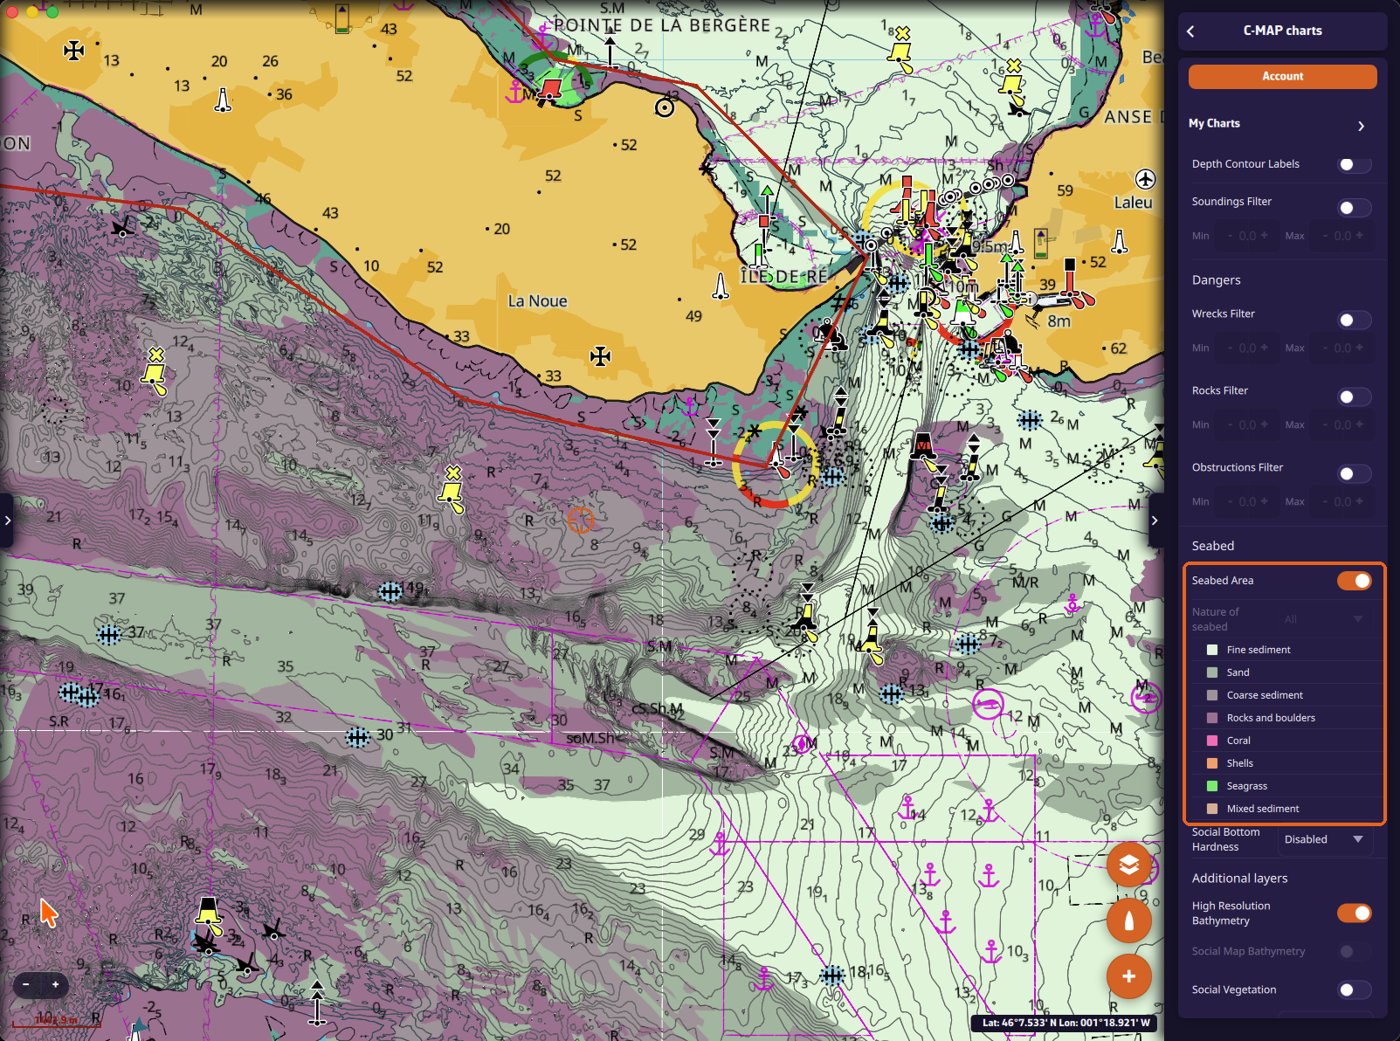
In NavimetriX, the REVEAL X layers are switched on from the layers menu, next to "C-MAP": the first button shows the satellite imagery, the second the shaded relief. The seabed layers are switched on in the C-MAP settings, "Seabed" section.
If you only have DISCOVER X charts, these buttons and settings are greyed out. If you have both types, they stay active, but the REVEAL X layers only show over your REVEAL X charts, not over the DISCOVER X ones.
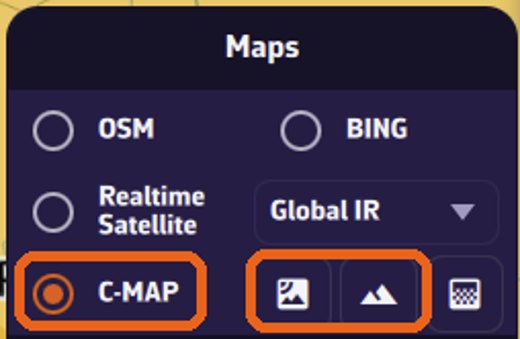
Check the coverage before buying
Open the C-MAP chart viewer, then search for your harbour in the search box at the top left, or zoom in on your sailing area, to see the detail of the C-MAP charts.
Note: the chart viewer gives a preview of what is available. What you see there may not be exactly the same as the chart you download in NavimetriX.
How to buy a chart, step by step
Step 1: go to the right store. Open xstore.c-map.com/charts. C-MAP has several websites; this is the store that sells the X charts as a Digital License. Use the filters on the left: Product (DISCOVER X or REVEAL X) and Area. The flag at the top right changes the country, the language and the currency.
Step 2: ignore the "Product Compatibility" window. The first time you open a chart, C-MAP shows a window that only lists B&G and Simrad chart plotters. NavimetriX is not in this list yet, but it is compatible. Click "Yes, continue to purchase".
Step 3: choose "Digital License". On the product page, next to "Media Type", select Digital License, not Micro SD. The line "System requirement: a compatible chart plotter is required" does not apply to NavimetriX. Then click "Add to cart" and pay.
The chart is added to your C-MAP account automatically after the purchase.
Your C-MAP account. When you click "Sign in" on the store, or when you pay, C-MAP asks for your email address. The same page is used to sign in or create an account: enter your email, then follow the steps. Remember this email and password: you will use them in NavimetriX.
The purchase also includes "12 months of Premium C-MAP mobile app subscription". This concerns C-MAP's own app. You do not need it to use your chart in NavimetriX.
Using your chart in NavimetriX
1. Open the C-MAP settings. Open the settings panel, then "C-MAP charts".
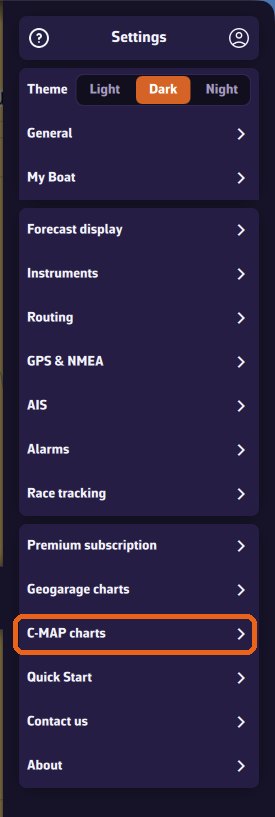
2. Sign in. Tap "Account", then "Sign in to C-MAP". A C-MAP page opens in your browser: enter the email and password of your C-MAP account, then come back to NavimetriX.
Once signed in, the window shows your email and "✓ Device registered to this account". If it says "Device not registered", tap "Register this device".
The dot on the "Account" button shows the status at a glance: green = signed in and device registered (you can download new zones); orange = signed in, but the registration of the device is not confirmed (for example if C-MAP does not respond); red = not signed in. Zones you have already downloaded are displayed in all cases: only downloading new zones depends on it.
3. Download a zone. Charts are not downloaded whole: you choose the zones you need. Open "My Charts". The charts you own are listed at the top, with their type (REVEAL X or DISCOVER X), their code and their end-of-subscription date. The same code appears on the zones you download from that chart. Tap "Add a zone".
A rectangle appears on the map. Move and resize it with the green handles so it covers your sailing area, then tap OK.
If several of your charts cover the zone, NavimetriX asks which one to use. Then choose the layers to download and tap "Download". "Navigation charts" is the essential layer. Satellite images and shaded relief (REVEAL X only) are larger: on a phone, keep them for the areas where you really want them.
A banner shows the progress. You can keep using the app meanwhile.
Once the download is finished, the detailed chart is displayed inside the zone, even with no Internet connection. The zone is listed in "My Charts" and its outline is drawn on the map. The round refresh button next to a zone updates it (see below).
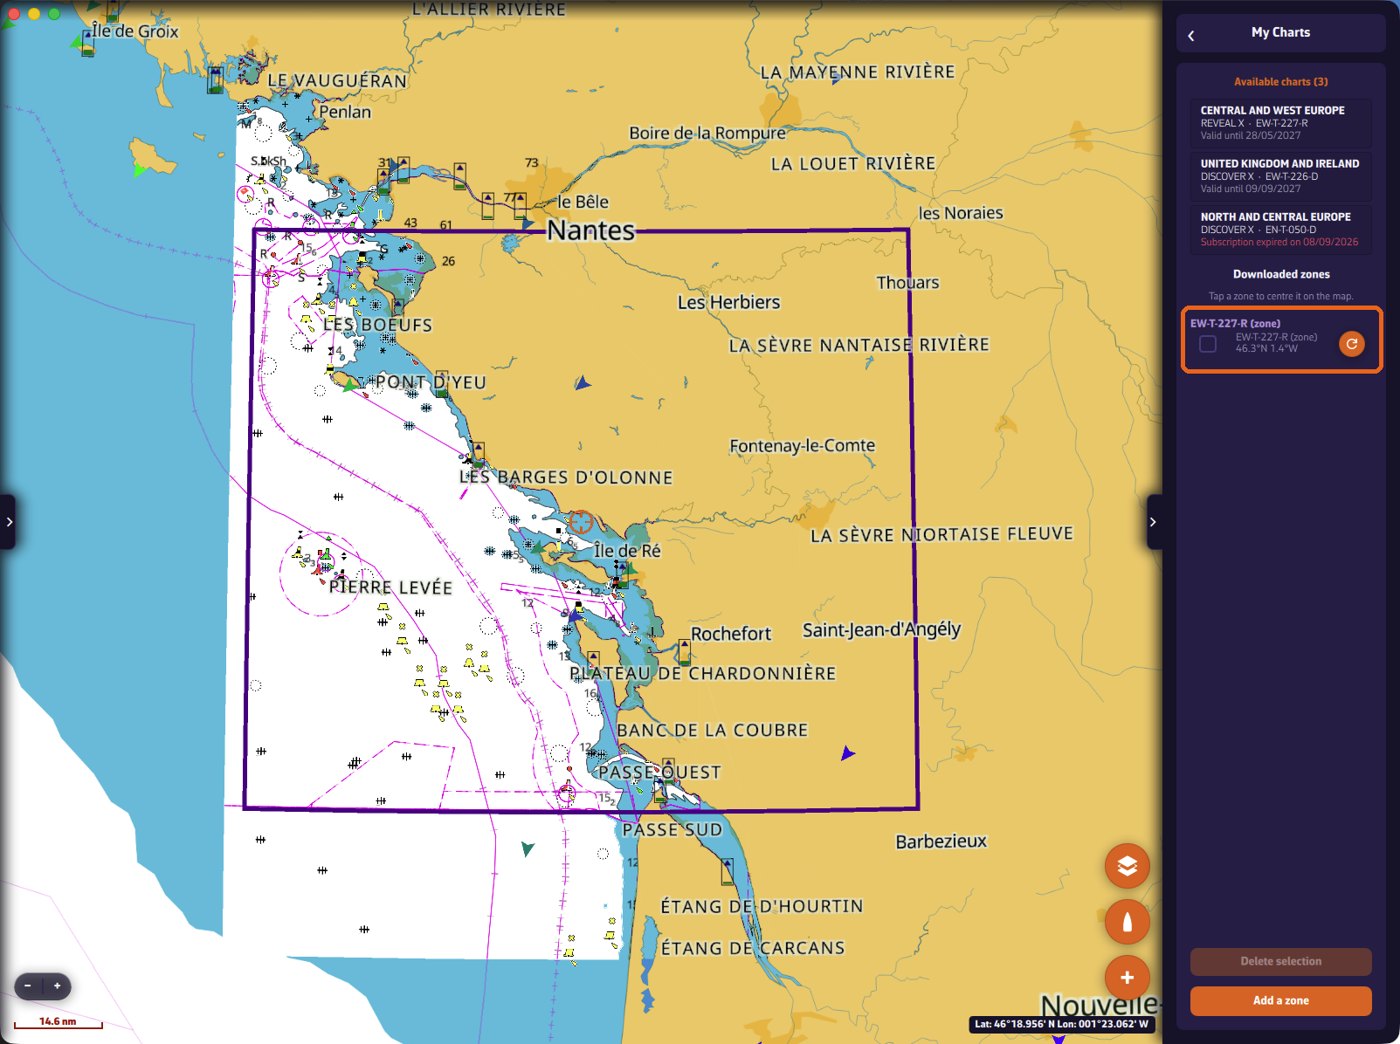
Adding layers later, or updating a zone. To add the satellite images or the relief to a zone you have already downloaded, or to update it, open "My Charts" and tap the round refresh button to the right of the zone. NavimetriX analyses the zone ("Analyzing zone…"), then lists the layers you can add or update. Tick them and tap "Download" (with no layer ticked, this button reads "Save" and only saves the zone name). Do not use "Add a zone" for this.
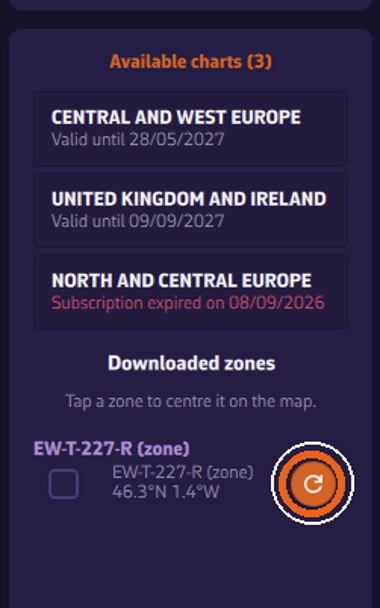
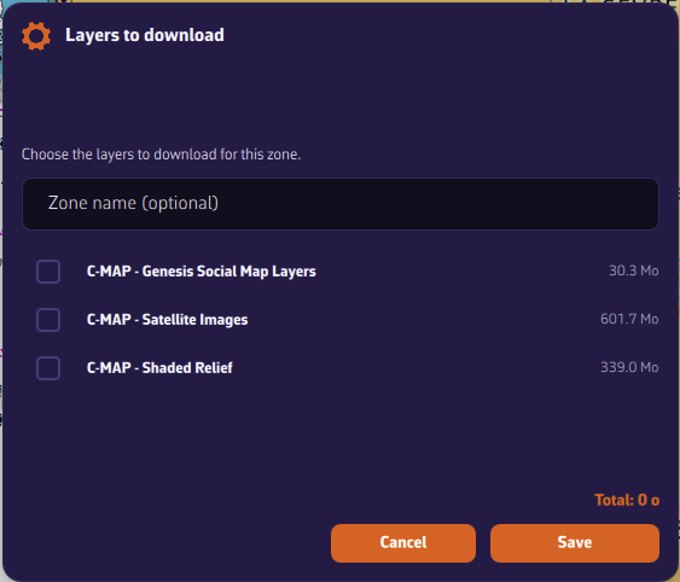
Chart settings. Every C-MAP display setting (depth alerts, filters, seabed, relief, satellite…) is explained, with screenshots, on the page C-MAP chart settings in NavimetriX.
On how many devices can I use my chart?
- 2 computers or chart plotters: Windows PC, Mac, Linux, and B&G or Simrad chart plotters all count in these 2 places.
- Phones and tablets (iPhone, iPad, Android): as many as you need.
To free a place, tap "Unregister this device" in the C-MAP Account window of that device. This removes the charts and zones from that device. The button "Manage my devices on c-map.com" opens your C-MAP account, where you can see and remove the other devices.
What happens after 12 months?
The price of a chart includes 12 months of downloads and updates. C-MAP confirmed to us (22 September 2026):
- The zones you have already downloaded keep working, with no time limit, with all their functions: chart display, object information, search, tides and currents. Your charts do not stop at sea.
- Without an active subscription, you cannot download new zones and you do not receive updates any more.
- To download and update again, you extend or renew the subscription, at half the chart's price (see below).
"My Charts" shows the end date of each chart. When the subscription has ended, the date is shown in red ("Subscription expired on…").
Our advice: before the end of the 12 months, download every zone you may need, on every device you use.
Extending or renewing your subscription at half price
This is done on the C-MAP store, not in NavimetriX. Sign in to xstore.c-map.com, click your name at the top right, then "My Account" and "My Charts". The "Digital License Charts" section lists your charts, each with the end date of its subscription and one or two buttons:
- "EXTEND SUBSCRIPTION": the subscription is still running.
- "RENEW SUBSCRIPTION": the subscription has ended (date in red).
- "UPGRADE TO REVEAL X": on a DISCOVER X chart, to switch to REVEAL X.
Extend (subscription still running). The 12 months are added to the current end date, so you lose nothing by extending early. In this example, a subscription running until 9 September 2027 is extended to 9 September 2028. The window is titled "Renew Subscription" even in this case.
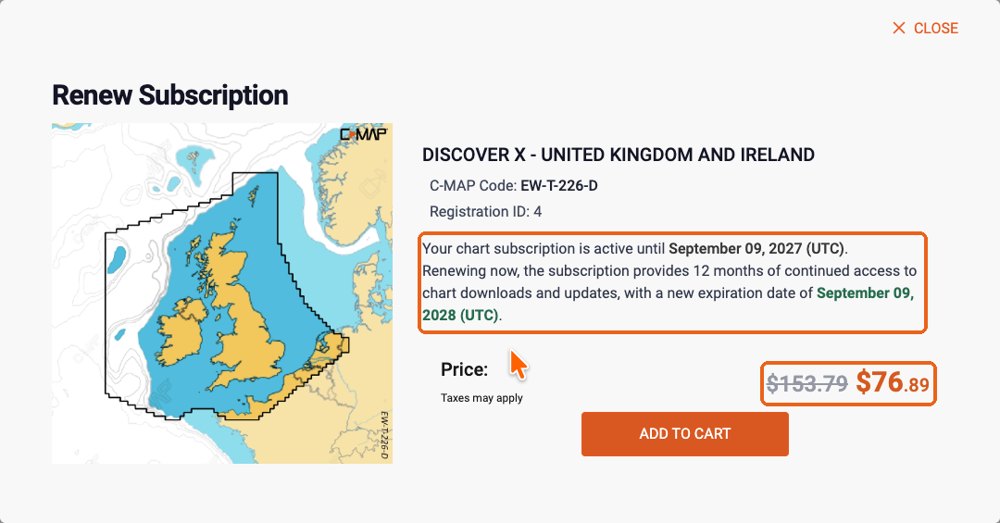
Renew (subscription ended). The 12 months start on the day you renew. In this example, a subscription that ended on 8 September 2026, renewed on 23 September 2026, runs until 23 September 2027.
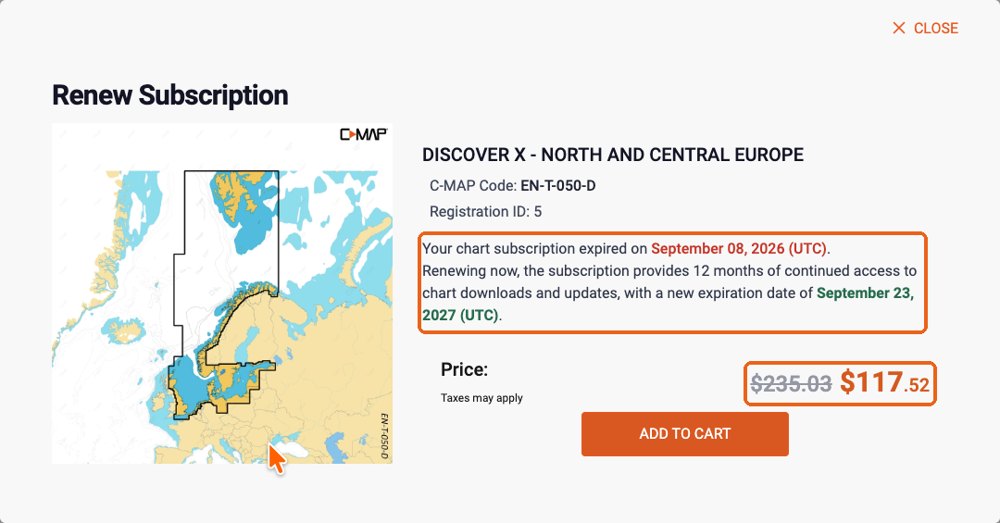
In both cases the full price is struck through and you pay half, shown in orange. Click "Add to cart" and pay. The store shows prices in the currency of the country selected at the top right.
After upgrading DISCOVER X to REVEAL X
An upgrade replaces your chart with a new one: its reference changes (for example EW-T-227-D becomes EW-T-227-R) and the DISCOVER X subscription ends on the day of the upgrade. If NavimetriX then still shows the old chart as "Subscription expired":
- Quit NavimetriX completely and open it again, connected to the Internet, then open "C-MAP charts" → "My Charts". The REVEAL X chart should appear with its new end date.
- If it still does not appear: "Account" → "Unregister this device", then "Register this device". This deletes the zones downloaded on this device: download them again afterwards.
Practical cases after the end of the subscription
I change my phone or tablet. The zones cannot be moved to the new device, and the new device cannot download them without an active subscription. C-MAP customer care handles a phone change case by case.
I change my computer. Same answer: the new computer cannot receive the charts while the subscription has ended.
The app is reinstalled, or the phone is reset or repaired. On a phone or tablet, the downloaded zones are lost and can only be downloaded again with an active subscription. On a computer, the charts may still work in some cases, as long as the computer is recognised as the same device.
While the subscription is active, none of this is a problem: you can download your zones again at any time, on any registered device.
Where to ask for help
For the NavimetriX side (signing in, downloading, displaying), contact us through the app ("Contact us" in the settings). For your C-MAP account or a purchase, e-mail C-MAP customer support: eu-customersupport@c-map.com in Europe, us-customersupport@c-map.com in the United States, apac-customersupport@c-map.com in Asia and Australia. Contacts for other regions are on the C-MAP contact page.
Display GPS data from your phone
While sailing, if you want to display your phone’s GPS data, open Settings by tapping the chevron handle (‹) on the right edge of the screen.
Go to the GPS & NMEA menu and make sure the GPS source is set to Internal. In Advanced mode, GPS source becomes a list (Internal, Instruments, GPS, AIS) on the GPS tab: choose Internal there too.
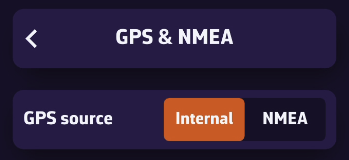
Exit this menu, then open Instruments. Turn on the Visible switch and check that Bar visible is on too (it is by default). Finally, make sure the loaded configuration (Load) is GPS View.
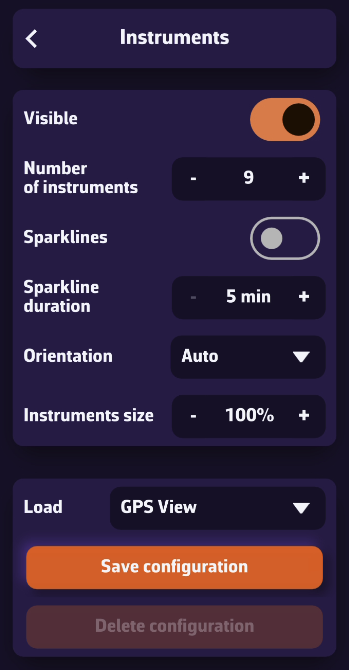
Once your phone receives a GPS signal, the time of the last position, your speed over ground (SOG), and your course over ground (COG) will be displayed in the instrument bar.
You can scroll through the parameters to view your coordinates and POI data if you’ve selected a waypoint using the Goto function (DTW: distance, BTW: bearing, TTG: time to go).
On a phone, tiles show acronyms by default (TIME, SOG, COG…) with a sparkline; elsewhere, full names. The Tile titles setting (Acronyms / Names) on the Instruments page changes this.
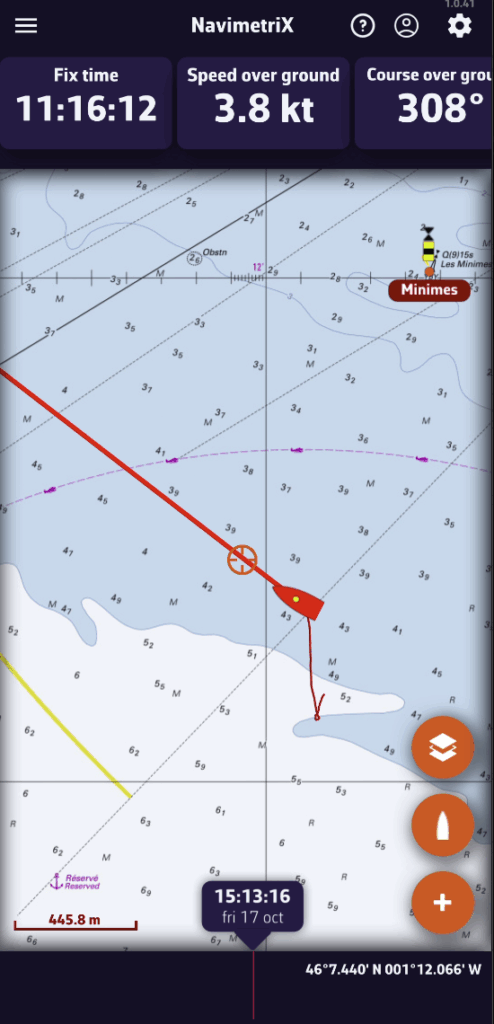
On phones, the default display is horizontal.
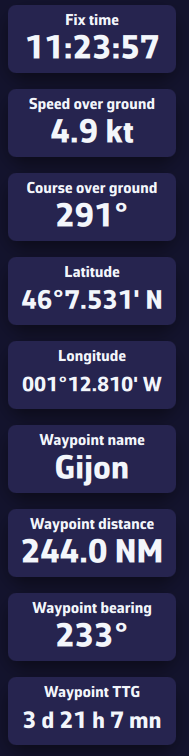
On tablets or computers, the layout automatically adjusts to a vertical view.
USB-connected GPS devices, also known as GPS mice, are supported by NavimetriX on computers (macOS, Windows and Linux). NavimetriX reads the NMEA sentences the GPS sends on its serial port directly.
Phones and tablets have no serial port: the SERIAL choice is greyed out there.
Prerequisites
A driver matching the connected device must be installed in the operating system beforehand. These are usually Prolific or FTDI drivers, depending on the type of device connected.
NMEA is a Premium subscription feature.
Setup
Open Settings by tapping the chevron handle (‹) on the right edge of the screen, then select GPS & NMEA.
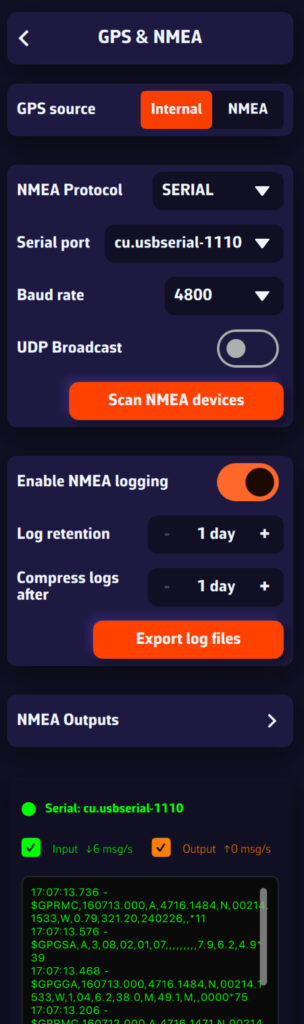
Select:
- GPS source = NMEA
- NMEA switch = on
- NMEA Protocol = SERIAL
- Serial port = open the menu and select the GPS port (COM3, COM4… on Windows; cu.usbserial… on a Mac).
- Baud rate = the one given in the GPS manual. The menu offers 4800, 9600, 38400 and 115200; the default is 9600, and many NMEA 0183 GPS units transmit at 4800.
Important: do not leave GPS source on Internal. With Internal, NavimetriX uses the position supplied by the system's location service and ignores the USB GPS. On a Mac, this internal position is never used for the boat in Navigation mode.
Simpler: press Scan NMEA devices, then Start Scan. On a computer, the scan tries each serial port at 9600, 4800, 38400 and 115200 baud. Then press Apply settings: NavimetriX sets the port, the baud rate and the GPS source, and turns the NMEA switch on.
The incoming sentences should scroll in the Incoming NMEA sentences console at the very bottom of the page.
In Advanced mode, you can also connect the GPS on its own link: GPS tab, GPS source = GPS, then the same protocol, port and baud rate settings.
Bluetooth GPS on Windows
Once paired, a Bluetooth GPS appears in Windows as a COM port ("Standard Serial over Bluetooth link"). The settings are the same: GPS source = NMEA, NMEA switch on, NMEA Protocol = SERIAL and that COM port. See How do I connect a Bluetooth GPS with Windows 11?
Tip: if the serial port does not work, open the drop-down menu and check whether another port is available. If no port is available, the driver is probably not the right one. If the port opens but nothing scrolls, try another baud rate.
To change the instruments displayed, open Settings by tapping the chevron handle (‹) on the right edge of the screen, then select Instruments.
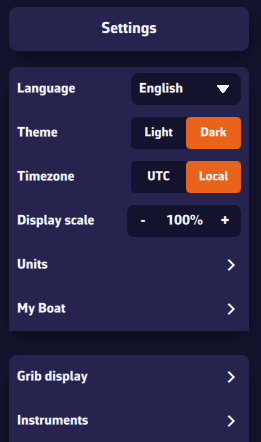
You will see several settings:
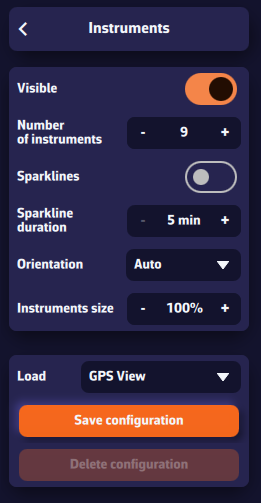
- Visible: shows or hides all instruments.
- Bar visible: folds away the instrument bar only; gauges placed on the chart stay on screen.
- Tile titles: Acronyms (SOG, COG, DPT…) or full Names. Phones start with acronyms.
- Damping: smoothing of the displayed values, per data family.
- Sparkline duration: period covered by the small graph under the values, from 5 to 60 minutes.
- Orientation: Horizontal (bar), Vertical (column on the side) or Auto (depending on the screen).
- Scrolling: in horizontal mode (especially on phones), scroll the instrument bar to the right to see more.
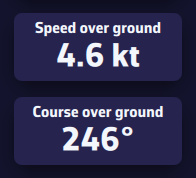
To make the instruments larger, drag the inner edge of the bar (double-click or double-tap: automatic size).
Change the data shown by a tile
On a computer, right-click an instrument; on a phone or tablet, long-press it. The instrument settings dialog opens with a preview: choose the Displayed data and turn its Mini-graph on or off. The Delete button removes the instrument.
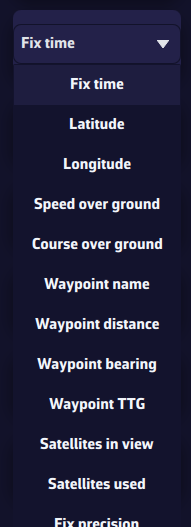
Add an instrument
Tap the round orange “+” button at the bottom right of the chart, then Add instrument. Pick the type in the grid, then Add to instrument bar or Add to chart.
Configurations
The Load menu offers four ready-made configurations: GPS View, Cruising View, Upwind View and Downwind View. To keep your own layout, tap Save configuration, give it a name and save: you can then switch between your configurations by selecting their name in the list. Delete configuration removes a saved configuration.
Saved configurations are specific to each device: they are not synchronized between your phone and your computer, so that each screen keeps a suitable layout.
For everything about instrument types, moving them onto the chart and resizing them, see What are the instruments for and how do I customize them?
To receive NMEA data from your onboard instruments:
- First, make sure you are connected to the Wi-Fi network of your NMEA server or repeater (MiniPlex, NKE Wi-Fi box, etc.).
- Open Settings by tapping the chevron handle (‹) on the right edge of the screen.
- Select GPS & NMEA.
NMEA is a Premium subscription feature.
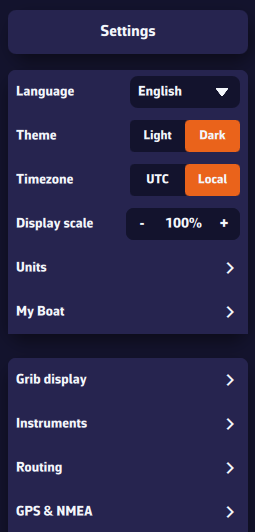
The easiest way: scan for streams
Press Scan NMEA devices, then Start Scan. NavimetriX tries the settings of common gateways (and, on a computer, the serial ports) and lists each stream found with the sentences it carries.
Leave your instruments' stream on Instruments (choose Ignore for a stream you do not want), then press Apply settings. NavimetriX fills in the protocol, IP address and port, turns the NMEA switch on and, if the stream carries a position or AIS, takes them from that stream.
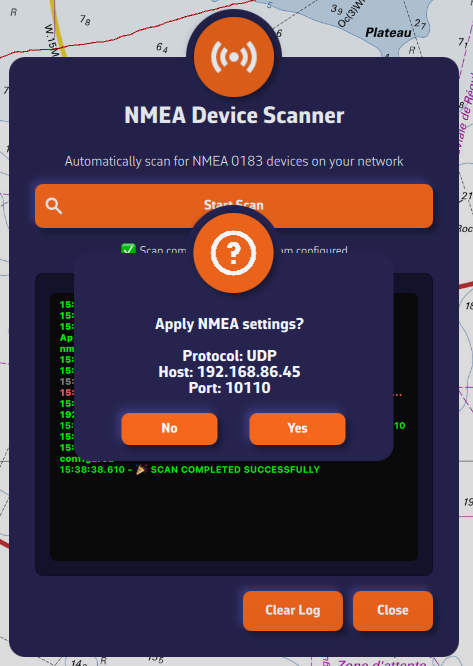
Manual setup
If the scan finds nothing, set the page up yourself:
- GPS source: choose NMEA to take the position from your instruments' stream. Internal uses the device's own GPS.
- NMEA switch: turn it on. It is off by default and controls all NMEA reception and output on this device.
- NMEA Protocol: preferably UDP, otherwise TCP. SERIAL is for USB links, on computers only. DEMO replays a recorded sailing session so you can try the app ashore (see DEMO mode).
- Server IP address: the IP of your NMEA server or repeater, required for TCP. In UDP, NavimetriX listens on the port on every network: only the port matters.
- Server port: the port used by your NMEA source (10110 by default).
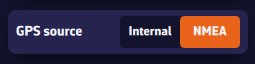
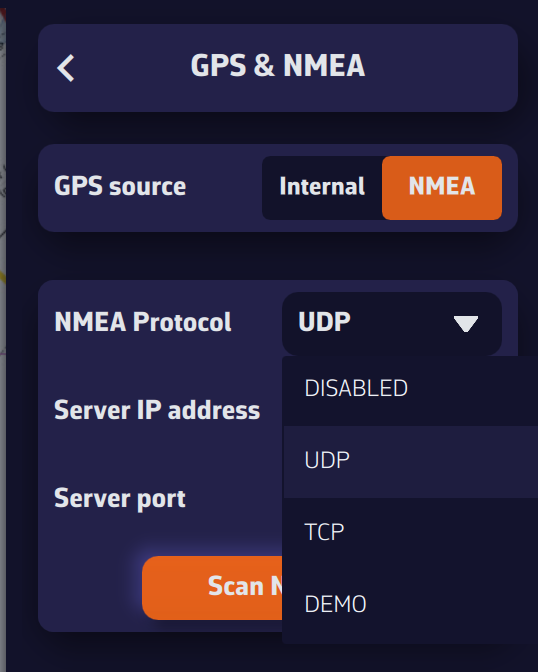
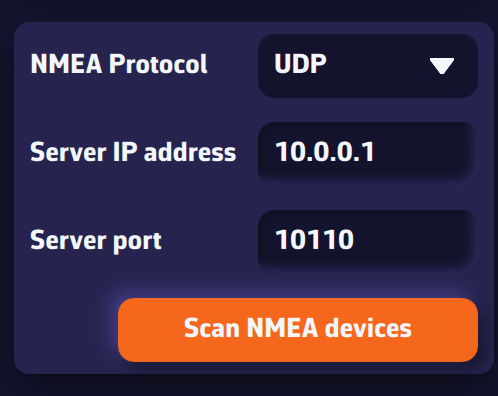
Once connected, received sentences appear in green in the Incoming NMEA sentences console at the very bottom of the page (sentences sent by NavimetriX appear in orange).
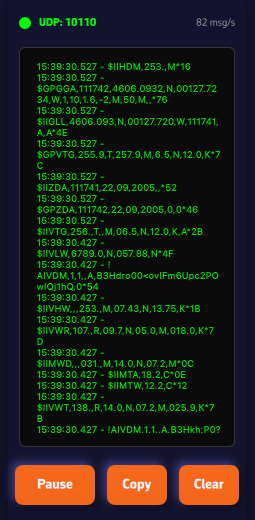
Your GPS or AIS arrives on a different link from your instruments? Turn on Advanced mode: see My instruments, GPS and AIS are on separate links. Can I connect them all? and Which link provides the position, and what happens if it fails?
NMEA log
The log section, below the Barometer section, lets you enable NMEA logging (on by default, except in DEMO). All received sentences are then recorded. You can set the log retention (60 days by default, from 1 to 365) and choose after how many days logs are compressed (7 days by default). Uncompressed daily files can be large (around 60 MB); once compressed, they are about 10% of their original size.
The Export log files button (Share log files on phones and tablets) lets you save these files for analysis or replay with external tools such as VDR Player.
You can also replay them in NavimetriX: the Tracks tab imports NMEA logs (.txt, .nmea, .log, .gz) and turns them into tracks. See How do I replay a track (Replay)?
Further down the page are the NMEA Outputs (sending data to your instruments), the Remote cockpit and the Incoming NMEA sentences console.
The instruments display your boat's live data (wind, speed, heading, performance, energy, depth…) coming from the NMEA / GPS network. The gauges refresh continuously and can be arranged freely to suit your needs.
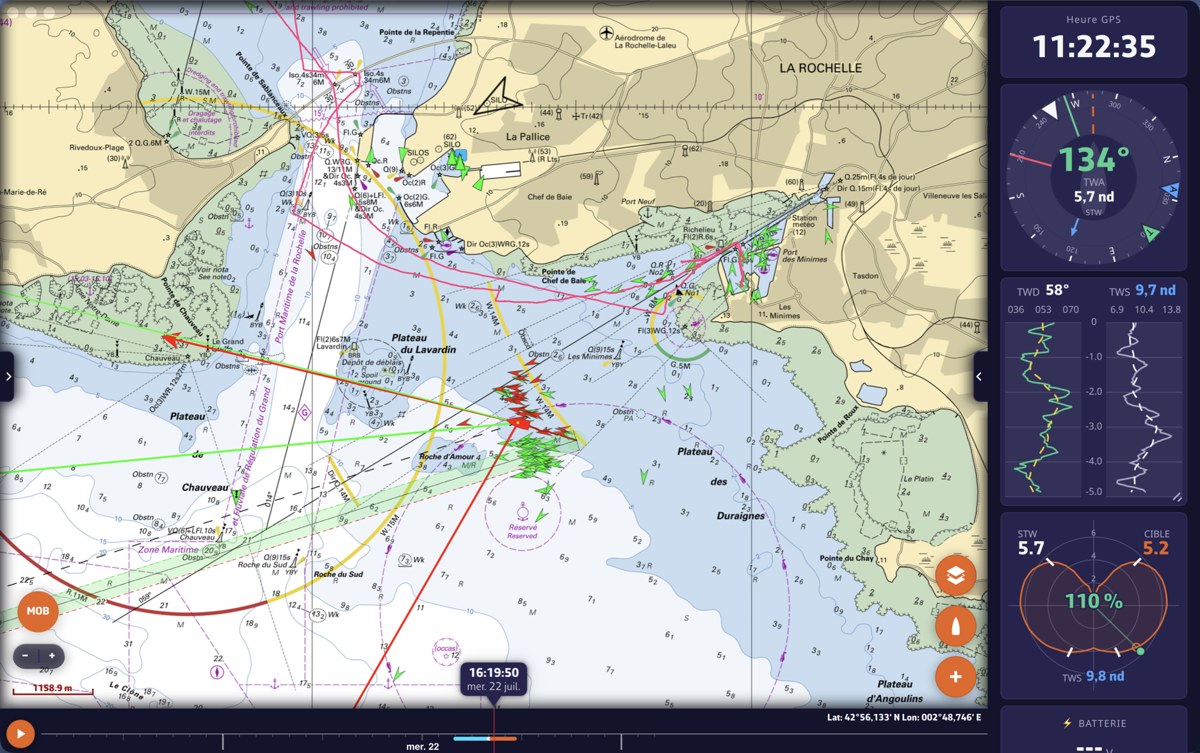
Where the instruments appear
All instruments live in a single, reorderable bar whose shape adapts to the screen orientation:
- Horizontal bar at the top of the screen (portrait mode);
- Vertical dock on the side (landscape mode), on the right by default;
- On the chart: any instrument can be detached from the bar and dropped onto the chart as a floating gauge (movable and resizable).
Show / hide: Settings > Instruments > "Visible", or the "Show instruments" option in the Navigation Mode dialog. Your choice is remembered. The "Bar visible" switch just below folds away the bar only: floating gauges dropped on the chart then stay visible.
The 19 instrument types
Each instrument is self-contained and can be present in several instances. The Numeric value, Needle gauge and Chart tiles let you choose the displayed data from some forty fields (SOG, COG, heading, TWS/TWA/TWD, AWS/AWA, VMG, current, depth, temperatures, pressure, route and performance data…).
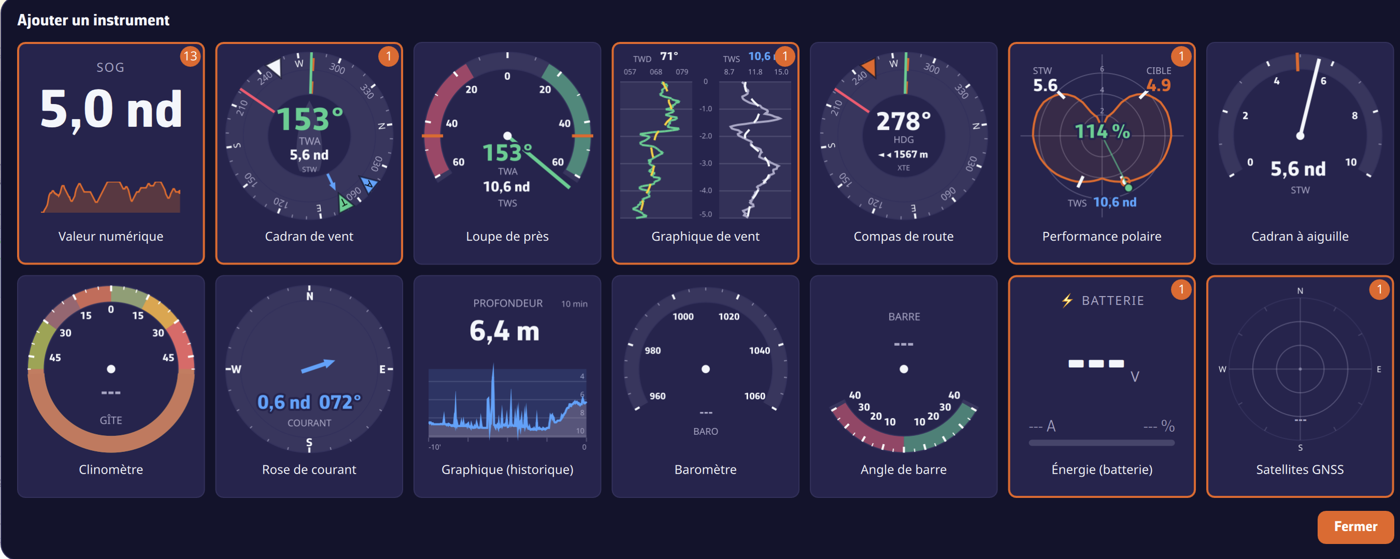
- Numeric value: digital tile: label, large number, unit, and an optional trend sparkline.
- Dual tile: two related values in one tile (true wind, apparent wind, speed and course over ground, waypoint, depth and water temperature…) or a gap to the polar target (STW %, VMG %, TWA error).
- Wind dial: composite dial: heading-up compass rose, central TWA (tap → AWA), STW speed (tap → SOG), wind arrows, laylines, current.
- Close-hauled wind: ±60° upwind magnifier: TWA needle coloured by tack, optimal upwind angles from the polars.
- Wind plot: scrolling histories of TWD and TWS, TWD coloured by tack plus a smoothed trend.
- Steering compass: heading-up compass: HDG, COG, waypoint bearing, laylines and cross-track error (XTE) with a "which way to steer" arrow.
- Polar performance: polar plot: curve for the current TWS, current point, target, VMG marks and performance % (requires a polar file).
- Needle gauge: 240° analog auto-scaling gauge on a speed (STW, SOG, TWS, VMG…).
- Clinometer: heel: ±50° arc with comfort / warning / excess zones.
- Current rose: current arrow (length ∝ speed) in its direction, with speed & direction in figures.
- Chart (history): trend curve for any data (adjustable window, moving average, marker, colour); sounder rendering for depth.
- Barometer: aneroid barometer, needle on the NMEA pressure plus a 3 h trend.
- Barograph: pressure curve over 2 h, 8 h, 24 h or 10 days, with the current value and its 3 h tendency.
- Rudder angle: ±40° indicator, port red / starboard green (NMEA RSA / XDR).
- Energy (battery): battery bank: voltage, signed current, state of charge % (NMEA XDR).
- GNSS satellites: sky plot of the satellites by constellation (GPS/GLONASS/Galileo/BeiDou/QZSS), used/in view.
- Course tracking: table of what is left to sail, leg by leg: mark, distance, heading, wind angle, sail, passing time (see How do I follow my course leg by leg?).
- Sailchart: the boat's position on its own sail chart, with the trail of the last minutes (see Which sail should I carry?).
- AIS fleet: ranking of the fleet followed in the AIS tab against your boat.
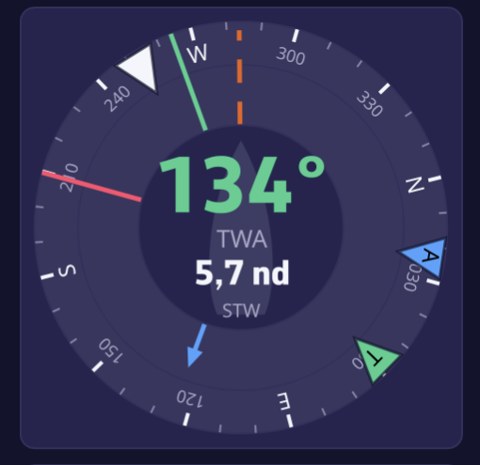
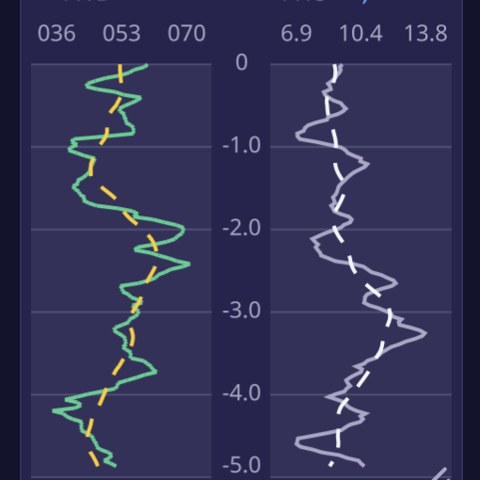
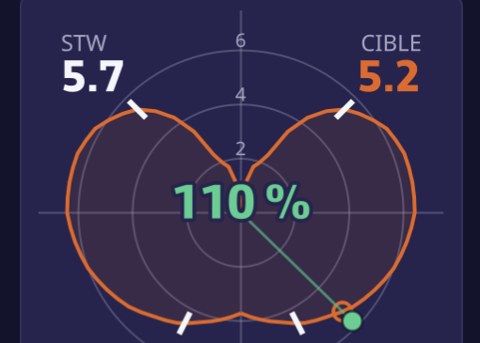
Adding an instrument
- The round "+" button at the bottom of the chart › menu › "Add instrument";
- Right-click / long press on the chart: the grid opens in "drop at the clicked point" mode and places the chosen gauge there (floating).
The "Add instrument" grid shows each type with a live preview fed by your boat's real data; a card already in use carries a badge showing how many instances are present (duplicates are allowed). From the "+" menu, a prompt asks where it should go: "Add to instrument bar" or "Add to chart".
Configuring an instrument
Right-click (computer) or long press (touch) on an instrument opens its settings dialog, with a large live preview that updates instantly. Depending on the type you will find: Displayed data, Battery bank, Sparkline, Wind angle (TWA/AWA), Boat speed (STW/SOG), Time window (5 min → 3 h), Moving average, Marker, Curve colour, Square tile background, as well as Delete and Close.
Direct shortcuts (without opening the settings): tapping a chart's header cycles its time window; tapping the centre of a wind dial toggles TWA↔AWA (top) and STW↔SOG (bottom).
Reordering & moving
- Reorder: drag a tile along the bar: a ghost copy follows the cursor and an insertion slot opens. On touch, a long press first "lifts" the tile.
- Detach onto the chart: drag a tile across the bar → it becomes a floating gauge.
- Re-dock: drag a floating gauge onto the bar → release at the target slot.
- An alignment grid and blue guides appear while moving.
Resizing
- The bar: drag its inner edge (double-click / double-tap = automatic size); on touch, via the small handle on the border.
- A chart tile: handle at the bottom-right corner.
- A floating gauge: corner handle (mouse) or pinch (touch).
On touch, the bar and the layout are remembered separately in portrait and in landscape.
Preset layouts & orientation
Four built-in presets lay out a whole set of instruments in one go: GPS View, Cruising View, Upwind View, Downwind View. In Settings > Instruments you can Load a preset, save the current layout under a name with Save configuration, or remove one with Delete configuration. The Orientation setting (Auto / Horizontal / Vertical) determines whether the bar is a top strip or a side column.
To simply change which instruments of an existing preset are visible, see also "How do I change the instruments displayed?".
Prerequisite: make sure your NMEA stream is properly configured and that you are receiving AIS sentences (they start with AIVDM).
Note: AIS targets received on board are only visible when Navigation mode or the NMEA switch is on. The Navigation switch is at the top of the left panel. AIS targets over Internet are always shown.
Enable AIS target display
Open Settings by tapping the chevron handle (‹) on the right edge of the screen.
- Select AIS.
- Enable Display AIS targets.
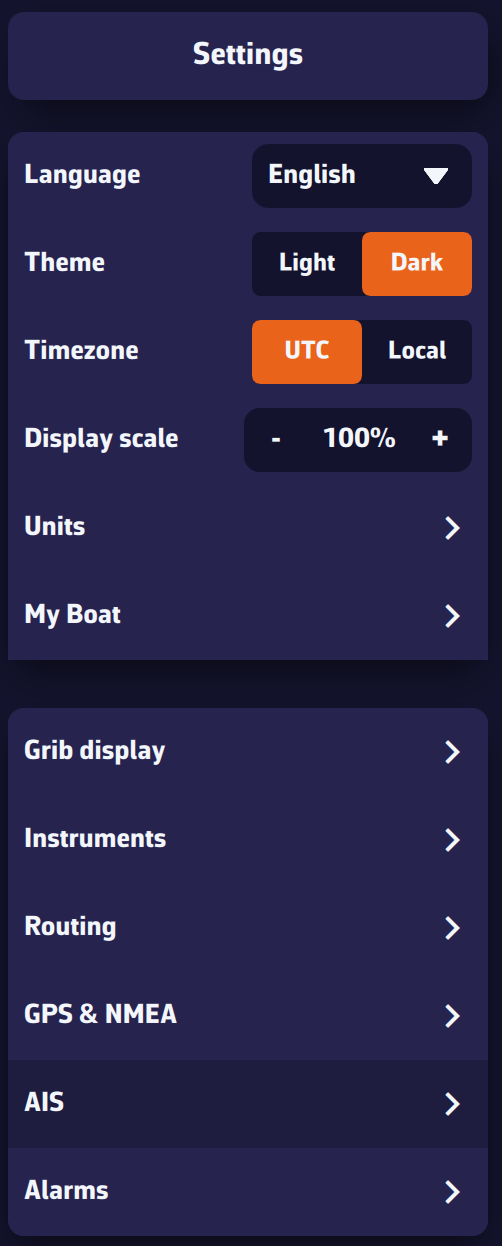
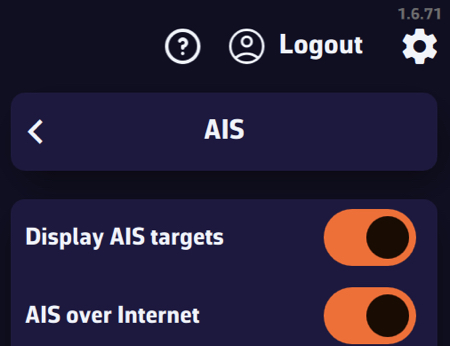
Display settings
- Display boat name & speed: show/hide target name and speed (global setting).
Tip: turn off near the coast when many targets are visible; turn on offshore when few targets are visible. - Remove lost targets after: time before a target disappears without a received sentence (20 min by default, from 1 to 60 min). The target fades out: 100% visibility after a recent sentence down to 0% at the timeout.
- COG vector length: course-over-ground vector length, from 0 to 60 minutes.
- Display track: global option to display tracks for Selected targets or All targets.
Tip: “Selected” near the coast (many targets), “All” offshore (few targets). - Track length: Tip: short near the coast (busy areas), long offshore (few targets).
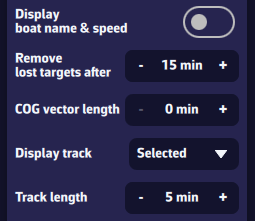
Proximity alarms
- CPA (Closest Point of Approach): minimum distance at closest approach.
- TCPA (Time to CPA): time remaining until CPA.
- Triggering: the alarm triggers when both conditions (CPA and TCPA) are met for 15 seconds. Default thresholds: 0.5 nm and 10 min.
- Sound alarm: adds a sound to the alarm.
- Draw CPA line: option to show/hide CPA lines on the chart.
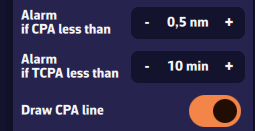
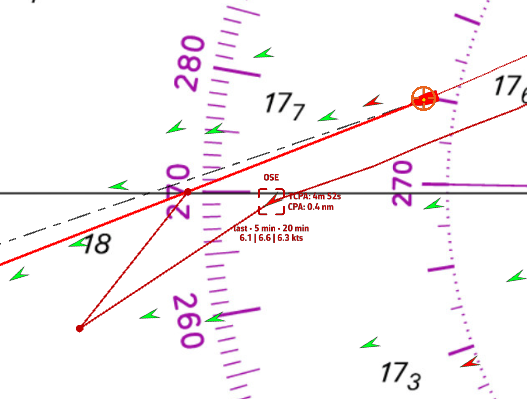
Hide Class B AIS targets
You can hide Class B AIS targets (small recreational boats) to show only Class A (cargo, ferries, etc.): useful at crowded race starts.
Chart interactions
- Icons: green by default. Chevron for Class B, triangle for Class A. Targets in alarm are red.
- Short tap/click on a target: select it and show its track, name (or MMSI if unknown), and average speed over 5 and 20 minutes.
- Long press: detailed panel with:
- MMSI and Name
- Navigation status: at anchor, restricted maneuverability, fishing, …
- Position: latitude & longitude
- SOG: instant speed over ground; averages over 5 and 20 minutes
- COG: course over ground; HDG: heading
- RNG/BRG: range and bearing
- CPA/TCPA
- Crossing: ahead of/behind the target (very useful underway)
- Position age
- Static info if available: callsign, type, length, beam, destination
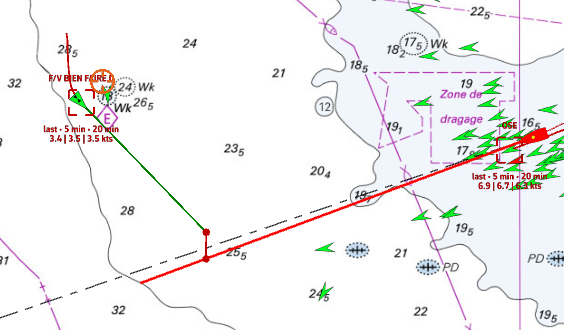
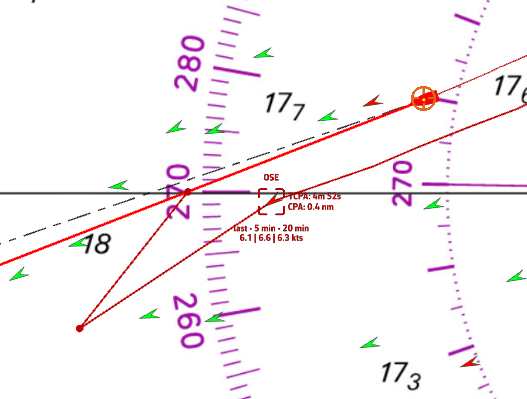
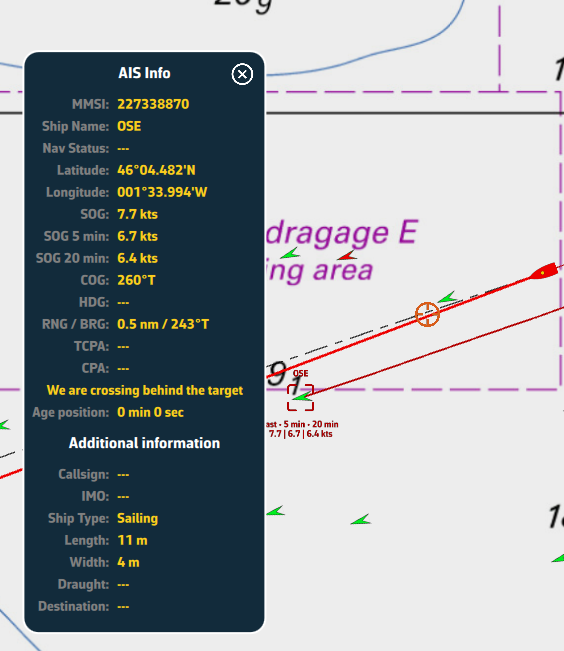
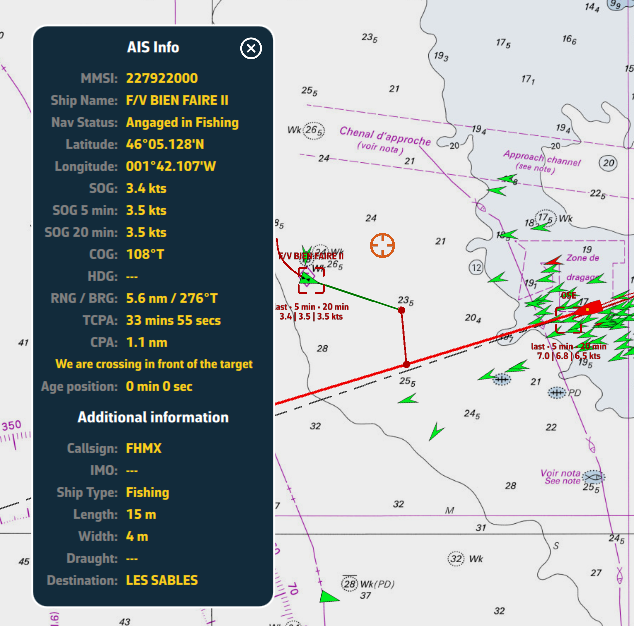
AIS target list
Open the left panel by tapping the chevron handle (›) on the left edge of the screen, then choose the AIS tab (second row of tabs) to display the target list. At the top of the list, the Targets / Fleet selector switches between all targets and comparing a fleet of boats you choose with your own.
For each AIS vessel, the following information is available:
- MMSI and vessel name
- Instant speed
- Speed over ground (5 min)
- Speed over ground (20 min)
- Heading (COG/HDG)
- Range to the vessel
- Bearing
- CPA: Closest Point of Approach
- TCPA: Time to Closest Point of Approach
- At the left of each row, a small color rectangle shows the target state: green if normal, orange when CPA and TCPA fall below twice the alarm thresholds, red if an alarm is active, grey if the CPA cannot be computed. Your own boat uses the app's main colour.
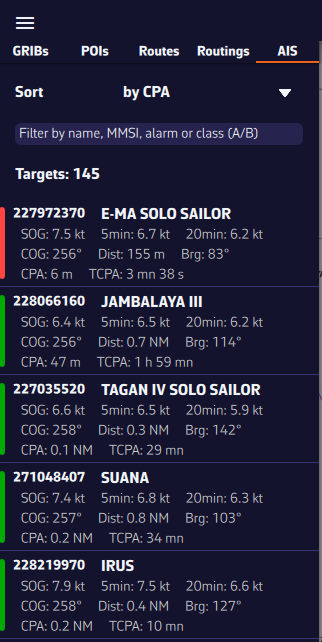
Sort and filter the AIS target list
To quickly find a vessel, you can sort and filter the AIS target list.
- Sort by:
- Risk (default, “by risk ↓”): targets with the smallest CPA and TCPA first
- MMSI
- Name
- CPA and TCPA
- Range
- Instant speed
- 5-min speed, 20-min speed (popular in racing to monitor competitors)
- Filter by:
- Name (e.g., type “CHA” to find “Cœur de Chauffe”, “Alyocha”, etc.)
- Class: type A (Class A) or B (Class B)
- Status: type “Alarme” or “Alarm” to show only targets with a collision alarm
- Click/Tap a vessel:
- the map recenters on the vessel and the target is automatically selected.
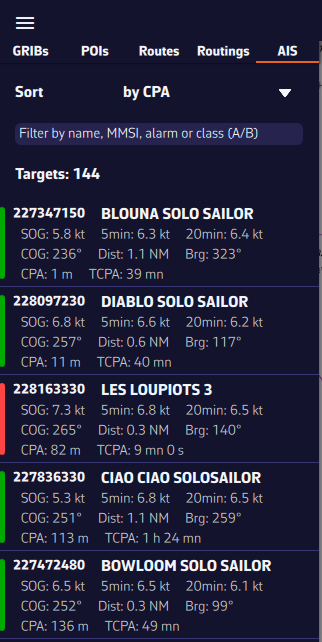
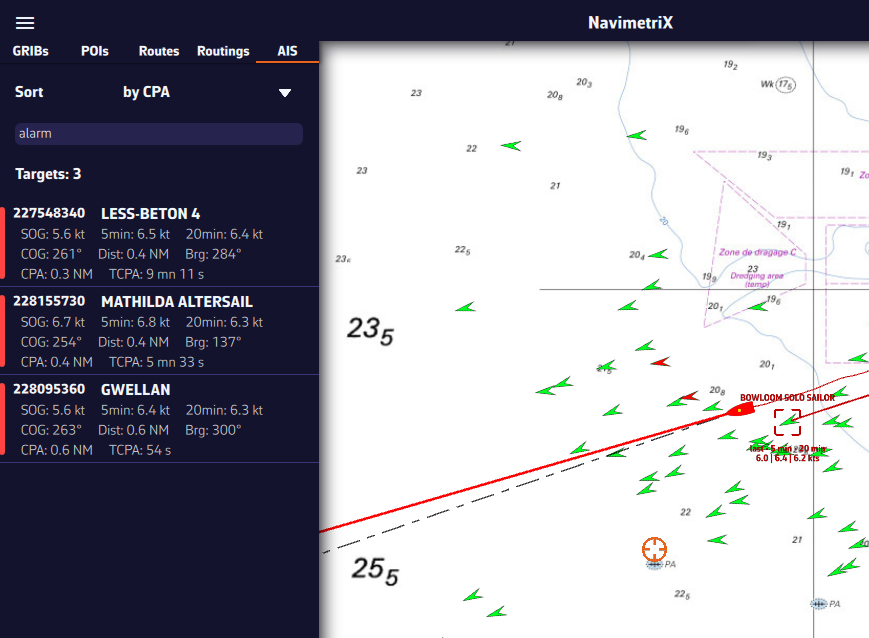
You can display several types of icons on the chart: AIS targets, navigation aids (NavAids), SART (Search And Rescue) distress beacons, AIS targets over the Internet, and “in-situ” weather data stations.
AIS Targets, NavAids, SART
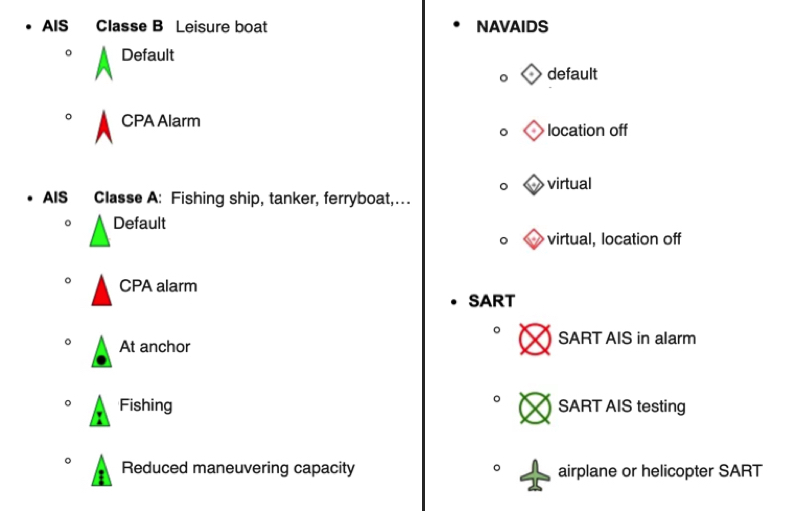
AIS Target over Internet
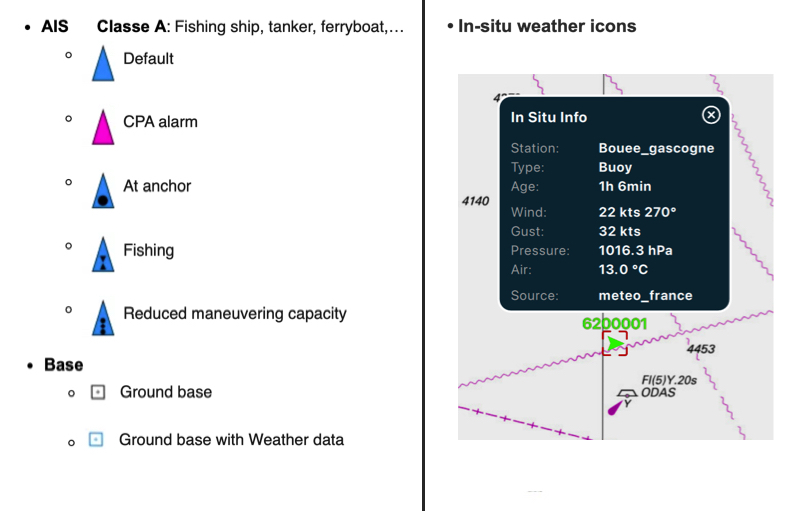
- AIS targets over Internet are blue; those received by your onboard receiver are green.
- A target in alarm (CPA/TCPA) is red, whether it comes from the Internet or from your receiver. In colour-blind mode, it uses an adapted icon.
- A vessel broadcasting weather (AIS message 8) is light blue.
- A base station or an aid to navigation broadcasting weather appears as a cyan square.
Weather station 'in-situ'
To know more, read our FAQ: How to display "in-situ" weather stations
No. The NMEA switch and the NMEA protocol are settings of each device: they are no longer synchronized through the account.
You can therefore turn NMEA off on your smartphone so that it uses its internal GPS, while the tablet or the computer keeps receiving the instruments' feed. The old workarounds (disconnecting the smartphone from the boat's WiFi, closing NavimetriX) are no longer needed.
The setting is in Settings (chevron handle ‹ on the right edge of the screen) > GPS & NMEA, NMEA switch.
One exception: a device set to Follow in the Remote cockpit deliberately turns its own NMEA off, so that the followed boat's data does not mix with a local feed. It gets its setting back when the Remote cockpit is set to Off again. See How does the Remote cockpit work?
Connecting the NMEA multiplexer in Wi-Fi client mode to the Starlink router
Principle
In Wi-Fi "client mode", the multiplexer connects to the Starlink router's Wi-Fi network like any other device. It obtains a local IP address and exposes its NMEA stream over TCP on that network.
NMEA 0183 instruments → NMEA multiplexer (Wi-Fi client mode) → Wi-Fi → Starlink router (192.168.100.1 by default)
- Internet (Starlink WAN)
- Multiplexer → example: 192.168.100.x:10110
- iPad/iPhone with NavimetriX
Step-by-step configuration
1. Switch the multiplexer to Wi-Fi client mode
Depending on the model, via its web interface (often 192.168.1.1 or 192.168.4.1, set to access point mode by default):
- Yacht Devices YDNM-02: menu "Network → Wi-Fi → Station mode"
- Actisense W2K-1: menu "Wireless → Client mode"
- Vesper XB-8000: menu "Network → Join existing network"
Enter the SSID and password of the Starlink network.
2. Find the IP assigned to the multiplexer
Once connected, look up the IP in the Starlink router's admin interface:
- Starlink app → Network → Connected devices
3. Give the multiplexer a fixed IP (recommended)
To prevent the IP from changing at every restart:
- either via the Starlink router: a "static DHCP lease" tied to the multiplexer's MAC address;
- or via the multiplexer itself: assign it a fixed IP within its range.
4. Configure NavimetriX
Open Settings by tapping the chevron handle (‹) on the right edge of the screen, then GPS & NMEA:
- turn the NMEA switch on (Premium subscription);
- NMEA Protocol: TCP;
- Server IP address: the multiplexer's IP (example: 192.168.100.42);
- Server port: the multiplexer's port (example: 10110, the standard NMEA 0183 port; check for your device).
Over TCP, the Scan NMEA devices button only tries the default addresses of common gateways: it will not find a multiplexer that received a different address from the Starlink router, which is why you should note its IP. However, if the multiplexer also transmits over UDP on a common port (10110, for example), the scan finds it without knowing its address.
Precautions
- The Starlink router uses "double NAT". This is no problem for local use: everything stays on the local network.
- "AP isolation" enabled on the Starlink: it must be turned off, as it prevents Wi-Fi devices from seeing each other.
- The multiplexer's IP changes: set a static DHCP lease by MAC address (in the Starlink app).
Checking that it works
Once the TCP connection is up (example: 192.168.100.42:10110), NMEA sentences ($GPGGA, $GPRMC, !AIVDM…) should scroll in the Incoming NMEA sentences console at the bottom of the GPS & NMEA page.
The NMEA stream and the Internet coexist perfectly: they use the same Wi-Fi network, but the traffic stays separate by nature (local on one side, Internet on the other).
Laylines are automatically displayed when you have activated a POI using the Goto function and you need to tack or jibe to reach your target, upwind or downwind.
This requires:
- Navigation mode turned on (switch at the top of the left panel);
- a moving boat (speed over ground above zero) getting closer to the waypoint (positive VMC): when sailing away from the target, the laylines disappear;
- the Laylines box checked in the layers menu (see below).
Definition
The layline is an ideal course on the water for reaching targets: marks or waypoints. It is an imaginary line that varies depending on the wind, current, and the sailboat's ability to sail upwind or downwind, as determined by its speed polar curve. The layline starts from the target, upwind or downwind, to indicate the course to follow and the point at which a boat must tack or jibe in order to reach the target as quickly as possible.
How it works
By convention, the green layline is the starboard tack, and the red layline is the port tack.
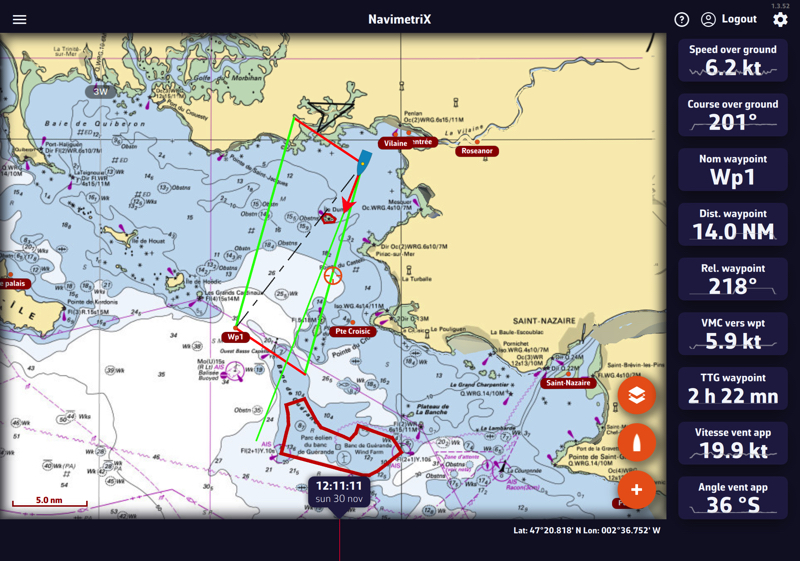
Following this guideline, the distance to be covered by following the best VMG (VMG Max), upwind or downwind, is the same; it is the optimal distance to be covered. If you move outside the laylines, the distance to be covered increases; if you sail within the layline, performance decreases. The angle and heading values vary dynamically with changes in the apparent wind speed and direction.
You can activate the instruments corresponding to the layline data:
- Distance to layline: length of the layline before tacking
- Time to layline: duration of the layline before tacking
Display
Layline display can be enabled/disabled with the Laylines box in the Display section of the layers menu (round orange layers button, bottom right of the chart):
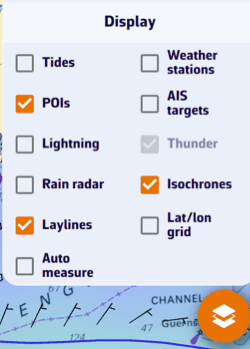
You can send NMEA data to instruments to:
- Control an autopilot by activating navigation to a waypoint (APB, BOD, BWC, RMB, XTE, WPL, RTE sentences).
- Send data from your device's internal sensors (1) to external repeaters (position: RMC, GLL, GGA, VTG; barometer: XDR / MDA).
- Send data to NKE instruments (Multigraphic, Multidisplay and Gyrographic) and to PIXEL displays.
Open Settings by tapping the chevron handle (‹) on the right edge of the screen, select GPS & NMEA, then the NMEA Outputs sub-page at the bottom of the page, below the logs. Under each sentence, a short description says what it carries.
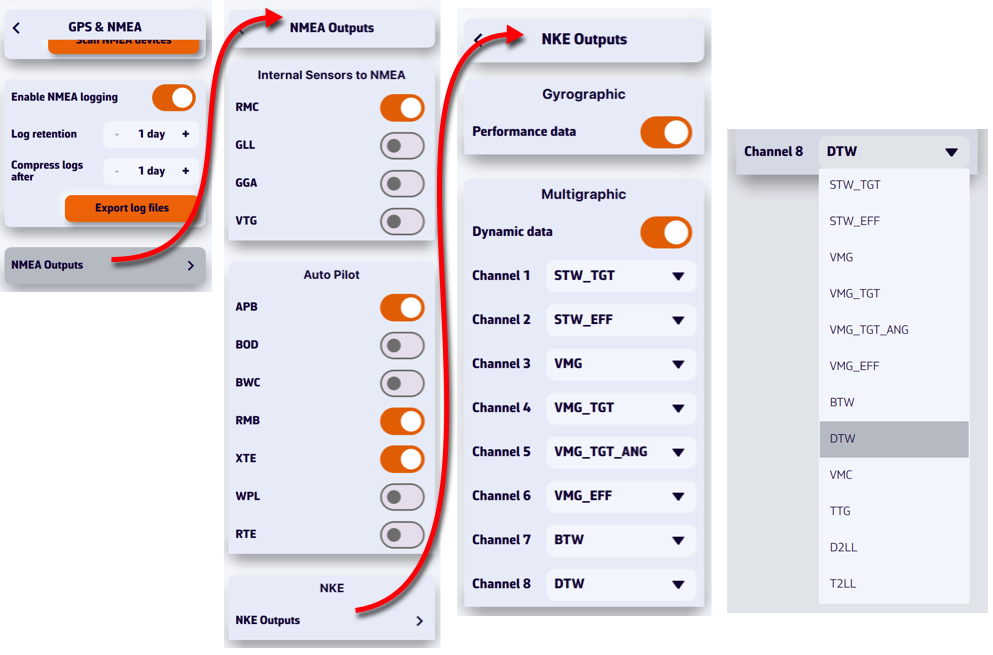
The NMEA switch on the GPS & NMEA page must be on: sentences go out through the configured link. In order to be received by your instruments, they must be transmitted via a bidirectional gateway or multiplexer, usually via Wi-Fi, but also via USB. To be processed, you must first check the sentences accepted by your instruments in their user manual (autopilot, chartplotter, repeater, etc.).
For NKE instruments (NKE Outputs), you can feed each of the 8 dynamic channels by choosing a value in each channel's menu (target speed, VMG, waypoint distance and bearing, distance and time to layline…), and send performance data. Despite the Gyrographic and Multigraphic headings on this page, this data is not reserved for those two displays: the NKE box (Wi-Fi or USB) puts it on the Topline bus, where Multigraphic and Multidisplay displays can read it. The same goes for the distance and bearing to the waypoint (BWC or RMB sentences) and the cross-track error (APB, RMB or XTE).
The NKE box must be initialized once, otherwise nothing reaches the displays:
- Set up the link with Scan NMEA devices, on the GPS & NMEA page.
- Turn on the sentences and channels you want, then start a destination: without a destination, the waypoint data is not sent.
- Check in the Incoming NMEA sentences console that these sentences go out, in orange.
- Press and hold the INIT button of the box for 3 seconds (3 beeps) for a first initialization, or for 6 seconds to add this data without erasing the NMEA channels already created. The box listens for 10 seconds, then gives one beep per channel created.
The channels stay in the box's memory. Repeat the 6-second initialization if you later turn on another sentence or channel. The details, and how to choose the data on the display, are in the guide: Initializing the NKE box.
PIXEL Outputs sends performance, waypoint and current data to a PIXEL display at the IP address you enter.
(1) Depending on the device, mainly smartphones and tablets, the sensors sent may include:
- Built-in GPS.
- Electronic barometer (the XDR / MDA row only appears if the device has one).
Several methods let you measure distances:
Manual measurement
Using the round orange “+” button, you can perform several measurements on the chart. Select Add a new measure, then move the endpoints. The vector displays the distance and true bearing.
On a computer, you can also right-click the chart and choose Add a measure: the measure starts from that point. On a touch screen, place two fingers on the chart and hold them still for a little over half a second: a measure is created between the two fingers.
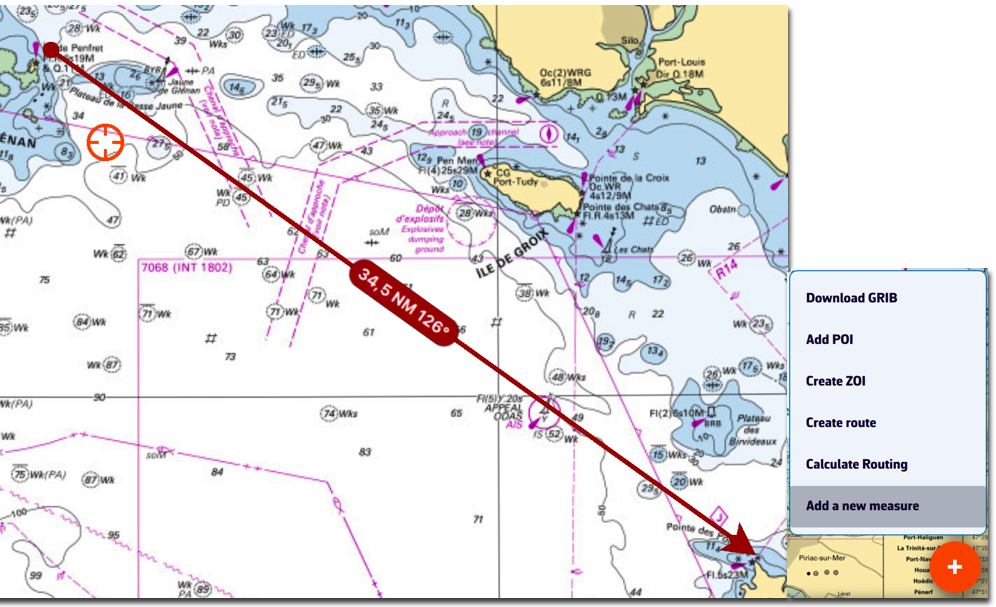
To delete the measure, tap/click the data label in the middle of the arrow. Tapping/clicking an endpoint opens a menu offering Delete measure.
The origin and/or end of the arrow may snap to a POI. The centre label still deletes the measure with a single tap/click.
Automatic measurement
From the layers button, check the Auto measure display option:
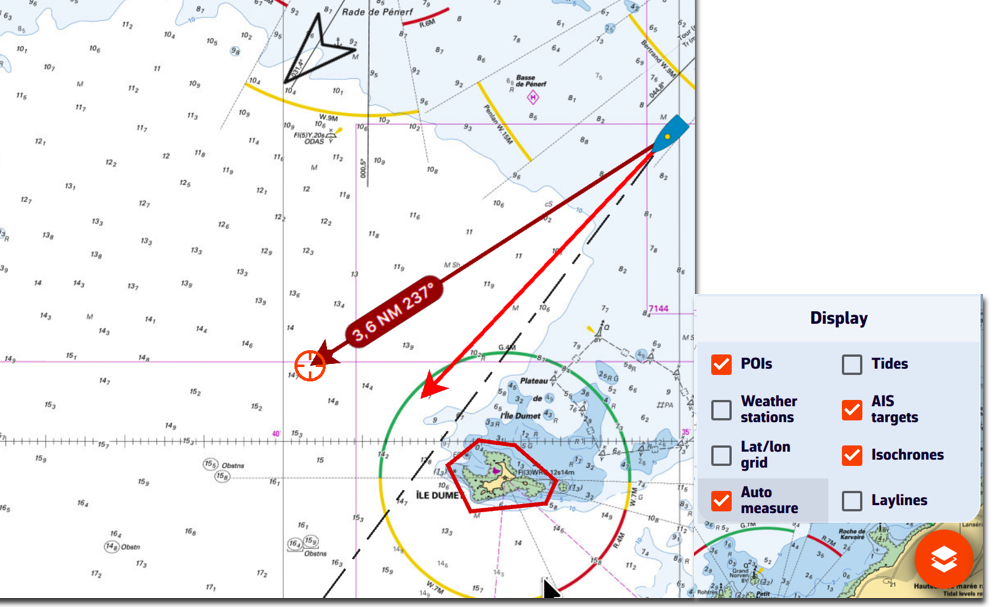
The measurement arrow is automatically displayed from your position toward the target in the centre of the screen. Simply move the chart under the target to the desired location. The distance vector is then displayed for a short time, giving you time to read the distance and true bearing. Each time the chart is moved under the target, the vector is redrawn.
You can disable the distance vector display by unchecking the Auto measure box.
Cursor measure (computer)
On a computer, the Cursor measure box of the same layers menu draws a line from your boat to the mouse pointer, with the distance, bearing and time to go. It does not exist on touch screens, where a finger cannot hover over the chart.
DEMO mode replays a recorded sailing session, with moving AIS targets. It gives you an idea of the app when you are "at home".
NMEA, DEMO mode included, is reserved for the Premium subscription: without it, the NMEA switch opens the Premium window.
Start the demonstration
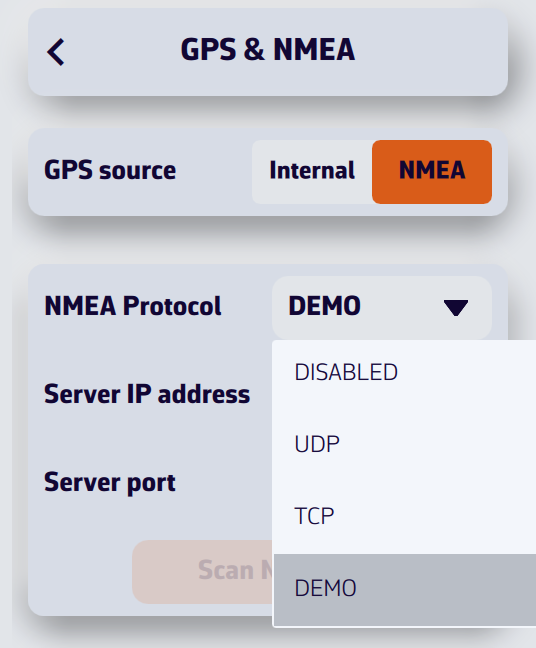
- Open Settings by tapping the chevron handle (‹) on the right edge of the screen, then select GPS & NMEA.
- Turn the NMEA switch on.
- In the NMEA Protocol drop-down menu, select DEMO.
There is no need to change the GPS source: when the demonstration starts, NavimetriX sets it to NMEA itself, turns Navigation mode on, shows the instruments, creates a "Gascogne" POI and opens the AIS tab (the left panel opens on computers and tablets). A "Demo mode" label appears for a few seconds.
You can then see NavimetriX in action while sailing, select AIS targets to display the CPA prediction points, read target information in the AIS tab list, see the navigation data in the instruments, etc.
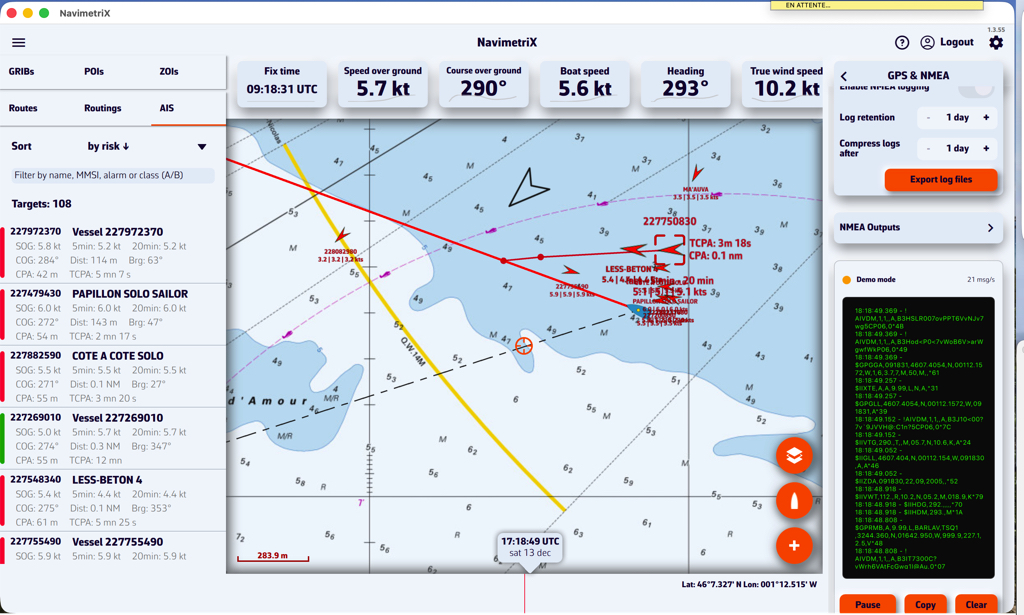
Stop the demonstration
Choose another protocol (UDP, TCP…) or turn the NMEA switch off. NavimetriX then restores the state from before the demonstration: protocol, GPS source, Navigation mode and instrument display, and removes the "Gascogne" POI.
Demonstration data is not recorded in the NMEA logs.
NavimetriX receives data from your instruments, GPS and AIS as NMEA 0183 sentences, over UDP, TCP or a serial port (Settings > GPS & NMEA, NMEA switch on). Incoming sentences scroll in the Incoming NMEA sentences console at the bottom of that page.
Sentences read
| Sentence | Data read |
|---|---|
| Position and GPS | |
| RMC | Position, speed over ground (SOG), course over ground (COG), time and date |
| GGA | Position, time, satellites in use, accuracy (HDOP) |
| GLL | Position |
| VTG | Speed over ground (SOG), course over ground (COG) |
| GNS | Satellites in use, accuracy (HDOP) |
| GSA | Satellites in use, accuracy (HDOP) |
| GSV | Satellites in view |
| Heading and speed through water | |
| HDG | Magnetic heading (true heading derived with the variation) |
| HDM | Magnetic heading |
| HDT | True heading |
| VHW | Speed through water (STW) and heading |
| VBW | Speed through water (STW), only when VHW is not received |
| ROT | Rate of turn |
| Wind | |
| MWV | Apparent wind (reference R) or true wind (reference T): angle and speed |
| VWR | Apparent wind: angle and speed |
| VWT | True wind: angle and speed |
| MWD | True wind: direction and speed |
| Depth, rudder, sensors | |
| DPT | Depth, including the offset set on the echo sounder |
| DBT | Depth below transducer |
| RSA | Rudder angle |
| MTW | Water temperature |
| MDA | Barometric pressure, air and water temperature |
| XDR | Heel, roll, rudder angle, temperatures, barometric pressure, batteries (see Which NMEA0183 XDR sensors can I use?) |
| AIS | |
| VDM | AIS targets received by your receiver or transponder |
Sentences not read
RMB, WPL, APB, XTE, BOD and BWC are not read: distance, bearing, VMC and time to the waypoint are computed by NavimetriX from your route or your "Goto". VLW (log distance), ZDA (time only) and VDO (your own boat's AIS position) are not read either.
When one value arrives in several sentences
NavimetriX watches which sentences actually arrive and, for some values, keeps only one, in this order:
- Heading: HDG, otherwise HDT, otherwise VHW
- Apparent wind: MWV, otherwise VWR
- Received true wind: MWD, otherwise MWV
- Depth: DBT, otherwise DPT
- Speed through water: VHW, otherwise VBW
This choice is made again regularly: if the selected sentence stops arriving, the next one takes over.
By default, true wind is recomputed by NavimetriX from apparent wind, boat speed and heading. In Advanced mode, setting True wind to Instruments shows the true wind sent by your instruments (MWV T, VWT, MWD).
With several links (Advanced mode), the position comes from the link selected in GPS source. For other data, when two links send the same sentence, Instruments wins, then GPS, AIS and the additional links. AIS targets from all links are merged.
What is the XDR sentence?
The XDR (Transducer Measurement) sentence is a generic NMEA0183 sentence used to transmit measurements from various types of sensors (transducers). It allows multiple measurements to be grouped into a single sentence.
What is the general format of the XDR sentence?
$xxXDR,a,x.x,u,n,a,x.x,u,n,...*hhWhere for each transducer group:
- a: Transducer type (one letter)
- x.x: Measured value
- u: Unit of measurement (one letter)
- n: Transducer name (character string)
The checksum (*hh) is mandatory.
Which transducers are supported by NavimetriX?
1. Heel (PTCH)
| Field | Value |
|---|---|
| Type | A (Angular) |
| Unit | D (Degrees) |
| Name | PTCH |
Example:
$IIXDR,A,5.2,D,PTCH*XXNavimetriX reads the angle named PTCH as the boat's heel, the one shown by the Clinometer: this example indicates a heel of 5.2°.
2. Roll
| Field | Value |
|---|---|
| Type | A (Angular) |
| Unit | D (Degrees) |
| Name | ROLL |
Example:
$IIXDR,A,-1.1,D,ROLL*XXThis indicates a roll angle of -1.1°. The Clinometer shows the roll when no PTCH heel is received.
Combined example (roll + heel):
$IIXDR,A,-1.1,D,ROLL,A,5.0,D,PTCH*743. Water temperature
| Field | Value |
|---|---|
| Type | C (Temperature) |
| Unit | C (Celsius), F (Fahrenheit), or K (Kelvin) |
| Name | Must contain water (e.g. WATERTEMP, WaterTemp, water) |
Examples:
$IIXDR,C,18.5,C,WATERTEMP*XX
  $IIXDR,C,65.3,F,WaterTemp*XX
  $IIXDR,C,291.65,K,water*XX
4. Air temperature
| Field | Value |
|---|---|
| Type | C (Temperature) |
| Unit | C (Celsius), F (Fahrenheit), or K (Kelvin) |
| Name | Must contain air (e.g. AIRTEMP, AirTemp, air) |
Examples:
$IIXDR,C,22.0,C,AIRTEMP*XX
  $IIXDR,C,71.6,F,AirTemp*XX
Combined example (water + air):
$IIXDR,C,18.1,C,WATERTEMP,C,22.0,C,AIRTEMP*495. Barometric pressure
| Field | Value |
|---|---|
| Type | P (Pressure) |
| Unit | B (Bars) |
| Name | Free (no name required) |
Note: The value must be expressed in bars (1 bar = 1000 hPa). NavimetriX automatically converts it to hPa. Only an atmospheric value, between 0.8 and 1.1 bar, is used: any other pressure in bars (engine oil, hydraulics) is ignored.
Example:
$IIXDR,P,1.013,B,BARO*XXThis indicates a pressure of 1013 hPa.
6. Rudder angle
| Field | Value |
|---|---|
| Type | A (Angular) |
| Unit | D (Degrees) |
| Name | Must contain RUDDER (e.g. RUDDER, Rudder) |
Example:
$IIXDR,A,-4.5,D,RUDDER*XXThe rudder angle is also read from the RSA sentence.
7. Batteries
| Measurement | Type | Unit |
|---|---|---|
| Voltage | U | V (volts) |
| Current (negative when discharging) | I | A (amperes) |
| State of charge | any except P | P (percent), or a name containing SOC |
Examples:
$IIXDR,U,13.82,V,BAT0*XX
  $IIXDR,I,-5.2,A,BAT0*XX
  $IIXDR,G,85,P,BAT0_SOC*XX
The transducer name identifies the bank: BAT0 and BAT0_SOC are grouped under the same bank (the SOC, VOLT, AMP… suffixes are ignored for grouping). A state of charge sent as a ratio between 0 and 1 (without the P unit) is converted to a percentage. Banks are shown in the Energy (battery) instrument.
How do I combine multiple measurements in a single sentence?
Transducer groups can be chained in the same XDR sentence (up to 10 transducers per sentence):
$IIXDR,A,-2.5,D,ROLL,A,3.1,D,PTCH,C,18.5,C,WATERTEMP,C,21.0,C,AIRTEMP,P,1.015,B,BARO*XXIs the transducer name case-sensitive?
No. Transducer name recognition is not case-sensitive for temperatures, rudder angle and batteries:
WATERTEMP,WaterTemp,watertemp→ all recognizedAIRTEMP,AirTemp,airtemp→ all recognizedRUDDER,Rudder,rudder→ all recognized
Exception: for roll and heel, the names must be exactly ROLL and PTCH. Pressure requires no name at all.
Which talker prefix should I use?
NavimetriX accepts all standard talker prefixes (II, GP, HC, etc.). The examples above use $II (Integrated Instrumentation), but $GP, $HC, or others are equally valid.
Summary of accepted formats
| Measurement | Type | Unit | Transducer name |
|---|---|---|---|
| Heel | A | D | PTCH |
| Roll | A | D | ROLL |
| Water temperature | C | C, F, or K | contains water |
| Air temperature | C | C, F, or K | contains air |
| Barometric pressure | P | B (0.8 to 1.1) | free |
| Rudder angle | A | D | contains RUDDER |
| Battery voltage | U | V | bank name |
| Battery current | I | A | bank name |
| State of charge | not P | P | bank name (or contains SOC) |
You can display a corridor on the screen showing the maximum cross-track error that should not be exceeded.
Open Settings by tapping the chevron handle (‹) on the right edge of the screen, then select Alarms. In the Cross-Track Error section, set XTE to the maximum desired distance on either side of the activated route to a waypoint (0 to 2000 m, 500 m by default).
The corridor appears as soon as Navigation mode is on with a Goto in progress, from a harbour view. It is delimited by red (port) and green (starboard) dotted lines and its width follows the XTE value, whether the alarm is on or not. Turn on the Active switch to be alerted if you leave it:
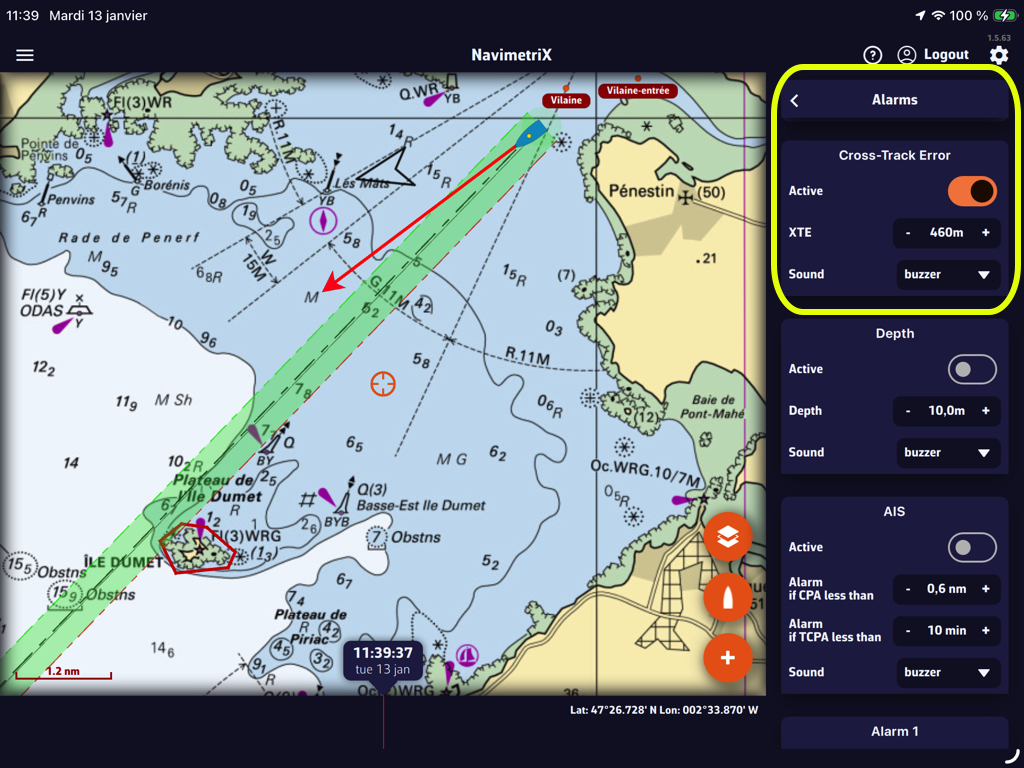
In that example, the value “460m” creates a corridor of 920 meters, or about half a nautical mile. You can select the audible alarm that suits you from the “Sound” drop-down menu.
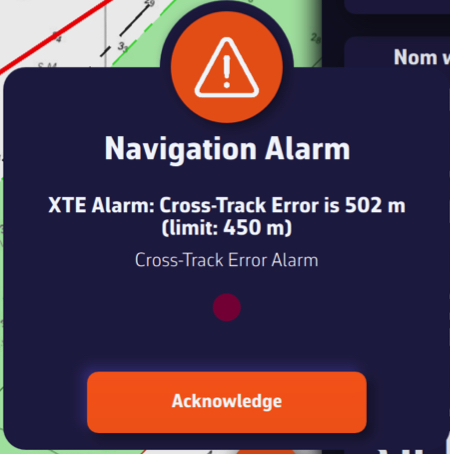
Leaving the corridor triggers an audible and visual alarm that you can silence by tapping/clicking the Acknowledge button.
If you do not see NMEA sentences scrolling in the Incoming NMEA sentences console (at the very bottom of Settings > GPS & NMEA, NMEA switch on), this may be related to the limitations of the WiFi module integrated in the box, which is now end of life. This module is no longer fully compatible with certain devices, in particular the most recent mobile devices.
Check the box software version
Before performing any other action, it is essential to verify that your NKE WiFi box is running the latest internal software version. The currently available version is version 2.5. A box running an older version may experience WiFi connection issues.
You can check the version of your box directly on your MultiGraphic or Multi Display, or using the TopLink software. The software update must be performed using the TopLink software.
Download and install the TopLink software
Checking and updating the software of the NKE WiFi box is done using the TopLink software. This software runs only on Windows PCs. To download it, go to the NKE website, click on the hamburger menu at the top right, then access the Technical access section. From there, open the TopLink software page, download the program, and install it on your computer.
Update the NKE WiFi box
Once TopLink is installed and launched, connect to your NKE WiFi box and perform the update to version 2.5.
Case of recent Apple devices
On some Apple devices (iPhone or iPad) running iOS versions higher than iOS 17 (versions released from 2024 onwards), a WiFi security mechanism added by Apple prevents connection to the NKE WiFi box, even when the box is up to date.
In this case, the WiFi must be forced into open mode, without a password.
To do this, press and hold the Init button on the NKE WiFi box for exactly 8 seconds. It is important to respect this duration precisely; you will hear 8 beeps. This action forces the box WiFi into open mode (no password), allowing affected Apple devices to connect.
Finally, restart the box.
Once connected to the box WiFi, access to the NKE WiFi box should be restored and you should see the NMEA sentences in the Incoming NMEA sentences console. The Scan NMEA devices button tries, among others, UDP port 50000 of the NKE WiFi box.
AIS targets over Internet come from the global AISHub network, to which NavimetriX is affiliated.
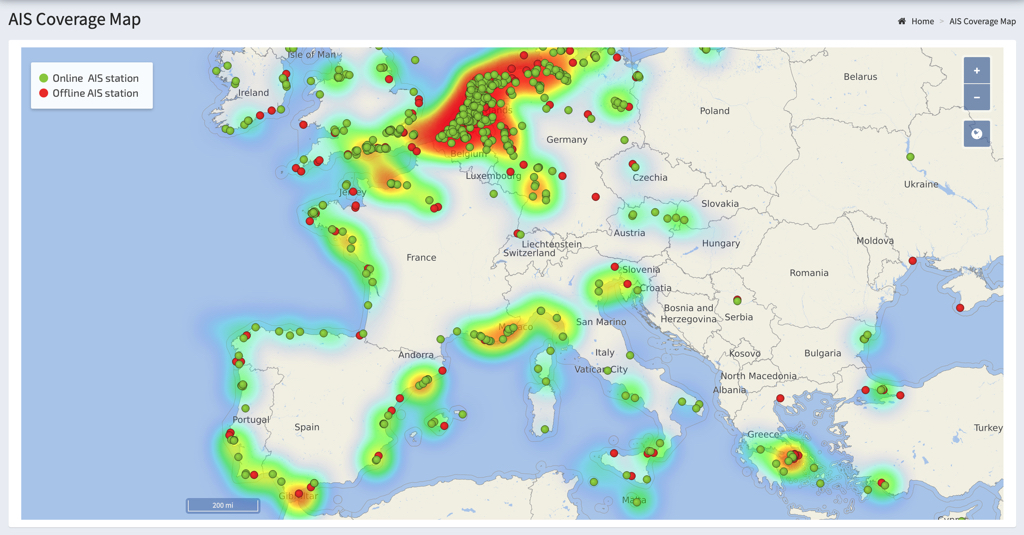
The use and handling of AIS targets over Internet is exactly the same as for AIS targets received on board using an AIS receiver that transmits NMEA data to the application. For more details, see:
How to display AIS targets? in this FAQ.
AIS over Internet is a Premium subscription feature and requires an Internet connection.
Open Settings by tapping the chevron handle (‹) on the right edge of the screen:
- Select the AIS option
- Enable AIS over Internet (on by default)
Internet targets are shown even outside Navigation mode. In navigation, they are requested around your boat; otherwise, around the centre of the screen.
The same page offers two sharing switches, on by default (Premium, and only when Internet is available):
- Share AIS data: forwards the targets received by your onboard AIS receiver to the AISHub network.
- Share weather data: sends the weather measured on board (wind, pressure, temperature) over the Internet as an AIS message, when true wind is available.
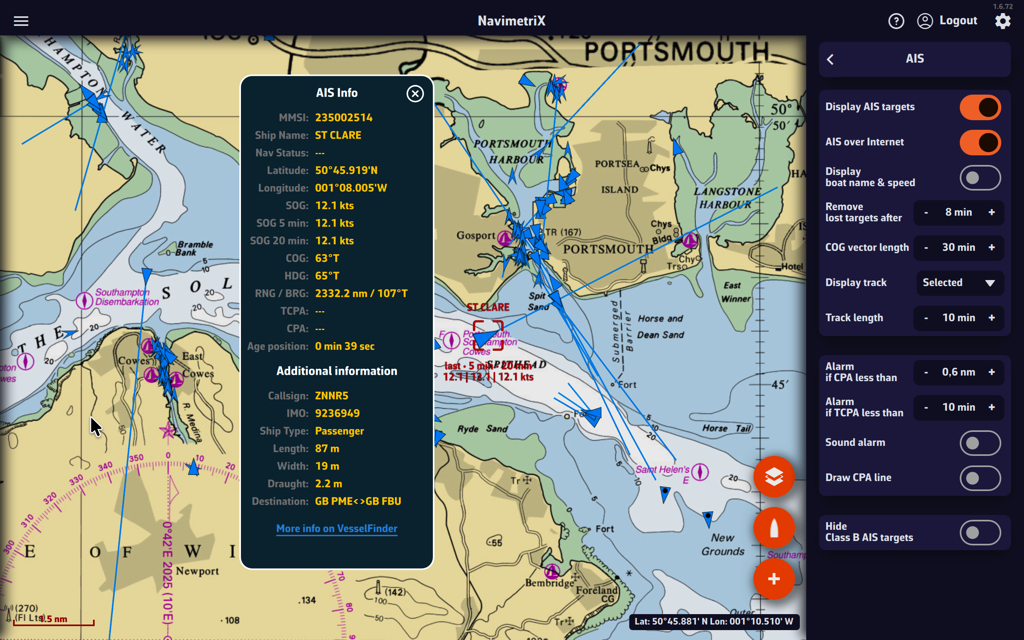
Cautions:
AIS targets over Internet should be considered for informational purposes only. Time delays due to Internet transfer speeds make them unsuitable for navigational safety, whereas reception on board by a dedicated receiver is at VHF frequency in real time.
They are therefore represented by blue icons to differentiate them from green AIS targets icons received directly.
For more details, see: What do the icons displayed on the chart mean in this FAQ?
The Navigation switch at the top of the left panel turns Navigation mode on and off. The goal is to keep mobile devices from draining their batteries when the navigation functions are not in use, such as when running routing simulations, analyzing weather data, etc.
Navigation mode is reserved for the Premium subscription.
Navigation Mode
Open the left panel by tapping the chevron handle (›) on the left edge of the screen: the Navigation switch is at the very top. When you turn it on, a window sums up what changes (high-precision GPS, track recording, active alarms, higher battery use) and offers to show the instruments and turn NMEA on.
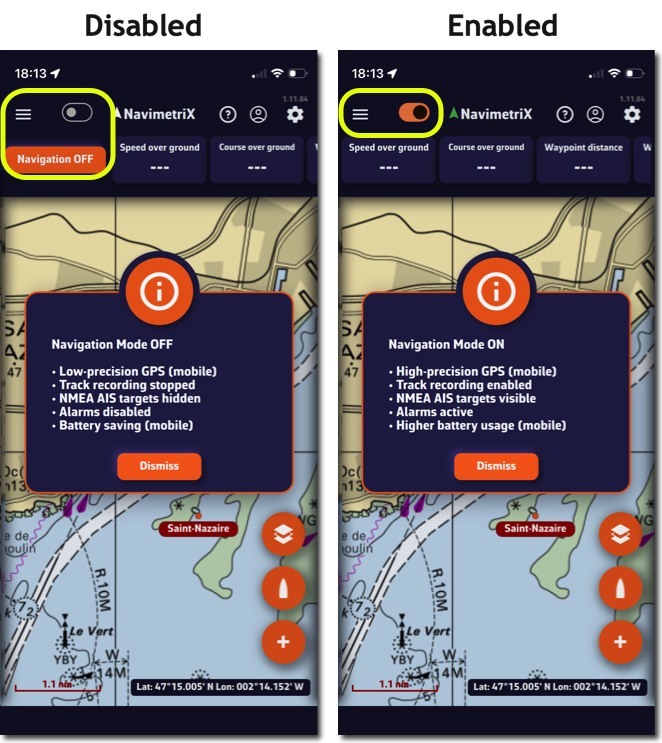
When Navigation mode is turned off, the GPS updates the position only every 30 seconds instead of every second. In Navigation mode, the Energy saving option (Settings > General) spaces updates to every 2 seconds.
Of course, don't forget to turn Navigation mode back on as soon as you set off.
GPS Accuracy Indicator
In Navigation mode, an arrow icon to the right of the Navigation label shows the GPS accuracy on every platform: green when the accuracy is 15 m or better, then increasingly orange and red up to 50 m, red with no position. In colour-blind mode, green is replaced by blue.
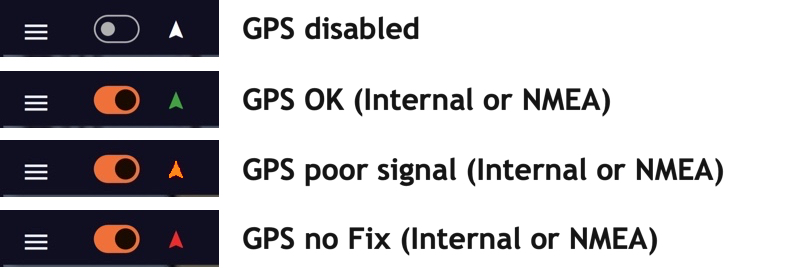
NMEA Data Loss Alarm
In Settings > Alarms, the NMEA data loss section warns you when NMEA data stops: Active switch, Timeout (10 to 300 s, 30 s by default) and Sound, a drop-down menu to choose the appropriate sound alarm.
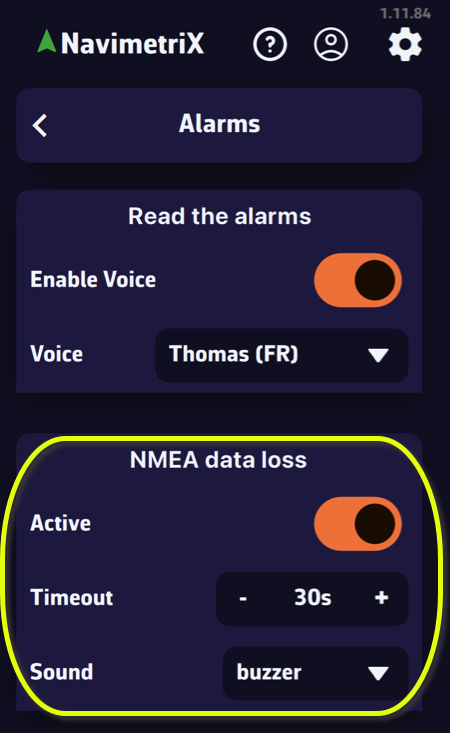
As seen in the Cap Martinique 2026 race, race instructions typically include details on Traffic Separation Schemes (TSS) that are prohibited along the course. Failure to comply with these zones results in severe penalties, as competitors’ track data serves as irrefutable proof.
It is therefore essential to plot the exact coordinates provided in these race instructions on the electronic charts, and not those entered by hand as one might do in Navimetrix. The app offers a feature to import ZOIs in text format for all TSS specified in the race instructions.
1. Copy the TSS coordinates from the Race Instructions
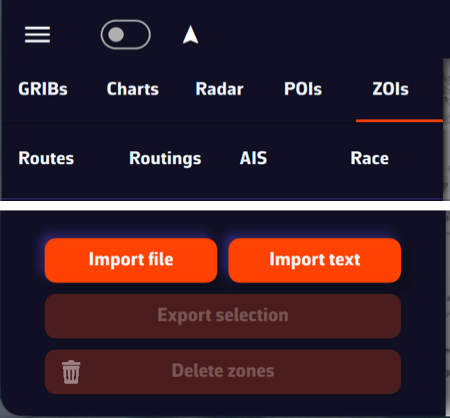
- Select the section of the race instructions containing the TSS description
- Select the text and copy it
- Open the left panel by tapping the chevron handle (›) on the left edge of the screen
- Select the ZOIs tab
- Tap or click the Text button in the action bar at the bottom of the tab (next to Import, Export and Delete)
2. Import text
- Paste the copied content into the “Import from Text” window that opens
- If necessary, format the text (there may be unnecessary blank lines)
- You can optionally shorten the name of each TSS in this window so that it appears more compact in the NavimetriX ZOIs window.
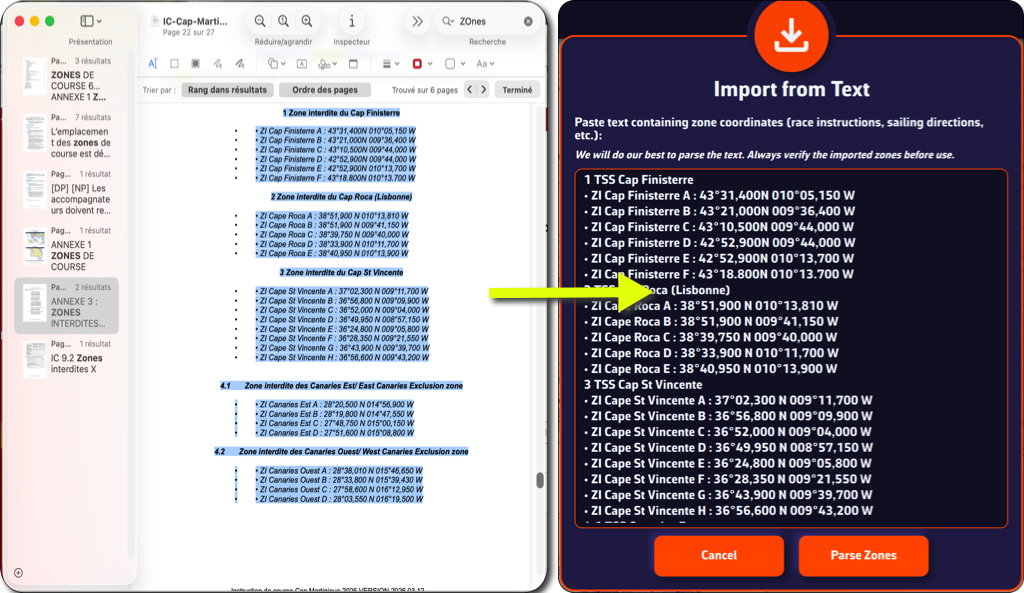
- Tap or click the Parse Zones button to check
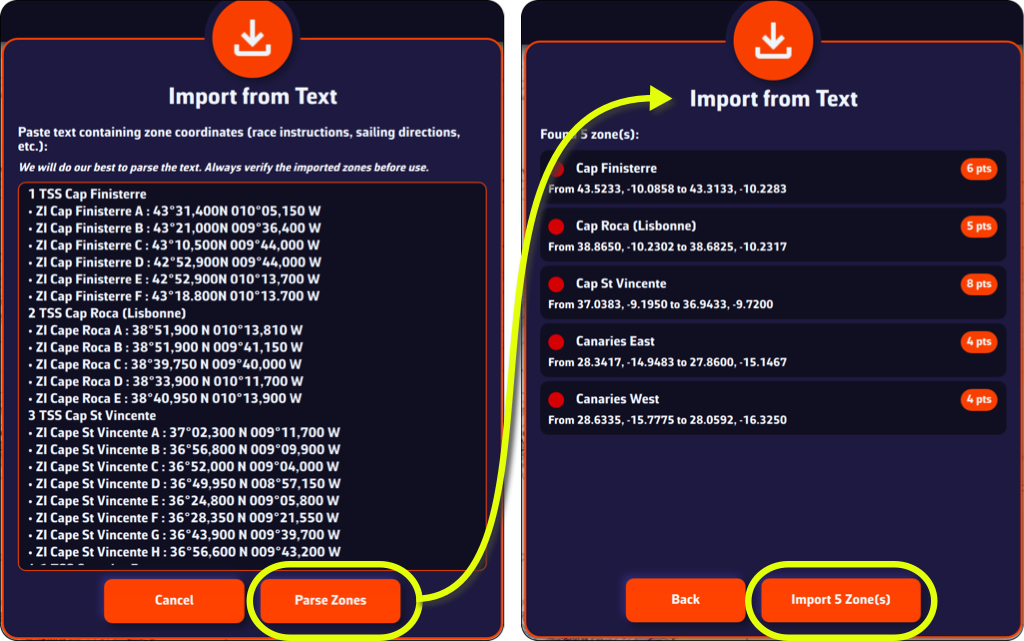
- Tap/click the Import x Zone(s) button
You can now view the TSS in the ZOI list and on your chart.
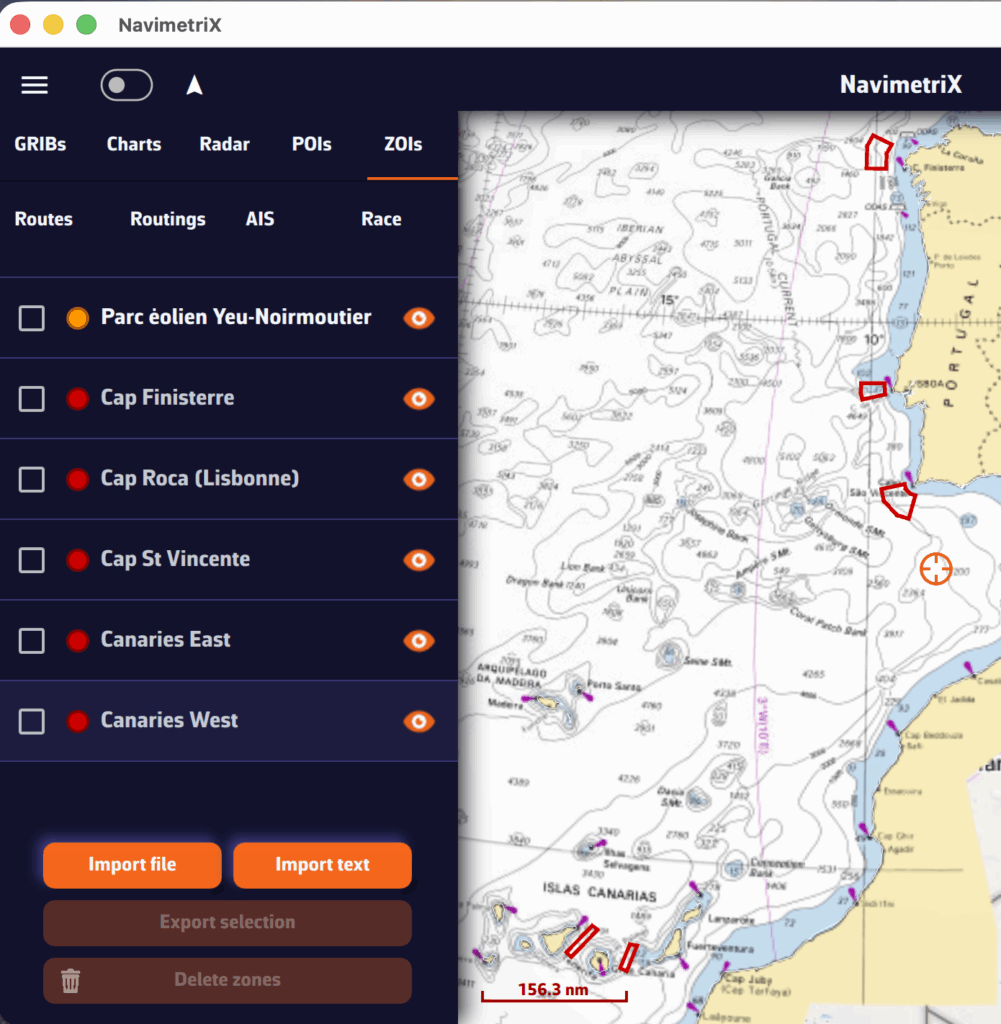

A tip: if you previously created a TSS zone at the same location as the race instructions, disable its display or delete it to prevent its coordinates from interfering with those of the race instructions, which are the only official source.
NavimetriX race tracking shows the whole Route du Rhum - Destination Guadeloupe 2026 fleet on the chart (117 boats, all classes), with each boat's track since the start in Saint-Malo. The positions come from the organizer's reports, published every hour.
1. Download the race file
Make sure you use this file. It holds the list of boats and the address of the position server, ready to use. NavimetriX does not read the password stored in the RDR26.dcc file made for Adrena.
On iPhone and iPad, tap the link then “Download”: the file goes to the Files app, Downloads folder. On Android, Mac and PC, it goes to the Downloads folder.
2. Import it in NavimetriX
- Open the Settings (“‹” handle on the right edge of the screen), then Race tracking.
- In Race file, tap Import and choose
RDR26_NavimetriX.dcc. - In Position reports, tap Download. The server address, username and password are already filled in: leave them as they are.
- Turn on Auto download and set Download every to 60 min: the organizer publishes one report per hour, and new positions arrive on their own.
Then open the Race tab of the left panel (“›” handle on the left edge): the fleet appears on the chart. To see a single class, type its name in the filter field: ULTIM, IMOCA, OCEAN50, CLASS40, VINTAGE MONO or VINTAGE MULTI.
Only one race is loaded at a time: the Route du Rhum replaces the race already loaded, if there is one.
Already imported the RDR26.dcc made for Adrena?
The simplest is to import RDR26_NavimetriX.dcc, which replaces the race. You can also fix the fields by hand, in Position reports:
- FTP or HTTP URL:
ftp://178.170.113.156/Archives_posreports
Without/Archives_posreports, only the last position of each boat arrives. - Username:
rdr26_skippers - Password:
3-5Jzt6:el56
A second server publishes the same reports, with the same credentials:ftp://213.246.39.169/Archives_posreports
These credentials are taken from the Sailing Instructions of the Route du Rhum - Destination Guadeloupe 2026 (§ 5.5.1), freely available on the race website: Espace skippers, “Drive skipper” section.
3. The ranking (optional)
To rank the boats by remaining distance to the finish, create a route in the Routes tab that follows the course to Pointe-à-Pitre. In Settings > Race tracking > Rankings, choose this route in Route:, then enter the start: 1 November 2026 at 12:00 UTC.
More details: How to track your competitors during a race? and the Race tracking guide.
NavimetriX includes a comprehensive MOB (Man Overboard) function, with drift tracking, search pattern and AIS integration. Here's how to use it.
1. Enable the MOB button
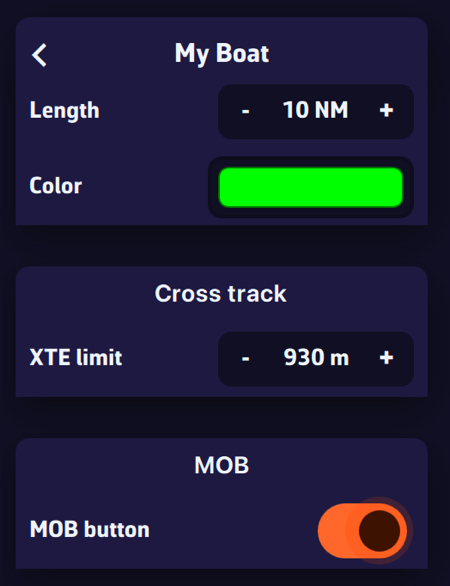
The MOB button is not displayed by default. To enable it:
- Open Settings (chevron handle ‹ on the right edge of the screen), then General, MOB section
- Turn on MOB button

The orange MOB button then appears at the bottom left of the chart, in Navigation mode only and with a GPS position (an approximate Internet-based position is not enough). It turns red once MOB is triggered.
2. Trigger MOB
To trigger MOB, press and hold the MOB button for 1.5 seconds. A progress ring fills around the button to indicate progress. This long-press action is intentional to prevent accidental activation.
A short tap simply displays a tooltip reminding you to hold the button.
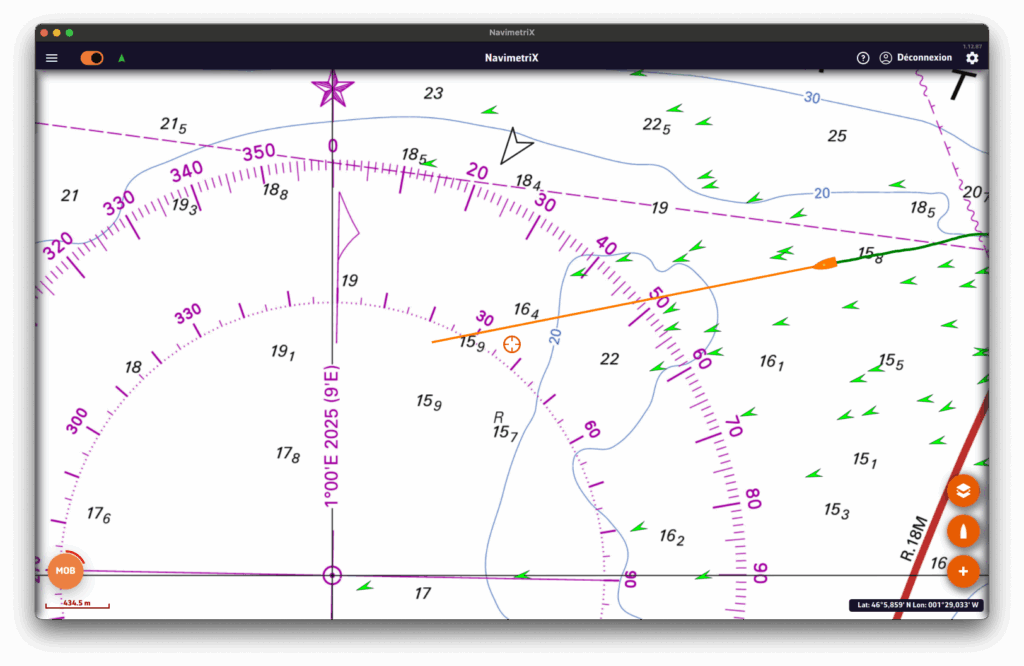
3. What happens when MOB is triggered
As soon as MOB is activated, several actions are performed automatically:
- MOB marker: a point of interest is created at the boat's current GPS position (e.g. "MOB 14:32:58")
- Active waypoint: the MOB position is set as the Goto waypoint, with a route line to the MOB
- Auto zoom: the chart centres and zooms to the MOB position
- Timer: an elapsed time counter starts immediately (displayed in red)
- Drift tracking: drift calculation begins (see next section)
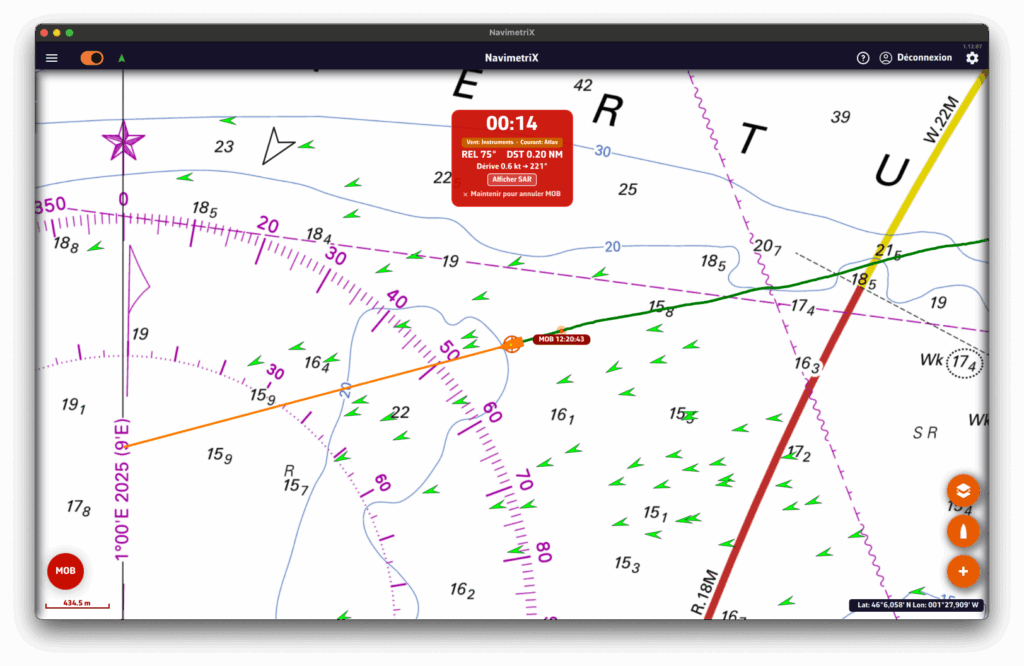
4. The MOB dashboard (HUD)
An information banner appears at the top of the chart with essential data:
- Elapsed time: displayed in large red format (MM:SS)
- Bearing (BRG): heading to steer towards the MOB position
- Distance: distance to the MOB (in nautical miles, or metres when < 0.1 NM)
- Drift data: estimated drift speed and direction
- Mode badge: indicates the data source (GRIB wind, current, AIS...)
- Search button: to show or hide the search pattern
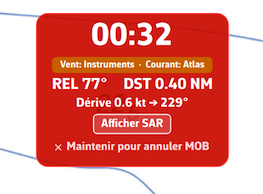
5. Drift tracking
NavimetriX estimates the probable position of the person in the water taking into account:
- Wind: using GRIB data or onboard instruments. Leeway is calculated at 3% of the true wind speed with a 10° divergence, in accordance with international search and rescue standards.
- Current: using GRIB data, tidal atlas or onboard instruments.
On the chart, you will see:
- An orange drift line connecting the initial MOB position to the estimated position
- An orange circle around the estimated position, whose radius increases over time (growing uncertainty)
The estimated position is updated every 30 seconds and the Goto waypoint is automatically adjusted.
6. Search pattern
NavimetriX can display an expanding square search pattern, compliant with international search and rescue procedures (IAMSAR).
To display it, tap the "Search" button in the MOB banner. The pattern is centred on the estimated drift position (or on the initial MOB position if no drift data is available).
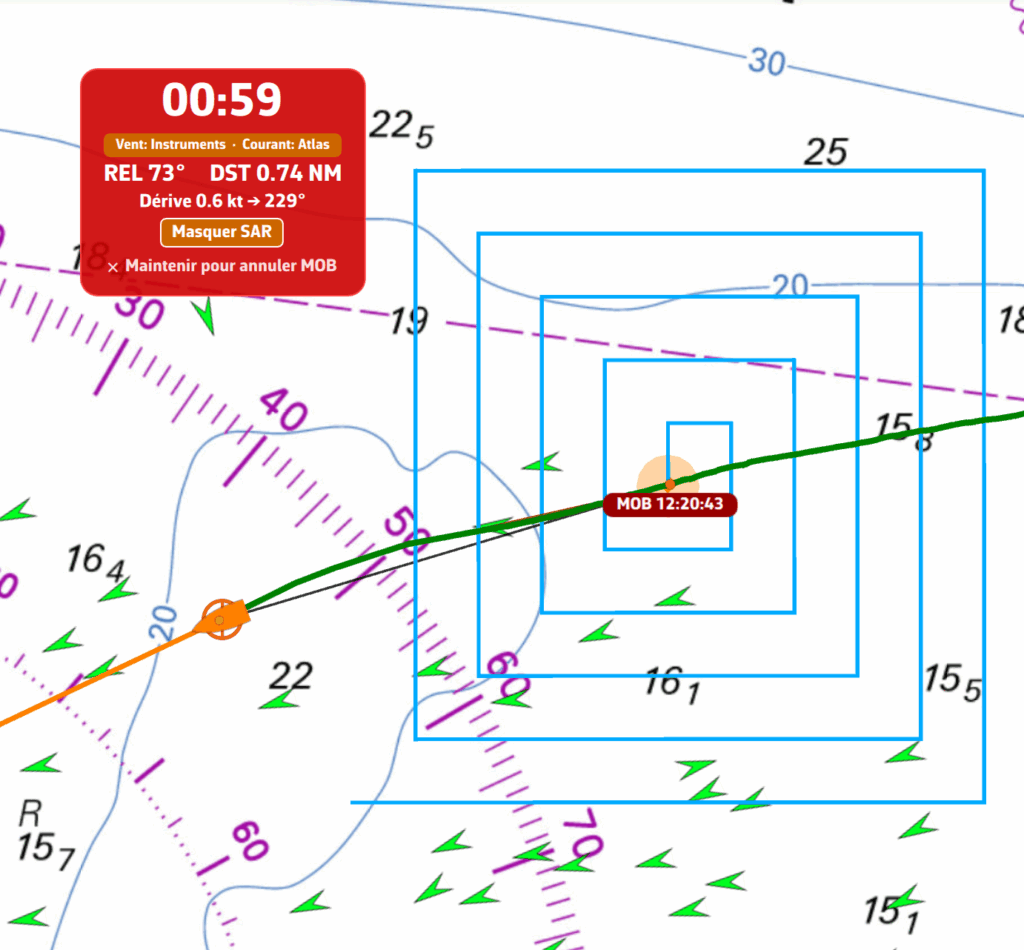
7. MAYDAY reminder
60 seconds after MOB activation, if the situation is not resolved, a yellow banner appears as a reminder to consider a MAYDAY call on VHF channel 16 (RYA recommendation).
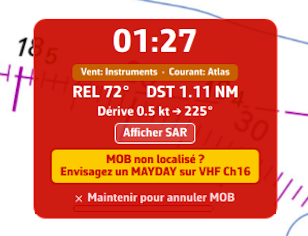
8. AIS MOB integration
If an AIS MOB beacon (personal or SART type) is detected nearby, NavimetriX reacts automatically:
- An audible alarm sounds
- An alert dialogue displays the beacon's position
- MOB mode activates automatically if not already active
- The AIS position is tracked in real time (updated every 5 seconds)
If the AIS signal is lost, NavimetriX automatically switches to drift estimation mode after 60 seconds.
The mode badge in the MOB banner changes colour depending on the situation:
- Green: AIS MOB beacon detected and tracked
- Red: AIS MOB signal lost
- Orange: drift data available (wind/current)
- Grey: no drift data available
9. Cancel MOB
To cancel MOB mode, press and hold the "Hold to cancel MOB" text in the MOB banner for 1.5 seconds. A progress bar confirms the cancellation.
Cancelling deactivates tracking, removes the Goto waypoint and hides the MOB banner.
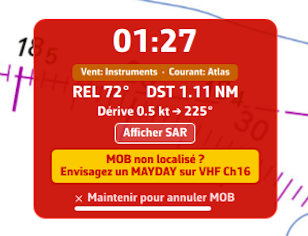
10. Practical tips
- Enable the MOB button before heading out to sea in the settings, so it is immediately accessible in an emergency
- Load a GRIB file for your sailing area: GRIB wind and current data significantly improve drift calculation accuracy
- Equip yourself with an AIS MOB beacon: it provides real-time tracking of the person in the water, far more accurate than drift estimation
- The MOB button only appears in Navigation mode with an active GPS position (not an Internet-based position)
What is Race tracking?
Race tracking allows you to follow offshore sailing races in real-time directly on the NavimetriX chart. You can import race definitions, download position reports automatically or manually, and view rankings based on distance to finish.
What file formats are supported?
Race tracking supports the Adrena format, which is the standard used by most offshore race organizers:
- .dcc files - Race definition with competitor list, classes, IRC ratings, and download configuration
- POSADRENA files - Position reports with boat coordinates and timestamps
What is a .dcc file?
A .dcc file (Adrena competitor description) contains all the race information:
- Race name and date
- List of competitors with their boat name, class, skipper, and IRC rating (TCC)
- Display colors for each boat
- FTP or HTTP server configuration for automatic position downloads
Example entry for KORNOG2, a Pogo 12.50 racing in IRC Two class:
KORNOG2;IRC Two;1;3;1;;;8;;1.170;O;Gilles Colubi & Yvan Osselin;;;Race organizers typically provide .dcc files on their website or via email before the race start.
What is the POSADRENA position format?
POSADRENA is the standard format for position reports. Each file contains the latest positions for all competitors:
POSADRENA
  1;8;25.1873N;19.0716W;01/13/26 14:00:01
The fields are: race ID; boat ID; latitude; longitude; timestamp.
Important: Coordinates use the Adrena format (degrees.minutes), not decimal degrees. For example, 25.1873N means 25° 18.73' N (not 25.1873°).
How do I import a race?
To import a race:
- Open Settings (chevron handle ‹ on the right edge of the screen), then Race tracking
- In the Race file section, tap Import: the "Import DCC file" window opens
- Select the .dcc file from your device
- The race and all competitors will be imported
How do I download position reports?
There are three ways to get position updates:
1. Automatic download (FTP/HTTP)
If the .dcc file contains server configuration, enable Auto download and set the interval (Download every … min). NavimetriX will automatically fetch new positions.
If the connection details are not in the .dcc, you can enter them manually in the FTP or HTTP URL, Username and Password fields of the Position reports section.
FTP setup example: URL ftp://ftp.organizer.example/reports/last/, with the username and password provided by the organizer. Some organizers also offer an HTTPS URL that contains a key: in that case, leave the username and password empty.
The trailing / at the end of an FTP URL is optional. Do not add a *.txt pattern: NavimetriX lists the directory and filters position files automatically.
2. Direct URL download
Some tracking systems (like YB Tracking) provide a direct URL that always contains the latest positions. Enter this URL in the FTP or HTTP URL field and tap Download. NavimetriX will fetch the file and filter out positions already in the database.
Example URL format: https://yb.tl/racename-adrena.txt
3. Manual import
In the Position reports section, tap Import ("Import position file" window) and select a POSADRENA file from your device. The import takes one file at a time: for a full position history, import the files one after another, their positions add up.
How do I view competitors on the chart?
Once positions are imported:
- Open the left panel (chevron handle › on the left edge of the screen) and choose the Race tab
- The eye at the top of the list shows or hides the whole race; one eye per competitor shows or hides each boat. Tapping a competitor selects it and centres the chart on it
- Competitors appear on the chart with their track history
- Tap a boat icon to see details (position, speed, course)
How are rankings calculated?
Rankings are based on Distance To Finish (DTF):
- Select a route that represents the race course
- DTF is calculated as the distance from each boat's current position to the finish, following the remaining waypoints
- Boats are ranked by ascending DTF (lowest distance = leading)
To enable rankings:
- Create a route matching the race course (or import the official route)
- In Settings > Race tracking, Rankings section, select the route in Route:
- Choose the Method: VMC (recommended) or Average speed
- Enter the race start date and time (UTC)
- Rankings become available in the Race tab
How does IRC corrected time work?
IRC (International Rating Certificate) uses a Time Correction Coefficient (TCC) to handicap boats of different performance levels. This allows boats of different sizes and types to compete fairly.
The formula is: Corrected Time = Elapsed Time × TCC
For example, KORNOG2 has a TCC of 1.170. If the boat finishes in 10 days (240 hours):
- Elapsed time: 240 hours
- Corrected time: 240 × 1.170 = 280.8 hours
A TCC greater than 1 means the boat is "fast" and gets penalized. A TCC less than 1 means the boat is "slow" and gets a time bonus.
For boats still racing, NavimetriX estimates the corrected time based on current VMC (Velocity Made good on Course) to project the finish time.
Why don't I see any boats on the chart?
Check the following:
- Make sure you have imported position reports (not just the .dcc file)
- Check that boat visibility is enabled in the Race tab (global eye and each boat's eye)
- Zoom and pan the chart to the race area (boats may be far from your current view)
- Verify the positions were imported successfully (check the number of position files at the top of the Race tab)
Why are speeds showing as unrealistic values?
Speed is calculated from position history. Unrealistic values usually indicate:
- Wrong start date/time: Check that the race start datetime in settings matches the actual race start (UTC timezone)
- Insufficient positions: At least 2 positions are needed to calculate speed
- Position errors: Occasionally, tracking systems report erroneous positions
Can I edit competitor information?
Yes: in Settings > Race tracking, tap a competitor in the Competitors list. The Edit competitor sheet lets you change:
- Boat name, class, and skipper
- IRC rating (TCC) and penalty (in minutes)
- Display color
- Arrival status and time
- Retirement status
Changes are saved to the database.
NMEA data streamed by an NMEA gateway, a multiplexer, or any other instrument broadcasting on a serial port via a USB connection is supported on computers (macOS, Windows, Linux).
Phones and tablets have no serial port: the SERIAL choice is greyed out there. NMEA is a Premium subscription feature.
Prerequisites
Gateways that present themselves as a standard serial port usually need no driver. Otherwise, install the manufacturer's driver (often FTDI or Prolific).
Setup
Open Settings by tapping the chevron handle (‹) on the right edge of the screen, then select GPS & NMEA.
Once the gateway is connected and transmitting, the simplest way is to press Scan NMEA devices, then Start Scan. On a computer, the scan also tries each serial port at 9600, 4800, 38400 and 115200 baud. Then press Apply settings: NavimetriX sets the protocol, port and baud rate, turns the NMEA switch on and, if the stream carries a position, sets GPS source to NMEA.
You can also set everything by hand:
- GPS source = NMEA
- NMEA switch = on
- NMEA Protocol = SERIAL
- Serial port = the gateway's port.
- Baud rate = the gateway's rate (4800, 9600, 38400 or 115200; 9600 by default).
The data stream should scroll in the Incoming NMEA sentences console at the very bottom of the page.
The anchor drag alarm monitors your boat's position at anchor and alerts you if it drags.
NavimetriX draws a swing zone around the anchor, triggers a siren if the boat leaves the zone, can send an SMS alert, and lets you track the boat remotely from another device.
The anchor drag alarm is reserved for the Premium subscription.
Dropping the anchor
You need a GPS fix (an approximate Internet-based position is not enough) and an almost stationary boat (speed below 2 knots). If Navigation mode is off, Drop anchor turns it on itself and says so with the message "Navigation Mode enabled for the anchor watch".

- Once the boat is anchored, tap the + button (bottom right of the chart) then Drop anchor.
- The anchor is placed ahead of the bow (on the heading axis) and a "Anchor DD/MM hh:mm" POI is created.
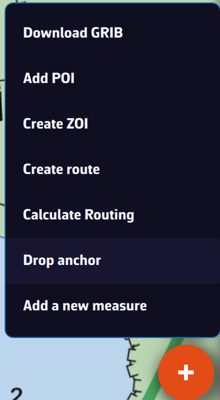
The swing zone
Once the anchor is dropped, a banner appears at the top of the screen and a swing zone is drawn around the anchor. You can choose the shape of the zone:
- Circle: a single radius around the anchor (default radius: 40 m).
- Hexagon: for a custom-shaped zone.
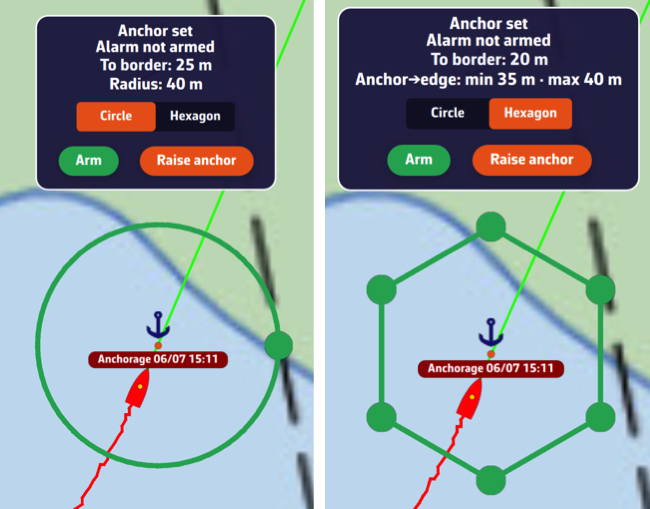
The banner constantly displays the zone's radius and the distance to the edge. Adjust the radius to the length of chain paid out, taking into account the high tide height in tidal areas, plus a safety margin. As a reminder:
- at least 3 x the water depth for all-chain rodes
- at least 5 x the water depth for mixed rope + chain rodes
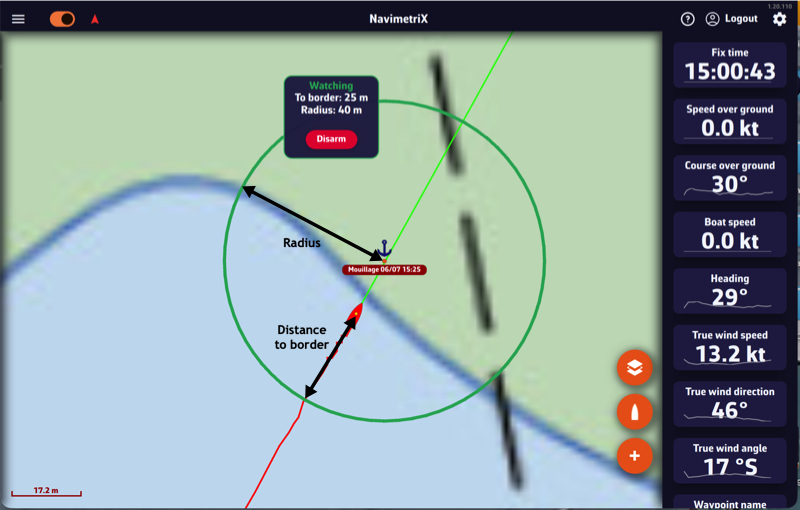
Changing the radius: as long as the alarm is not armed, a green handle sits on the circle. Drag it to grow or shrink the zone; the radius updates live in the banner. The radius accepts 5 to 500 m. In Hexagon shape, the six vertices are dragged one by one, which lets you hug an anchorage that is obstructed on one side.
Once the alarm is armed the zone is frozen and the handles disappear, so that a stray gesture cannot widen the very zone you are watching. To adjust it without disarming, see below.
What the banner shows
Below the alarm status, the banner constantly gives:
- the distance to the edge of the zone ("To border: 12 m"), or how far outside it you are;
- the radius of the circle ("Radius: 40 m"), or the minimum and maximum anchor → edge distances in hexagon mode;
- the distance and true bearing of the anchor ("Anchor: 28 m at 145°");
- the relative bearing from the bow, colour-coded the maritime way: "30° to port" in red, "30° to starboard" in green, or "0° ahead". This line only appears when a heading is available (compass, otherwise course over ground).
The banner can be moved: drag it anywhere on the chart and its position is remembered on that device. Handy on a phone, where it used to sit on top of the swing zone.
Arming and monitoring
As long as the alarm is not armed, the banner shows "Anchor dropped · Alarm not armed". To activate it, press and hold the Arm button on the banner. The status changes to "Monitoring".
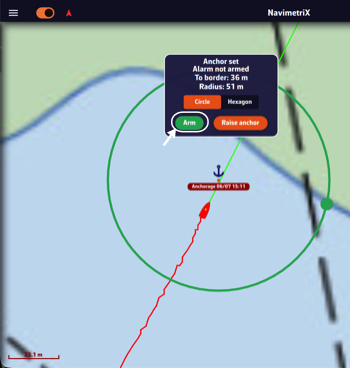
With the alarm armed, turning Navigation mode off disarms it: NavimetriX warns you and asks you to choose between Turn off and Keep watching.
Important: the armed/disarmed state is local to the device. Arming the alarm on your phone does not arm it on the other devices on your account: each device decides on its own whether it monitors and sounds the alarm.
Dragging
If the boat starts dragging, as soon as it leaves the zone the alarm triggers after an adjustable confirmation delay: audible siren, SMS sent (if configured), the banner switches to "DRAGGING" and NavimetriX shows the distance from the anchor relative to the limit.
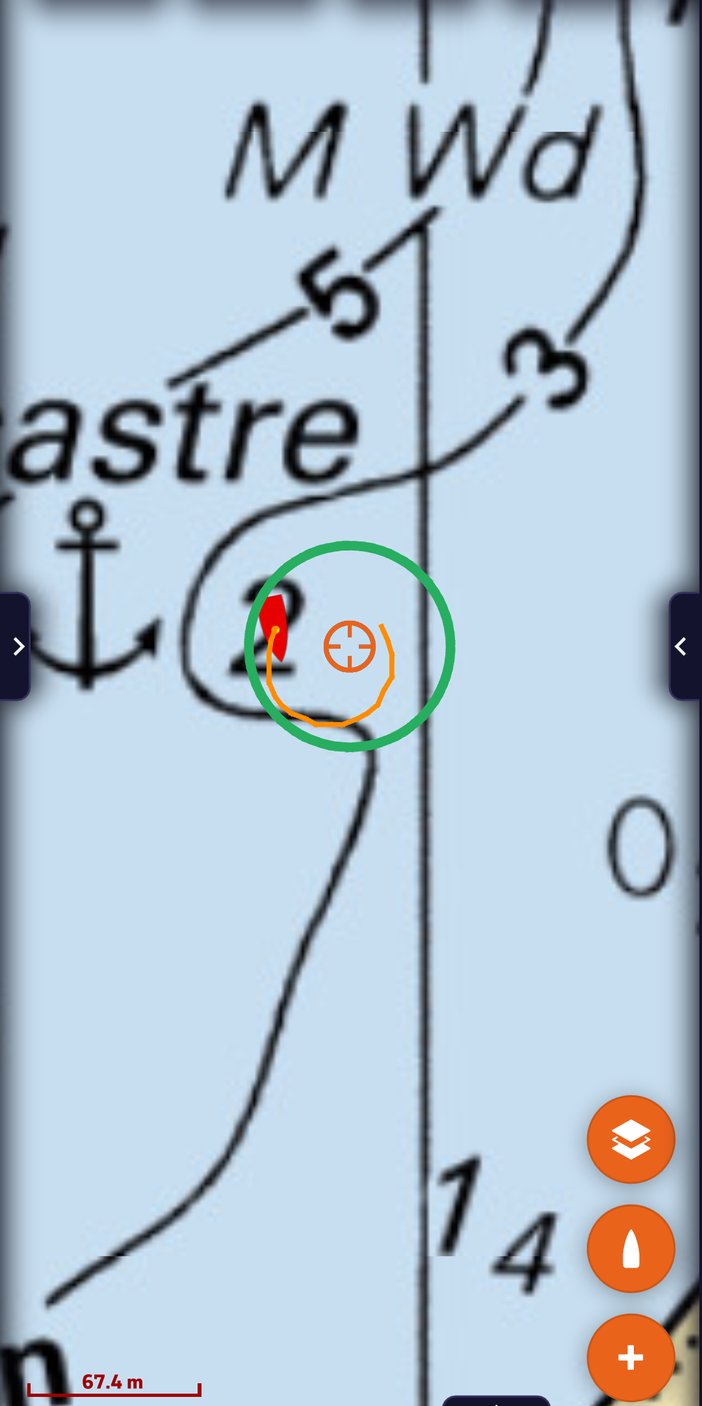
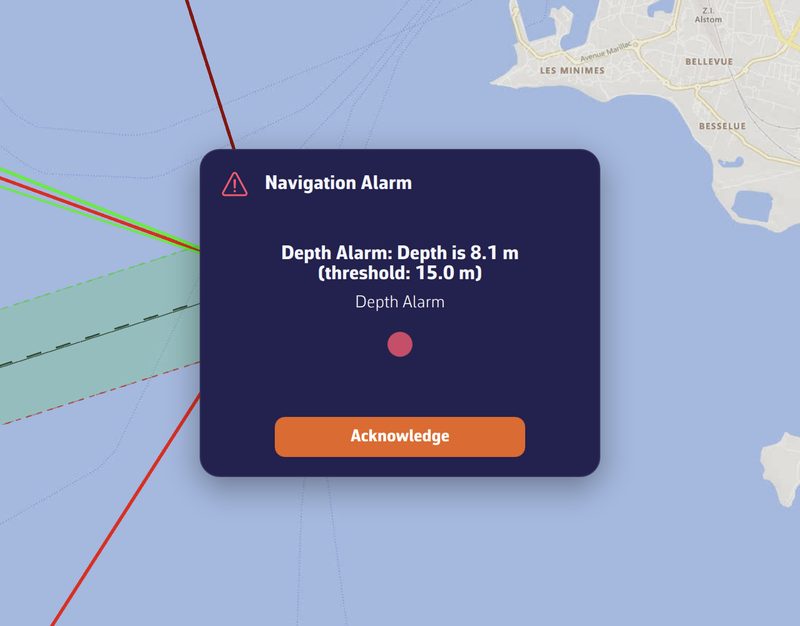
Anchor settings
The settings are found under Settings ▸ Alarms (chevron handle ‹ on the right edge of the screen), Anchor section:
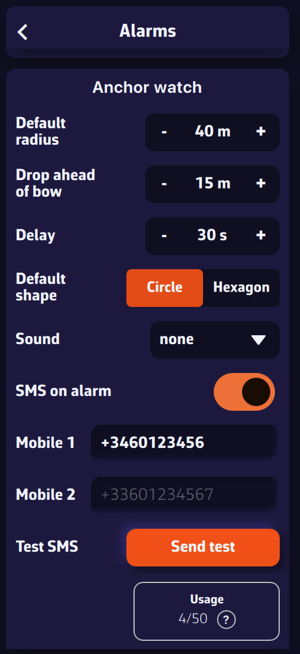
- Default radius: the radius of the swing circle when the anchor is dropped (default 40 m).
- Ahead of the bow: the distance at which the anchor is placed ahead of the boat, on the heading axis (default 15 m).
- Delay: how long the boat must remain outside the zone before the alarm sounds (default 30 s), to avoid false alerts.
- Default shape: Circle or Hexagon.
- Sound: the alarm ringtone to select.
SMS alert
In addition to the local siren, NavimetriX can send an alert SMS to relatives or to another phone on board. Under Settings ▸ Alarms, Anchor section:
- Enable SMS on alarm.
- Enter one or two numbers in Mobile 1 and Mobile 2, in international format (e.g.
+33612345678). +1 numbers (North America) are not served: the warning "SMS not delivered to +1 numbers" then appears under the fields. - Check with Test SMS ▸ Test: a test message is sent immediately.
If the boat drags, the SMS contains the boat's position, bearing and distance from the anchor, plus a Google Maps link to the boat. Up to 3 SMS are sent per incident: immediately, then at +30 min and +60 min as long as the alarm remains active.
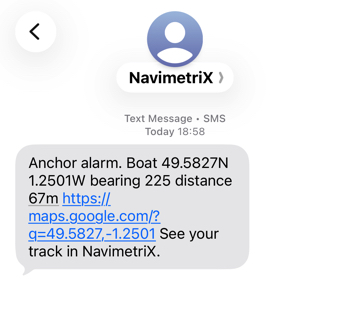
A quota of 50 SMS per rolling 12 months is included. The Usage X/50 counter shows your consumption; once the quota is reached, the app displays "Annual SMS limit reached" (the local siren keeps working regardless).
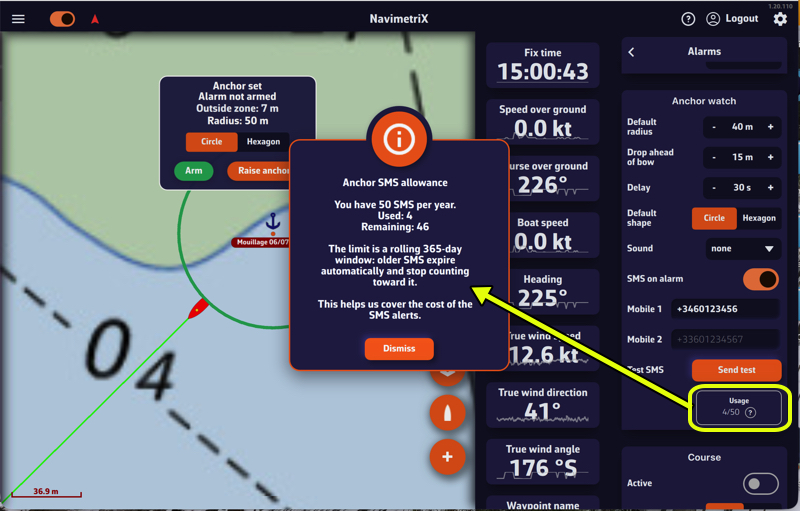
Tracking the boat remotely: "At anchor"
When the boat is at anchor and in Navigation mode, the onboard device shares its position with the other devices connected to the same NavimetriX account. On those devices, an "At anchor" track automatically appears at the top of the Tracks tab.
It shows, read-only:
- the boat's track over the last few hours (swing movements, any dragging);
- the swing zone (circle or hexagon) and the anchor;
- the boat's last known position, oriented to its heading.
Handy for keeping an eye on the boat while relaxing at a restaurant or with friends. A simple tap on the boat icon shows the instantaneous date, speed and heading, tapping the boat button recenters the chart on the anchored boat, and a long press frames the whole swing zone. The "At anchor" track disappears as soon as you raise the anchor or exit Navigation mode on board.
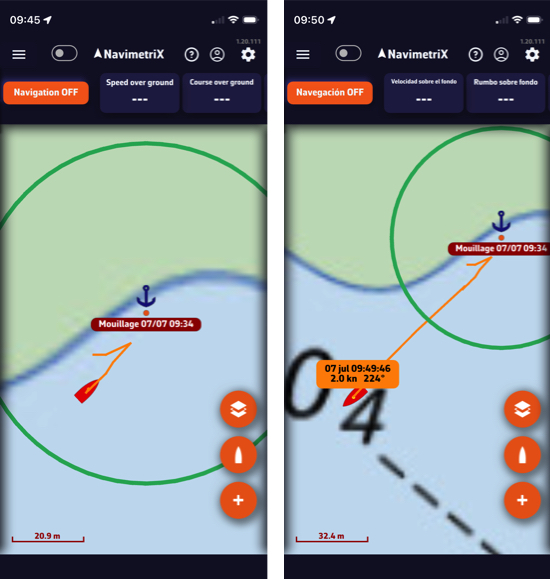
Raising the anchor
When leaving the anchorage, press and hold the Raise anchor button on the banner. The anchoring is closed, the swing zone disappears, and the "At anchor" track is cleared on the other devices.
How to move the anchor?
As long as the alarm is not armed, you can move the anchor using the "Move anchor" menu. The swing zone follows the move, so the anchor always stays at the center of the circle.
- Tap the anchor POI.
- Tap "Move anchor".
- Drag the POI on the screen. Once released, the swing zone repositions around the new anchor position.
The anchor is only draggable after going through that menu: a finger brushing the chart never moves your anchorage. Once the move is done, the anchor locks itself again.
With the alarm armed, the "Move anchor" entry disappears: you have to disarm to reposition it. "Delete POI" is blocked the same way, because deleting the anchor would leave the alarm running on a zone with no centre.
Changing the radius without disarming
The zone is frozen while the alarm is armed, but the rode may need veering in the middle of the night without lifting the watch. Tap the anchor: the menu offers "Edit radius" (or "Edit watch zone" in hexagon mode).
The handle reappears for one adjustment, without disarming the alarm. In circle mode, releasing the handle fixes the new radius and hides it again; in hexagon mode the vertices stay for a few seconds so the whole shape can be reworked. In both cases the window closes by itself after 20 seconds, so a handle is never left sitting on a monitored zone.
The Remote cockpit carries the onboard feed (NMEA and AIS) from one device to another, over the Internet.
The device left ashore then shows exactly what the one on board sees: instruments, AIS targets, position, as if you were standing at the helm.
Broadcasting requires the Premium subscription.
The principle: two devices, one account
Both devices must be signed in to the same NavimetriX account. That account is what links them: there is nothing else to pair, no code to exchange.
The setting is under Settings › GPS & NMEA › Remote cockpit (chevron handle ‹ on the right edge of the screen, then at the very bottom of the GPS & NMEA page), as a three-position selector:
- Off: normal behaviour of the app;
- Broadcast: this device publishes the boat's feed;
- Follow: this device receives the feed from the broadcasting boat.
A device is in one or the other of these states, never both at once.
On board: the device that broadcasts
- It receives the boat's data as usual, with your NMEA source active.
- Set the Remote cockpit to Broadcast.
- It needs Internet access (coastal 4G, Starlink…), as that is how the feed travels.
Only one device broadcasts per account. If another device is already broadcasting, NavimetriX asks for confirmation before moving the broadcast: the other device then stops.
Auto broadcast in navigation: when armed, this switch drives the selector on its own, which is greyed out. The device broadcasts as soon as you turn Navigation mode on and stops when you turn it off; the previous setting is then restored. It is off by default.
Ashore: the device that follows
- Sign in to the same account.
- Set the Remote cockpit to Follow.
- The app switches to Navigation mode on its own and centres the chart on the followed boat as soon as the first position arrives.
One point that often surprises: while following, the local NMEA source of the shore device is deliberately switched off. This is intended: otherwise a local GPS would mix with the followed boat's data and the boat would jump between the two positions. Your original NMEA setting comes back when you set the Remote cockpit to Off.
Also worth knowing
- Broadcasting requires the Premium subscription.
- A device that follows does not broadcast at the same time, and vice versa.
- Both devices need an Internet connection: with no coverage on board, the feed doesn't go out.
Yes. On many boats the nav computer, the GPS and the AIS receiver are three separate boxes, each with its own WiFi or its own port. NavimetriX can now listen to them at the same time, with no multiplexer.
Open Settings (chevron handle ‹ on the right edge of the screen), section GPS & NMEA, and turn on Advanced mode. The page reorganises into six tabs.
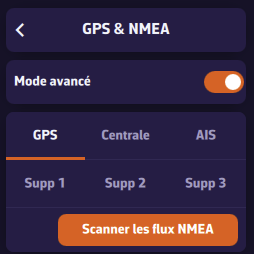
- GPS: a dedicated GPS, when the position does not come from the instruments.
- Instruments: wind, depth, log, heading, and often the position.
- AIS: a separate AIS receiver or transponder.
- Extra 1 to 3: everything else (barometer, MOB receiver, standalone sensor).
Each tab carries its own link, with its protocol, address and port. A link you do not use is declared by setting its NMEA Protocol to None.
The GPS and AIS tabs start with a selector. The GPS link settings only appear when GPS source is set to GPS; the AIS link settings, only when AIS source is set to Dedicated. Otherwise the tab only shows the selector: position or AIS then come through the instruments (or, for the position, from the device GPS).
AIS targets from every link are merged into a single list: whichever link a vessel arrives on, it appears once. Wind, depth and the other measurements are taken wherever they arrive.
If you know neither the addresses nor the ports, the Scan NMEA devices button searches for you and proposes a role for each stream it finds.
Advanced mode also adds a computation section:
- Speed reference: Surface (log speed, the default) or Ground (GPS speed, when the paddlewheel is fouled). It is used to compute true wind, VMG and polar performance.
- True wind: Computed by NavimetriX (the default) from apparent wind, or taken from the Instruments when they send it.
Note: going back to standard mode does not merely hide the other tabs, it shuts those links down. Their settings are kept and come back as soon as advanced mode is switched on again.
Wind or depth can arrive from anywhere without any risk of confusion. The position, though, can only come from one link, otherwise the boat would jump from one point to another. You are the one who designates it.
In Settings (chevron handle ‹ on the right edge of the screen), GPS & NMEA, Advanced mode, tab GPS, the GPS source setting offers four choices. In standard mode it only offers two: Internal and NMEA.
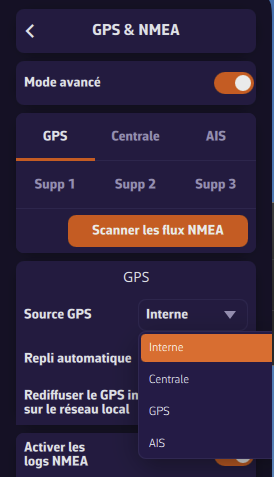
- Internal: the tablet's or phone's own GPS. On a Mac, which has no GPS, the "internal" position is derived from Wi-Fi or the IP address: it is never used for the boat in Navigation mode.
- Instruments: the position arrives mixed in with the instruments, which is the most common case.
- GPS: a dedicated GPS, usually more accurate and better placed.
- AIS: a transponder carrying its own GPS.
Automatic fallback
Automatic fallback is on by default, and best left that way. If the designated source goes quiet for too long (three times its usual rate, at least 10 seconds and at most 2 minutes), NavimetriX looks elsewhere rather than leaving you without a position: it tries, in order, the instruments, AIS, the dedicated GPS, additional links 1 to 3, then the device's own GPS. A banner tells you what it switched to, and another tells you when the original source came back.
Fallback only accepts a link that provides a real position. An AIS receiver with no GPS of its own, sending nothing but targets and a clock, is never chosen: it would freeze the boat instead of moving it.
Turning fallback off is only worth it if you want to see immediately that a GPS has failed, at the cost of losing the position. Under way, keeping it even degraded is nearly always better.
Yes, with nothing else to install. The phone re-broadcasts its position on the boat's WiFi network, and the computer listens to it like any other NMEA link.
On the phone
Settings (chevron handle ‹ on the right edge of the screen), GPS & NMEA: set GPS source to Internal, then turn on Relay device GPS on local network. Note the Relay port (10111 by default). That is all: Advanced mode is not needed (if it is on, these settings are on the GPS tab).
On the computer
If the computer has no other link, stay on the standard page: turn the NMEA switch on, set NMEA Protocol to UDP, Server port to the phone's relay port, and GPS source to NMEA. With a single source there is nothing to arbitrate.
If it already receives the instruments from elsewhere, turn on Advanced mode to say which of the two links provides the position: tab GPS, GPS source on GPS (the link settings then appear), then protocol UDP and that same port.
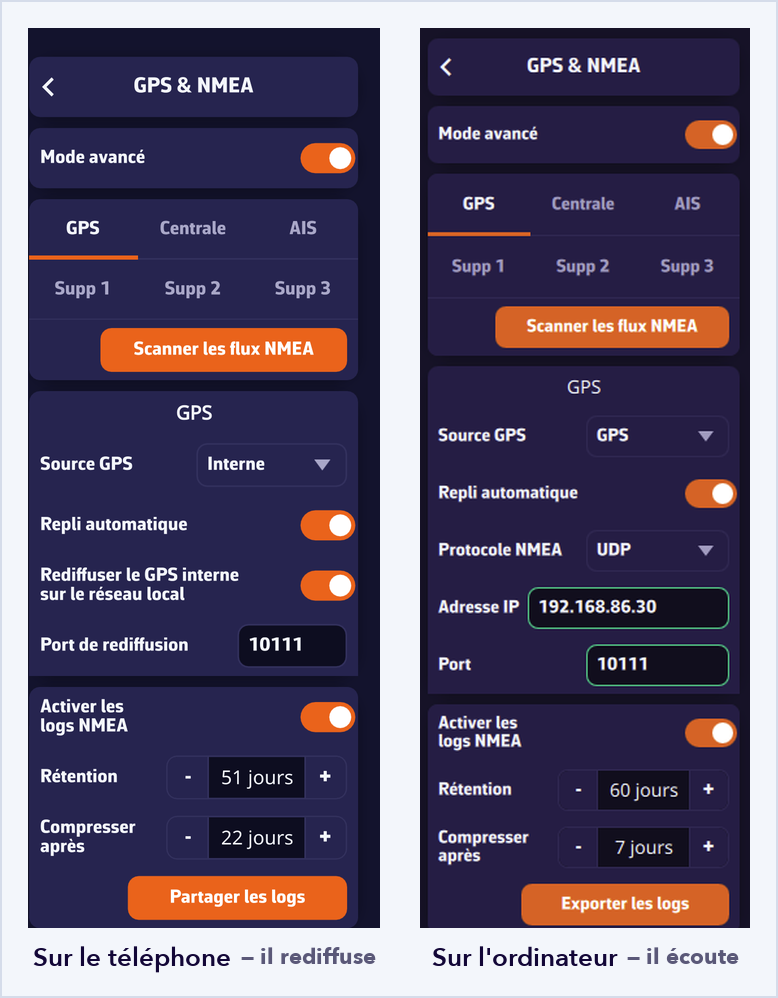
The computer then follows the phone's position while taking its instruments from the nav computer. If the phone shuts down or leaves the network, automatic fallback takes over.
Worth knowing
- Both devices must be on the same WiFi network: broadcast does not cross subnets, and some routers isolate their clients from one another.
- The app must stay open on the phone; screen off is fine.
- The position keeps the rate and the accuracy of a phone GPS, and this use drains the battery.
It works the other way round too: a computer wired to the nav computer can feed the tablets on board, which replaces a multiplexer in some installations.
Two messages can appear under a link's Server port field, and they do not mean the same thing.
"Port already used by another input"
In red. Two NavimetriX links point at the same port, which is not possible: this one is not listening. Give it another port and the warning clears on its own.
The lowest-numbered link keeps the port, so the instrument link wins over an additional one. Also think of the Relay port if you use re-broadcasting on the local network: it must differ from the ports you listen on.
"Port also used by another app"
In the warning colour (yellow in the dark theme, ochre in the light theme, orange in the night theme), and this is not an error. Another program is listening on that port on the same machine. Two cases:
- If your gateway broadcasts its data to the whole network, which is the most common case, both programs receive everything and there is nothing to do.
- If it sends to a single recipient, only one of the two programs will get the data. Close the other application.
This message is often what explains a correctly configured link that receives nothing.
Nothing arrives at all
First check that you are on the right WiFi, the gateway's and not the marina's, then that the NMEA switch is on, then that the port matches your hardware's manual. The Incoming NMEA sentences console at the bottom of the page settles it: if sentences scroll there, the link is fine and the problem lies elsewhere. If it stays empty, run a scan and it will find the address for you.
Once you are following a route, the Course tracking instrument answers the questions a navigator gets asked out loud: how far now? what do we steer? what time do we get there?
Add it like any other instrument: it docks in the instrument bar or floats on the chart.
What it shows
One row per remaining leg, carrying, depending on how wide the tile is:
- the mark ahead, and the one you are leaving;
- the side to leave it, if one was specified;
- the distance;
- the ground course and the surface course — the one to steer, corrected for the current;
- the estimated true and apparent wind angles;
- the sail best suited, if your polar carries a Sailchart;
- the leg's duration and the time at the mark.
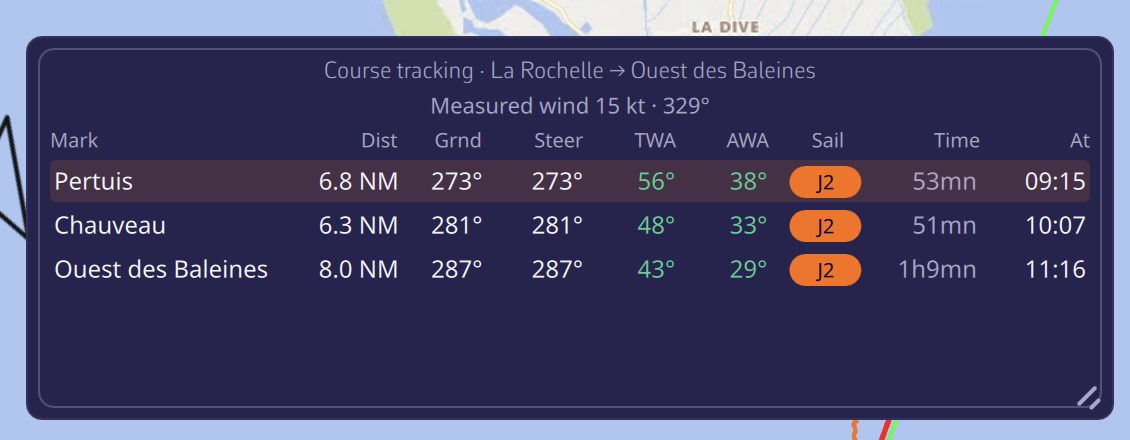
Legs are chained in time: each is computed with the weather it will meet, at the hour the boat will enter it. A long course is therefore not evaluated with today's wind.
Which wind is used?
In the instrument settings (long press or right click), the Wind source selector offers:
- Measured — the wind from your instruments, the default;
- Avg 10 min — the mean of the last ten minutes, steadier for deciding a sail or a heading;
- Forecast — the GRIB, greyed out when no file covers your position;
- Forced — a strength and direction you impose, to see what a shift would do.
The current always comes from the GRIB, since no instrument measures it ahead of the bow.
On a narrow screen each leg becomes a two-line card rather than being truncated. Text size is also set in the instrument settings.
When racing, rounding a mark means knowing which side to leave it. NavimetriX keeps two notions apart that are easily confused.
The type: what the router must honour
- Pass through this point — a hard constraint: the route goes there;
- Leave to port / Leave to starboard — a side constraint: the router must pass on the right side, which may cost nothing at all if it was going that way anyway.
The side: what the racer needs to know
A mark you round is a "pass through this point" with a side attached. To the router it is the same hard constraint; to you it is the information that matters on the approach.
The side is chosen in three places:
- in the waypoint dialog on the chart, the Side selector;
- in Route details, by tapping each row's passing label;
- in the build a route from POIs dialog, on the label at the right of each row.
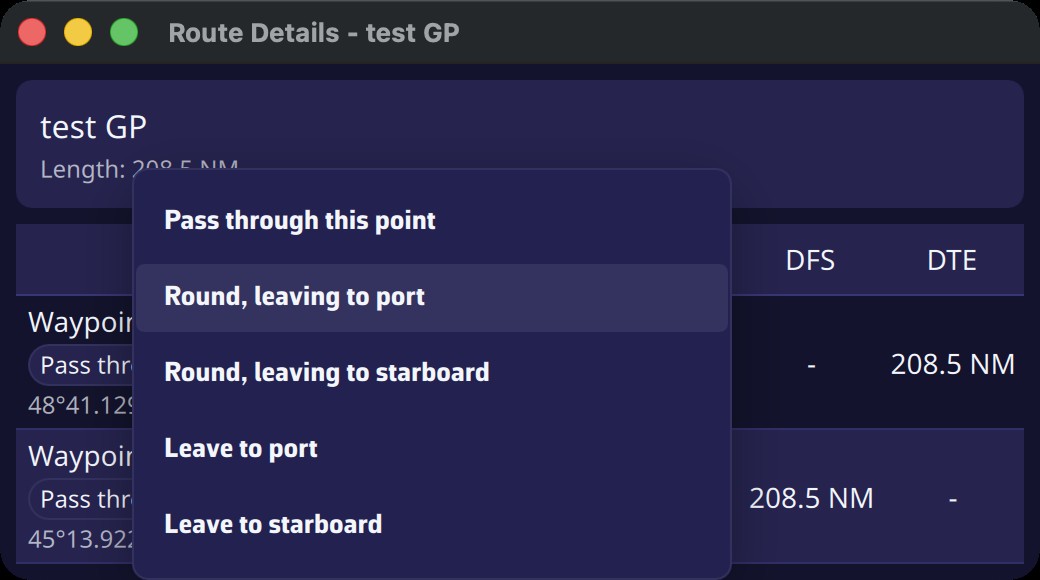
The menu therefore offers five entries, covering both notions without you having to combine them yourself.
Two useful details
The same mark can appear twice in a course with a different side each time: the common case of a windward-leeward course.
When you reverse a route, the sides flip with it: what was left to port is now left to starboard.
The side then appears in Route details and in the Course tracking instrument, where a filled arrow marks a mark to round and a hollow one a plain side constraint.
If your polar carries a Sailchart, the app knows at all times which sail it prescribes for the wind you have. Two instruments show it.
The short answer: the Sail tile
Add a Numeric value instrument and pick the Sail data. It shows the sail's code (J2, S2, C0…) on a label in its own colour, the same one used everywhere else in the app.
The full answer: the Sailchart tile
This instrument shows where you are on your own Sailchart. It is the counterpart of the polar performance tile, applied to sails: the radius is wind speed, both tacks are mirrored, and an orange dot marks your position.
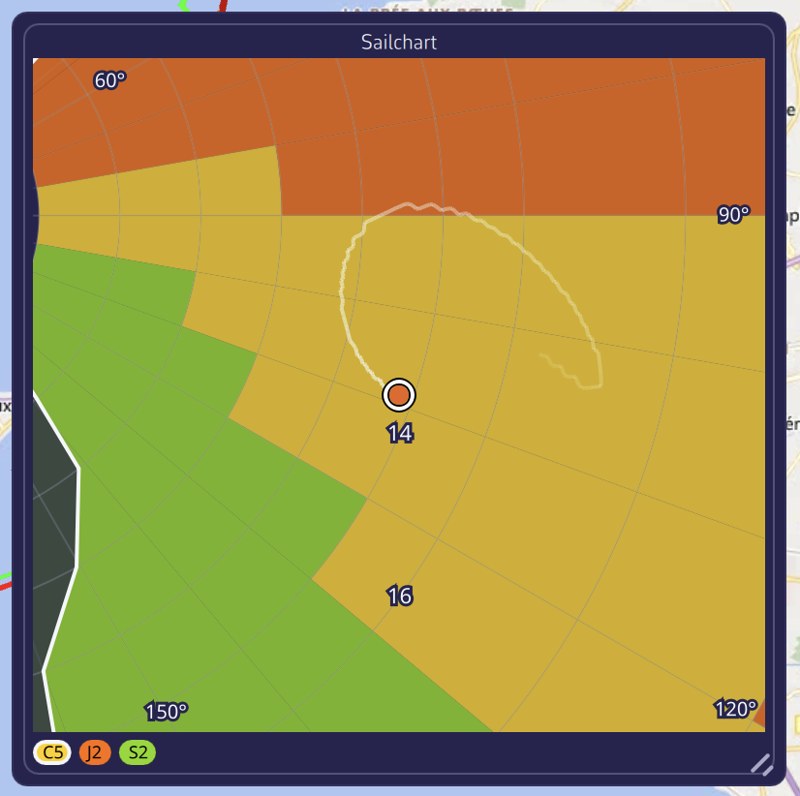
The view is zoomed around the boat, which stays at the centre. Seen whole, a two-knot shift would be a single pixel; from close up you see at once whether you are in the middle of a region or hard against a boundary.
The trail
This is what makes the tile worth having. Set in the instrument settings (None, 5, 10 or 30 minutes), it tells you whether the wind is building or dying, and whether a sail change is coming. The angle is signed, so a tack or a gybe reads as a jump from one side to the other.
The Zoom setting picks the wind band shown around you: ± 5, ± 10, ± 20 knots, or the whole Sailchart. The legend at the bottom names the visible sails, the one you carry being ringed.
How the sail is determined
Two precautions, the same the router takes. The angle is first folded into the best-VMG cones: hard on the wind the Sailchart holds nothing at 10°, although you are indeed carrying the sail of your beating angle. Then the current sail is fed back into the lookup, which stops the display flickering between two sails when you sail along a boundary.
Tracks are managed in two places:
- the Tracks tab of the left panel, to show and manage your tracks (your trips);
- Settings > My Boat > Track, to adjust the look of the track being recorded.
Track recording
Recording starts when you turn on Navigation mode (“Navigation” switch at the top of the left panel, reserved for the Premium subscription) and stops when you turn it off: the trip is then closed and filed in the list.
If you turn Navigation mode back on less than 30 minutes later, the previous track continues. If it ended more than 30 minutes and less than 3 days ago, the app asks whether to continue it or start a new one (“Continue” or “New track”). Beyond that, a new track starts. A trip left 48 hours without any movement is closed automatically.
The Tracks tab
Open the left panel with the chevron handle on the left edge of the screen, then choose the Tracks tab.
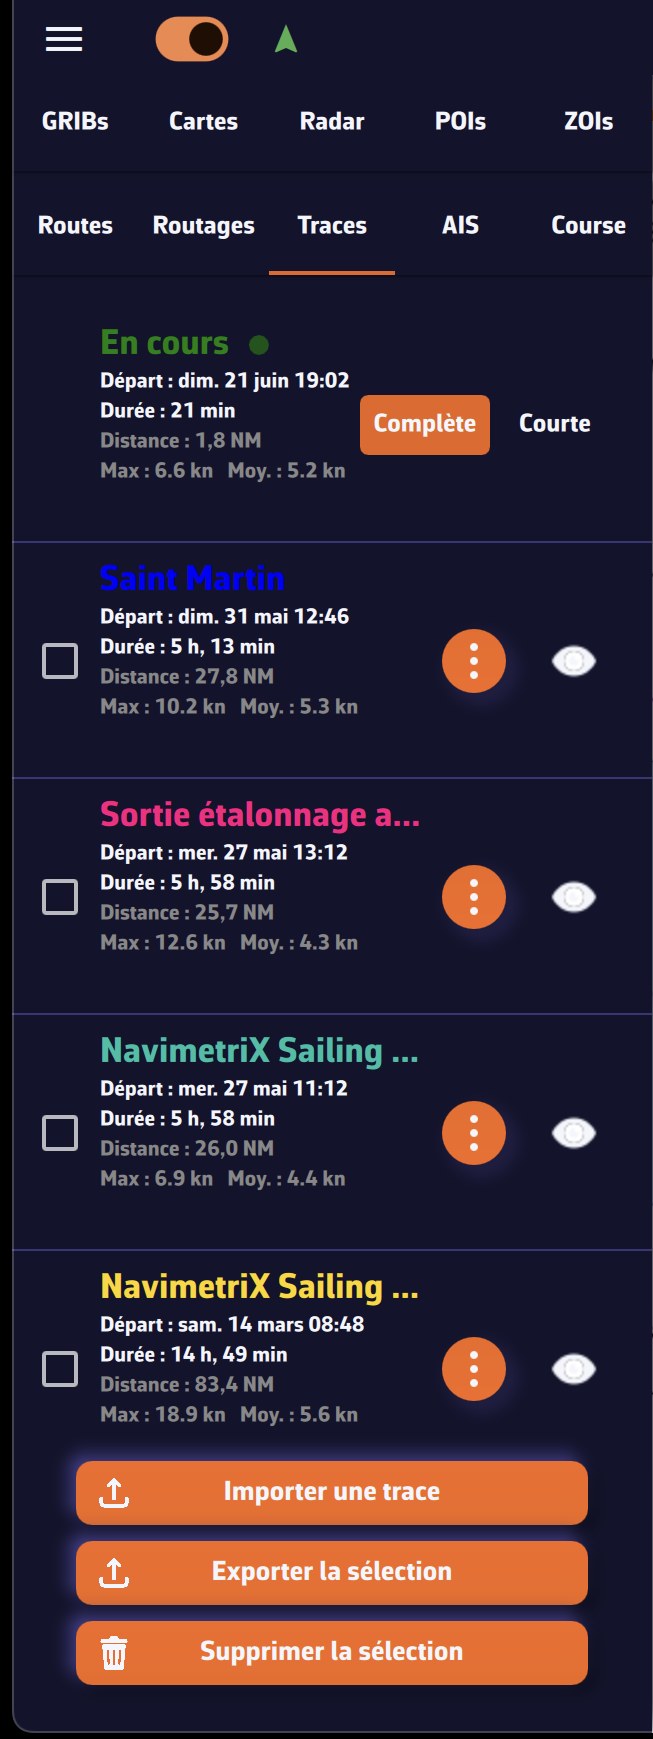
The track being recorded appears at the top, titled “Ongoing · this device”, with a pulsing red dot.
Each track shows its name, start date, duration, distance and its maximum and average speeds. For each track you have:
- the eye icon: show or hide the track on the chart (the chart zooms to the track when you show it); on the “Ongoing” row, the eye shows or hides the track being recorded;
- the ⋮ menu (three dots): Replay, Details, Logbook, Rename, Display, Share replay link (or Share live link for the ongoing track), Export (Share on a smartphone or tablet), Archive and Delete. For the ongoing track, Replay, Rename, Export, Archive and Delete are greyed out while recording goes on.
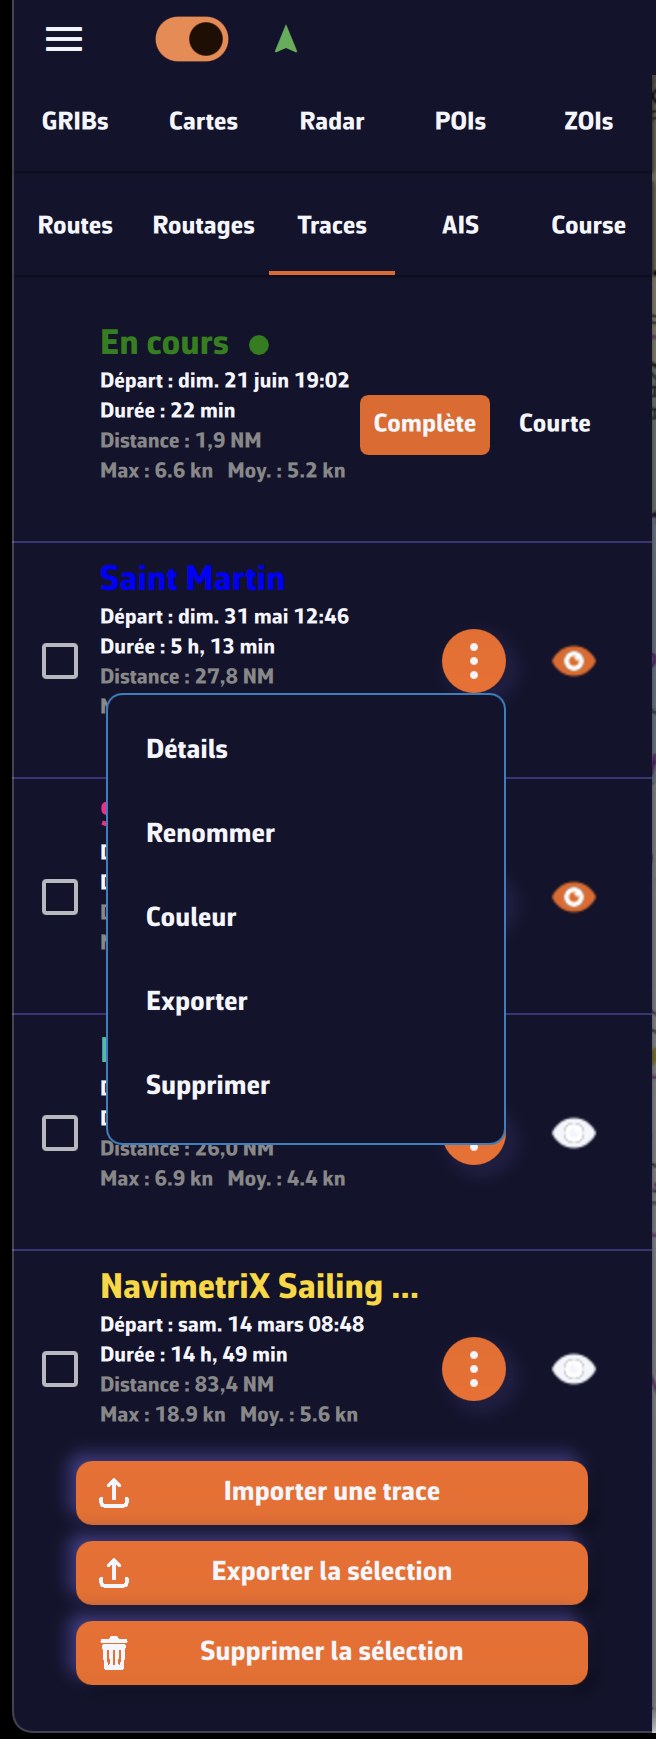
See also: How to replay a track, How to keep the logbook of a track, How to share a track by link and How to archive and organise my tracks.
Display of a track
The Display item of the ⋮ menu opens the “Track display” window. Changes apply immediately:
- Day numbers and Logbook events: show or hide these markers along the track;
- Follow boat during replay and Playback speed: how the track behaves during its Replay;
- Live track extent (ongoing track only): Full for the whole trip, Short for the last 20 minutes;
- Track color and line Thickness, for this track only.
Buttons at the bottom of the panel
At the bottom of the panel, three buttons act on one or more tracks (tick the boxes on the left to select them):
- Import: import a GPX file, a NavimetriX track (.nx), NMEA logs (.txt, .nmea, .log, .gz) or an Adrena track (.trz);
- Export (Share on a smartphone or tablet): export the ticked tracks, in NavimetriX format (.nx), which keeps the logbook, the Replay and the display settings, or in GPX format, which carries the points only;
- Delete: delete the ticked tracks, from your account and all your devices.
Adjust the look of the ongoing track
Open the Settings with the handle on the right edge of the screen, select My Boat, then the Track section.
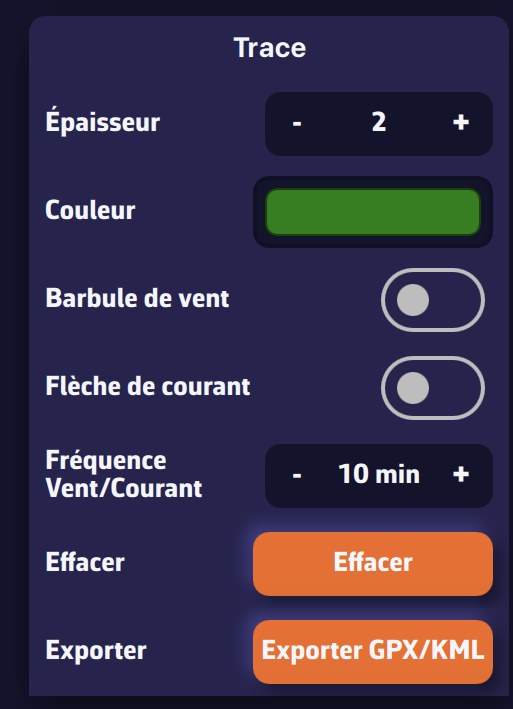
You can:
- set the line width (1 to 5);
- set the color of the track being recorded;
- show or hide wind barbs on the track;
- show or hide current arrows on the track;
- set the wind/current display frequency (in minutes);
- clear the ongoing track: after confirmation, it is deleted, from your account too. This cannot be undone.
The width set here also applies to recorded tracks for which you have not chosen a thickness in the “Track display” window.
Every trip recorded in Navigation mode can be replayed: the boat sails its course again on the chart, with the gauges of the day, the AIS targets you met, the logbook entries and the weather you actually encountered.
Starting a Replay
Open the left panel with the chevron handle on the left edge of the screen, Tracks tab, then the ⋮ menu of the track and choose Replay. Tapping the track on the chart opens the same menu.
The track currently being recorded cannot be replayed: stop Navigation mode first. If you replay another track while a trip is being recorded, the recording is suspended for the duration of the Replay (a gap is declared in the track and the logbook); the app asks you to confirm first.
In Details, the “Logbook:” line tells what the track holds: recorded, replayable (trip recorded with the app) or rebuilt from the track, replayable (imported GPX file: only the points are known, the Replay runs without the original gauges). When Replay is impossible (nothing was recorded, or the data are no longer on this device and cannot be fetched from your account), the menu item becomes “Replay (not recorded)” or “Replay (no longer on this device)” and stays greyed out.
During playback
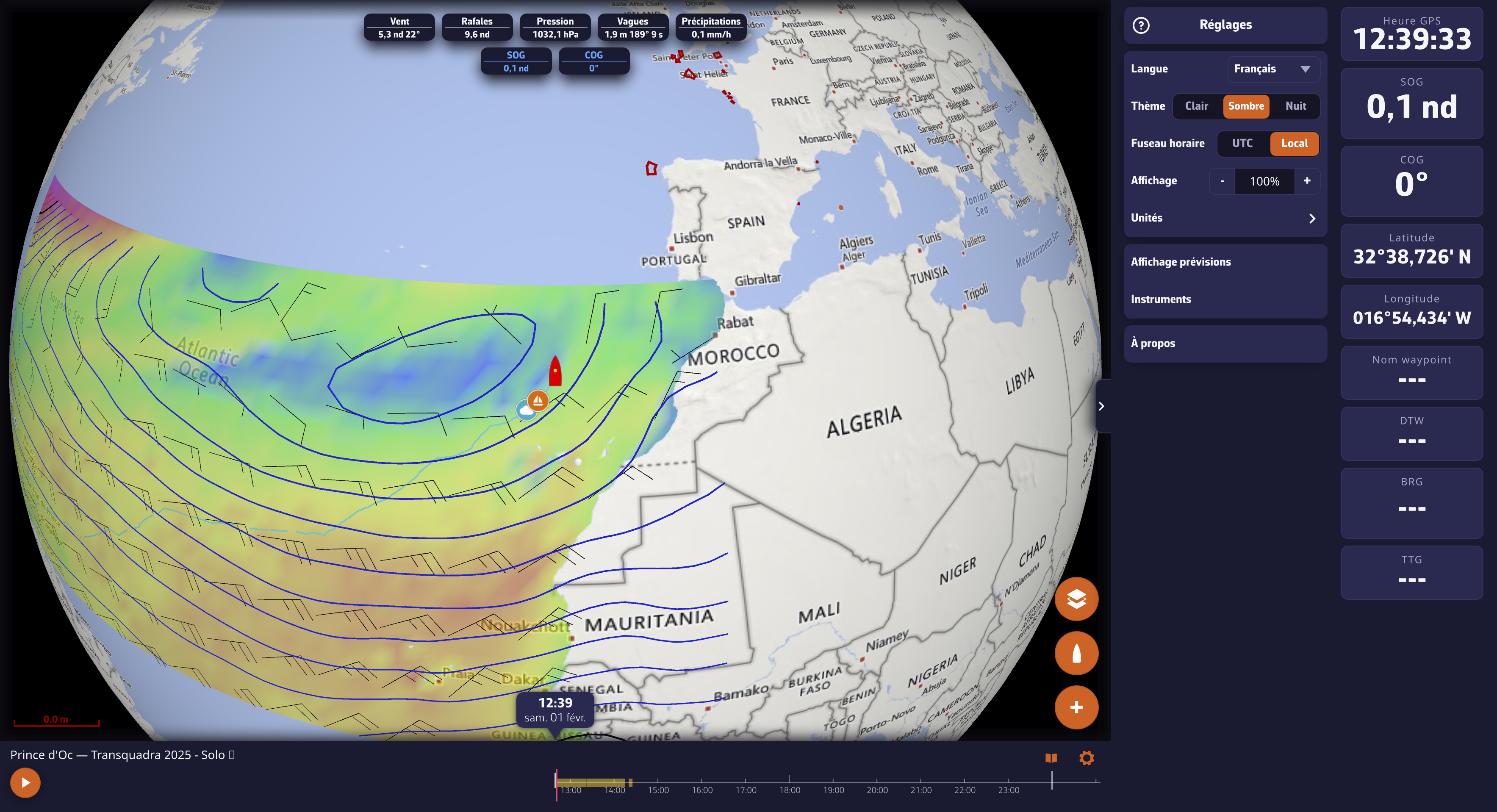
- The weather of the day loads by itself: isobars and wind barbs over the track, values along the way as playback goes on. On a long passage, the lows move with you.
- The timeline unfolds with a finger. A date bubble follows the cursor; below the timeline, the logbook curves (two series of your choice, wind barbs, rain as a histogram). In landscape on a phone, the timeline turns into a column.
- Playback speed follows the zoom: the closer you zoom on the chart, the slower the playback. The Playback speed setting (×½, ×1, ×2, ×4) of the “Track display” window slows it down or speeds it up. Jumps in time are travelled, not teleported.
- Tapping the track on the chart moves playback to that moment. The book-shaped button of the Replay banner opens the logbook: tapping an entry brings playback to that moment. On the chart, the menu of a logbook entry also offers “Go to this moment”.
- The Polar performance gauge draws the polar of the boat that sailed, target and percentage included, even on another device.
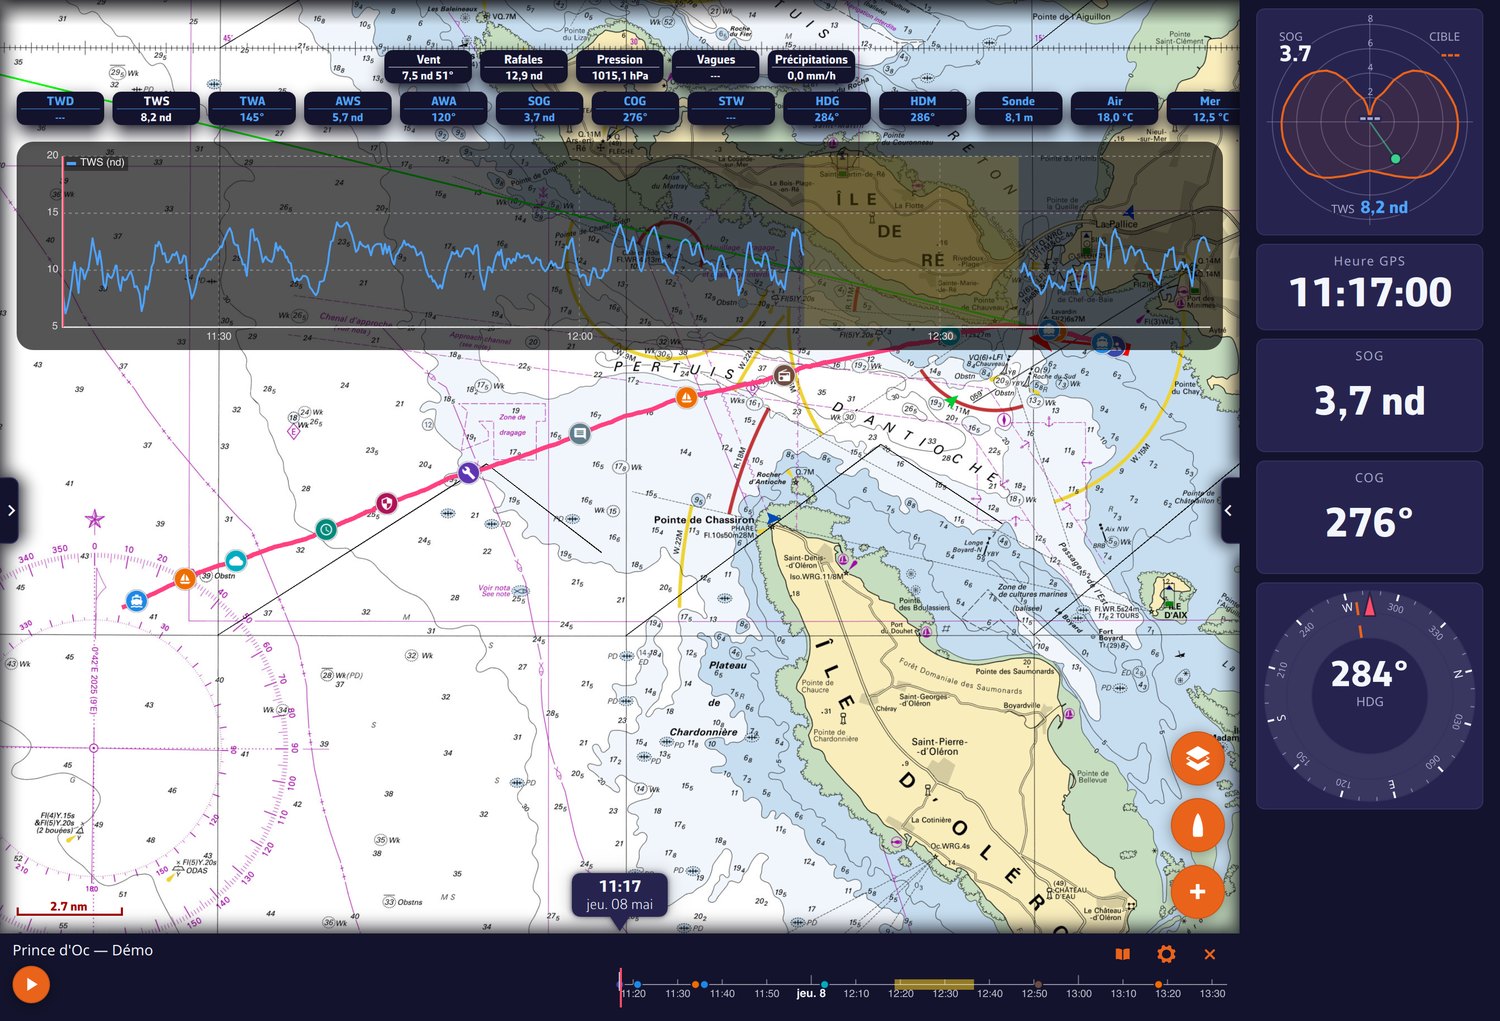
Settings remembered per track
The Track display window (⋮ menu of the track > Display, or the gear-shaped button of the Replay banner) sets, for each track: Follow boat during replay (off by default: the camera stays free), Playback speed, Day numbers and Logbook events, the colour and the thickness. These choices are synced across your devices.
During a Replay, navigation alarms and live AIS targets are suspended. To come back to the present, close the Replay banner.
See also: sharing a track by link and the logbook.
A track is now shared like a web page. The recipient clicks the link, and NavimetriX opens in their browser: no account, nothing to install. They replay your trip with the gauges of the day, the AIS targets around you and your logbook. They cannot change anything.
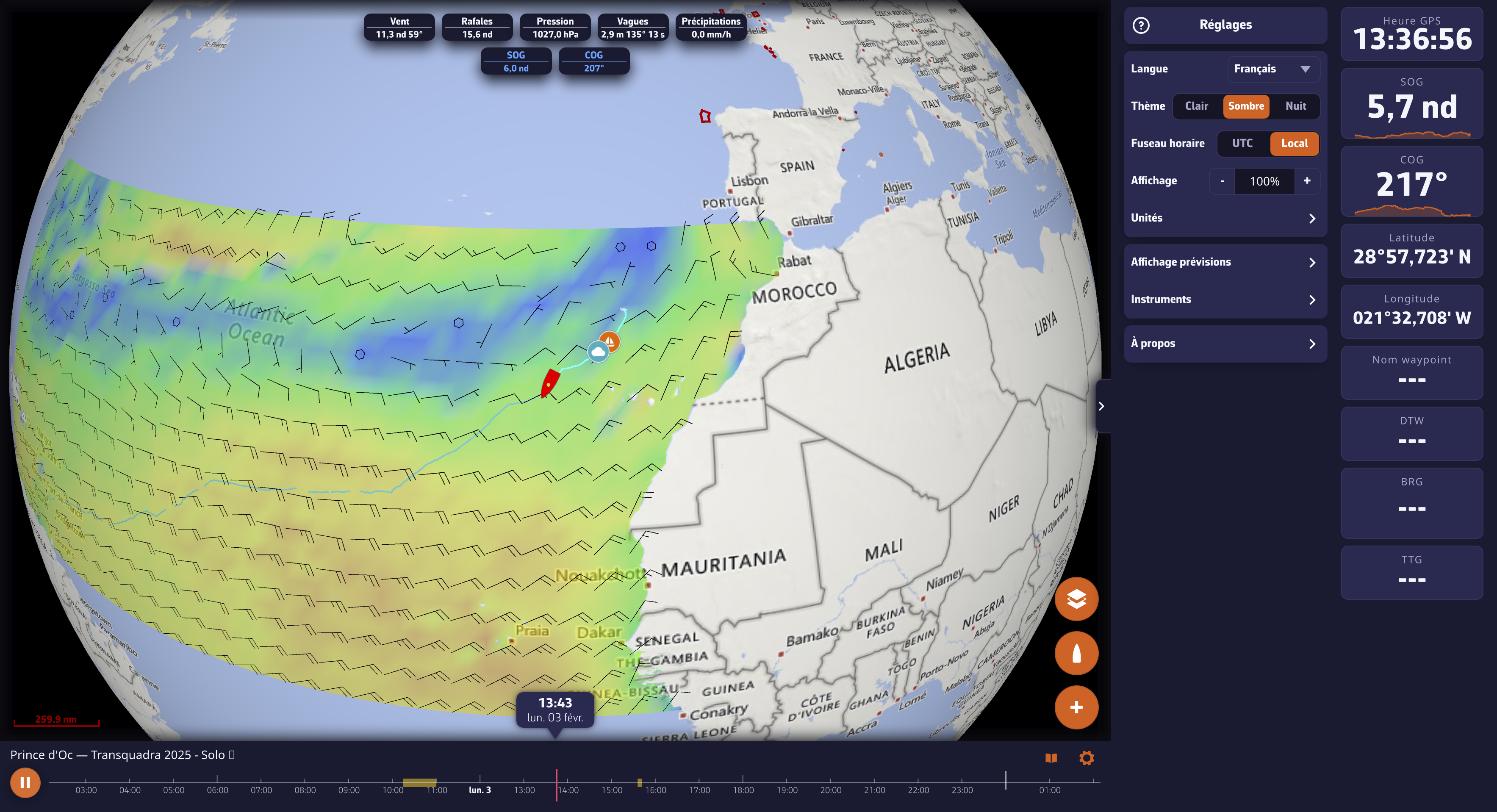
Getting the link
Open the left panel with the chevron handle on the left edge of the screen, Tracks tab, ⋮ menu of the track, then Share replay link (or Share live link for the ongoing track). The Share this track dialog prepares the link, then offers Copy or Send (mail, messaging, etc.).
Sharing goes through your NavimetriX account: the track must first be uploaded to it (you need to be signed in and online). If the dialog says "This track is not on your account yet", wait for the sync shown in the Tracks tab to finish.
Live
In the dialog, the Let them follow this track live switch decides, trip by trip, whether the link opens while you are sailing:
- on: as long as the boat is at sea, the link shows position, heading and gauges in real time, with a LIVE badge. The recipient can go back into the trip's past and return to the present with one gesture. Once the track ends, the same link becomes a Replay;
- off: "The link will only open once you end this track."
Revoking a link
Reopen the share dialog and choose Stop sharing: the link no longer opens, for anyone. Sharing again produces a new link.
Good to know
- Your track colour travels with the link and the chart frames itself.
- The same link, pasted into another user's NavimetriX app, opens the full Replay there.
- On iPhone, pin the link to the home screen (Share > "Add to Home Screen"): opened from its icon, it fills the whole screen, without the browser bars.
- To hand a complete trip (logbook, Replay, statistics) to someone who uses NavimetriX, export it in the .nx format.
Archive folders
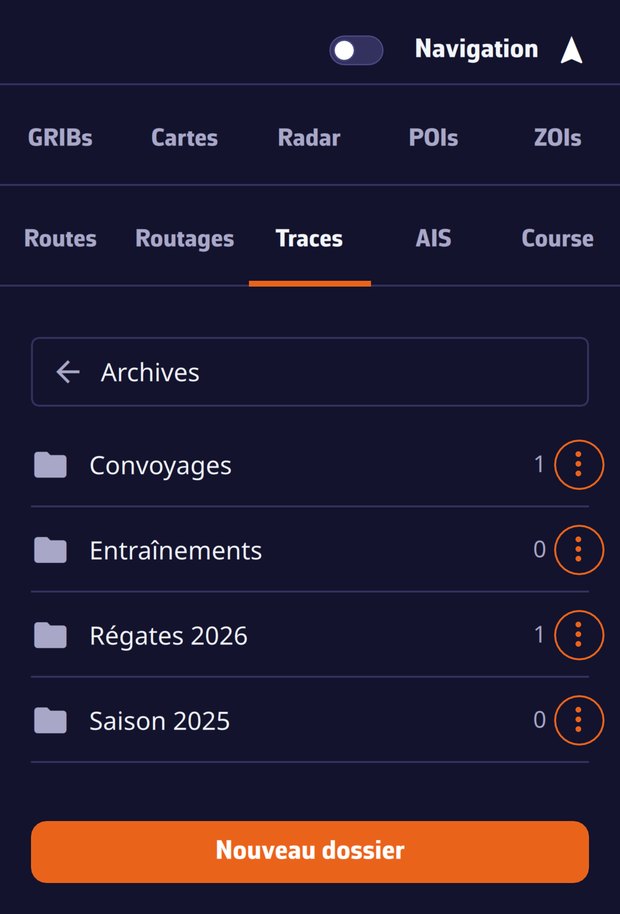
Create the folders you like, "Regattas 2026", "Deliveries"…, and file away the trips that no longer belong in the current list:
- ⋮ menu of the track > Archive, then pick a folder or New folder… (the very first time, the app asks straight away for the folder name);
- an archived track leaves the list and the chart;
- as soon as a track is filed away, an Archives (n) bar appears at the top of the Tracks tab: it opens your folders, and becomes the back button once inside;
- inside a folder, the ⋮ menu of a track offers Move to… (to another folder) and Unarchive (back to the current list);
- folders are renamed and deleted from their own ⋮ menu (Rename, Delete folder). Deleting a folder deletes no track: they go back to the current list.
The filing follows your account: tidy up your season on the computer, it is tidy on the tablet.
The .nx format
When exporting a track (⋮ menu > Export, or the Export button at the bottom of the tab for the ticked tracks; Share on a smartphone or tablet), the app asks for the format:
- NavimetriX (.nx): the complete trip in one file, track, logbook, Replay data, statistics and display settings. Handed to another NavimetriX user, it stays named, annotated and replayable;
- GPX: the points only, for other applications.
An imported .nx file (Import button at the bottom of the Tracks tab) joins your account and shows up on all your devices, Replay included.
The local trash
Deleting a track removes it from your account and all your devices. On the device where you deleted it, the track file is nevertheless set aside for 30 days in the tracks/trash folder of the app's data. On a computer, a slip of the finger is fixed by importing that file again; on phones and tablets, this folder stays in the app's private storage, out of reach of the file picker.
Yes. As soon as you are signed in to your NavimetriX account, all your tracks go up to the account, older ones and imported GPX files included, and every device signed in to the same account shows the same list.
What follows the account
- the track itself and its Replay data;
- its name: rename it on the Mac, it is renamed on the iPhone;
- the eye (track shown or hidden on the chart) and its colour;
- the logbook and its entries, written at sea or during a Replay;
- the archive folders and the filing of the tracks;
- the Replay playback settings, remembered per track.
While syncing, the Tracks panel shows a status line ("sending n chunks", "fetching a track from your account", "a track is on its way from another device…") with a progress bar. It goes away by itself when idle.
A trip under way on another device
The trip your tablet is recording on board shows up right away in the list of the computer left at home, under the trip's name, with Device: and the tablet's name, and opens LIVE: the boat moves in real time on the chart, with live gauges.
Switching accounts
If you sign out and sign in with another account, the app fetches that account's tracks and removes the previous account's tracks from the device (they stay on their account, and their files go through the local trash). A banner shows the sync progress (settings, list, tracks, upload) during the switch. Tracks recorded without an account are adopted by the first account that signs in.
Without a connection
Everything is offline-first: the track is recorded on the device, the logbook fills up, and the upload to the account happens as soon as the network is back. Nothing waits for the connection.
Every track carries its logbook. It opens from the ⋮ menu of the track in the Tracks tab (Logbook item) or, during a Replay, with the book-shaped button of the banner. Entries are written while sailing or afterwards, during a Replay of your trip: round orange + button > Add a logbook entry, or the Add button of the logbook of the ongoing track.
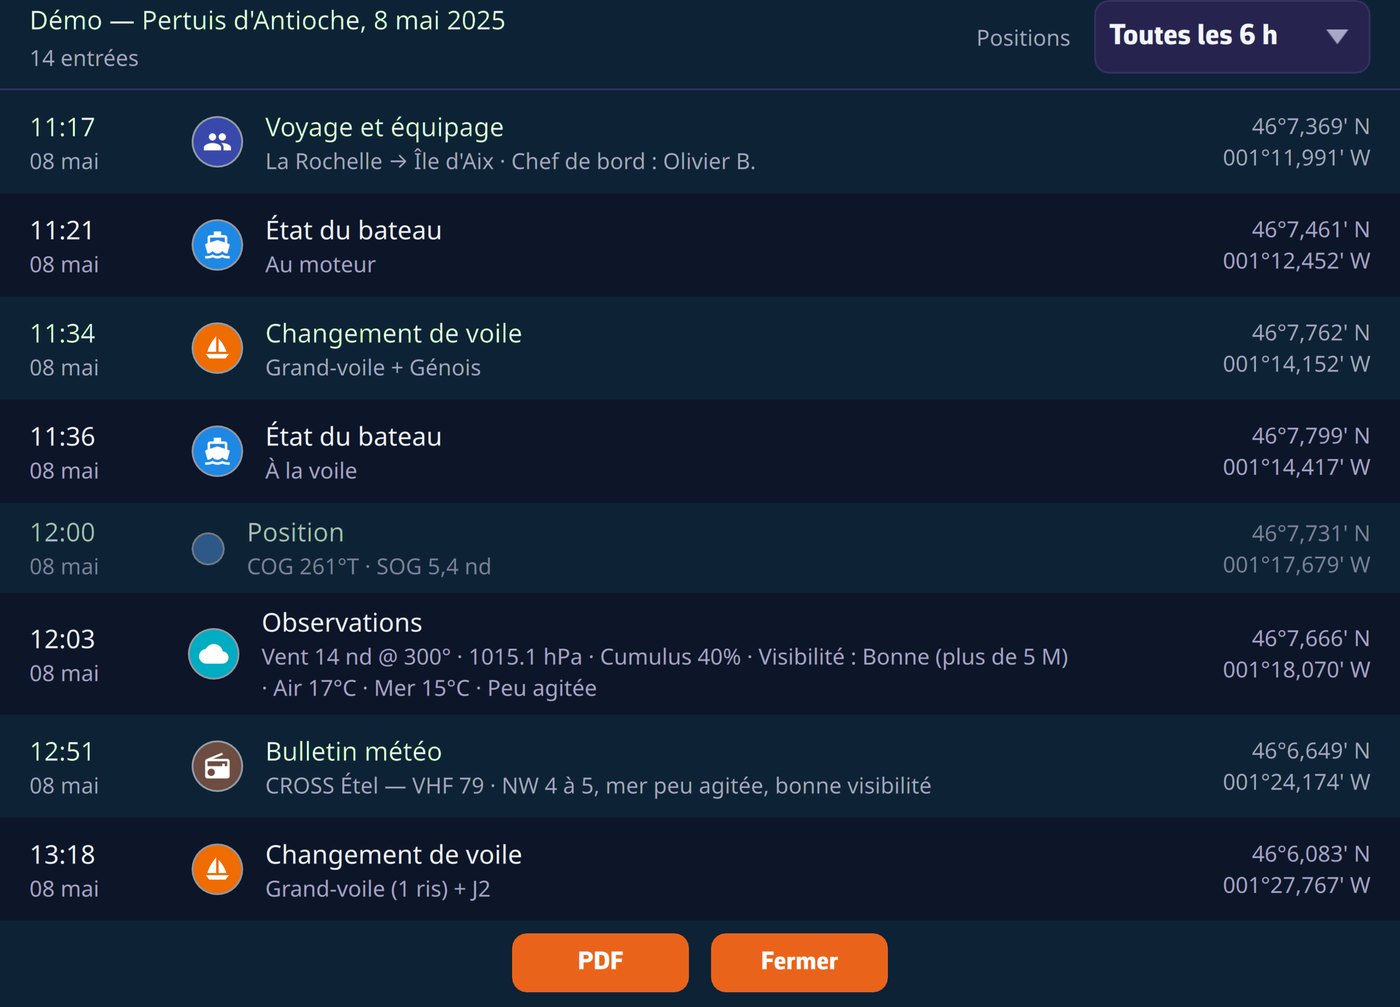
The entries
- Eleven categories: Voyage & crew, Boat status, Comment, Observations, Sail change, Watch handover, Technical event, Failure, Safety event, Weather bulletin and Racing event. Every entry is time-stamped and geolocated, and shows as a pictogram on the track, at every zoom level.
- Automatic periodic positions: the app derives a position line from the track at the rate of your choice (“Positions” list of the logbook: Hourly, Every 6 h, Every 12 h, Every 24 h, or Hidden to not show them), with a summary of the trip: distance, time under way, maxima, engine hours.
- Man overboard: the MOB button, like the reception of an AIS MOB beacon, creates the safety entry by itself, at the activation position, with the beacon's MMSI.
- Nothing disappears silently: every change or deletion is archived, and a corrected entry carries the mention “Edited (rev. N)” in its detail and in the PDF, the legible crossing-out of the paper logbook.
The regulatory PDF export
One tap produces a PDF ready to print or file:
- cover page with the vessel's identity (registration, call sign, home port) and the voyage & crew sheet, pre-filled from the previous trip;
- the chart of your passage in the page background, composed from the chart cache, so also at anchor without a connection;
- SHA-256 fingerprint at the foot of the document: the content can be verified.
The logbook follows your account: written on the tablet, it is on the computer when you get home. It can also be read by the recipient of a share link and travels with the .nx file.